Picking Highly Profitable Businesses Can Be Unprofitable
Evaluating the Unusual Characteristics of the Profitability Factor
August 2020. Reading Time: 10 Minutes. Author: Nicolas Rabener.
SUMMARY
- There seems to be a relationship between the Profitability factor and interest rates
- The most profitable stocks outperformed the least profitable ones when market cap-weighted
- However, when equal-weighted, the least profitable stocks outperformed
INTRODUCTION
The gap between theory and reality in finance is sometimes fuzzy, at other times crystal clear. Ask an academic what explains stock returns and he will come up with three to six factors, which are supported by hundreds of research papers from across the globe. Ask an ETF analyst to show you the money and he might point out that investors have allocated $265 billion to smart beta ETFs in the US that focus on Growth stocks, which represents a factor that has very little academic support, compared to only $195 billion in Value. It seems that the majority of these ETF investors do not only ignore research that literally spans centuries, but are perfectly happy to take the other side of the trade. Stated differently, they are shorting science and armies of PhDs.
However, other academically-established factors do much worse than Value. For example, it is challenging to find any ETF that offers exposure to the Investment factor, which is part of Fama-French’s five-factor model. Perhaps this one is simply too esoteric for most folks as the portfolio is long stocks that exhibit slow asset growth and short ones that have high asset growth. What does that actually mean? And why should asset growth be relevant for stock returns?
Having said this, even more unusual is why there are only $20 billion in Quality-focused ETFs. Selecting stocks on measures like profitability is supported by research and equally emotionally appealing. Who does not like stocks that have high profit margins, feature low leverage, show consistent growth in sales and earnings, or have other attributes that demonstrate quality characteristics in businesses?
In this short research note, we will explore the Profitability factor and try to identify reasons that might explain the lack of popularity (read The Odd Factors: Profitability & Investment).
PERFORMANCE OF THE PROFITABILITY FACTOR
We are going to use factor returns from the Kenneth R. French data library and focus on the US stock market, where data is available since 1963. The Profitability factor is called robust minus weak (RMW) in academic research and stocks are ranked by the ratio of operating profits over book equity.
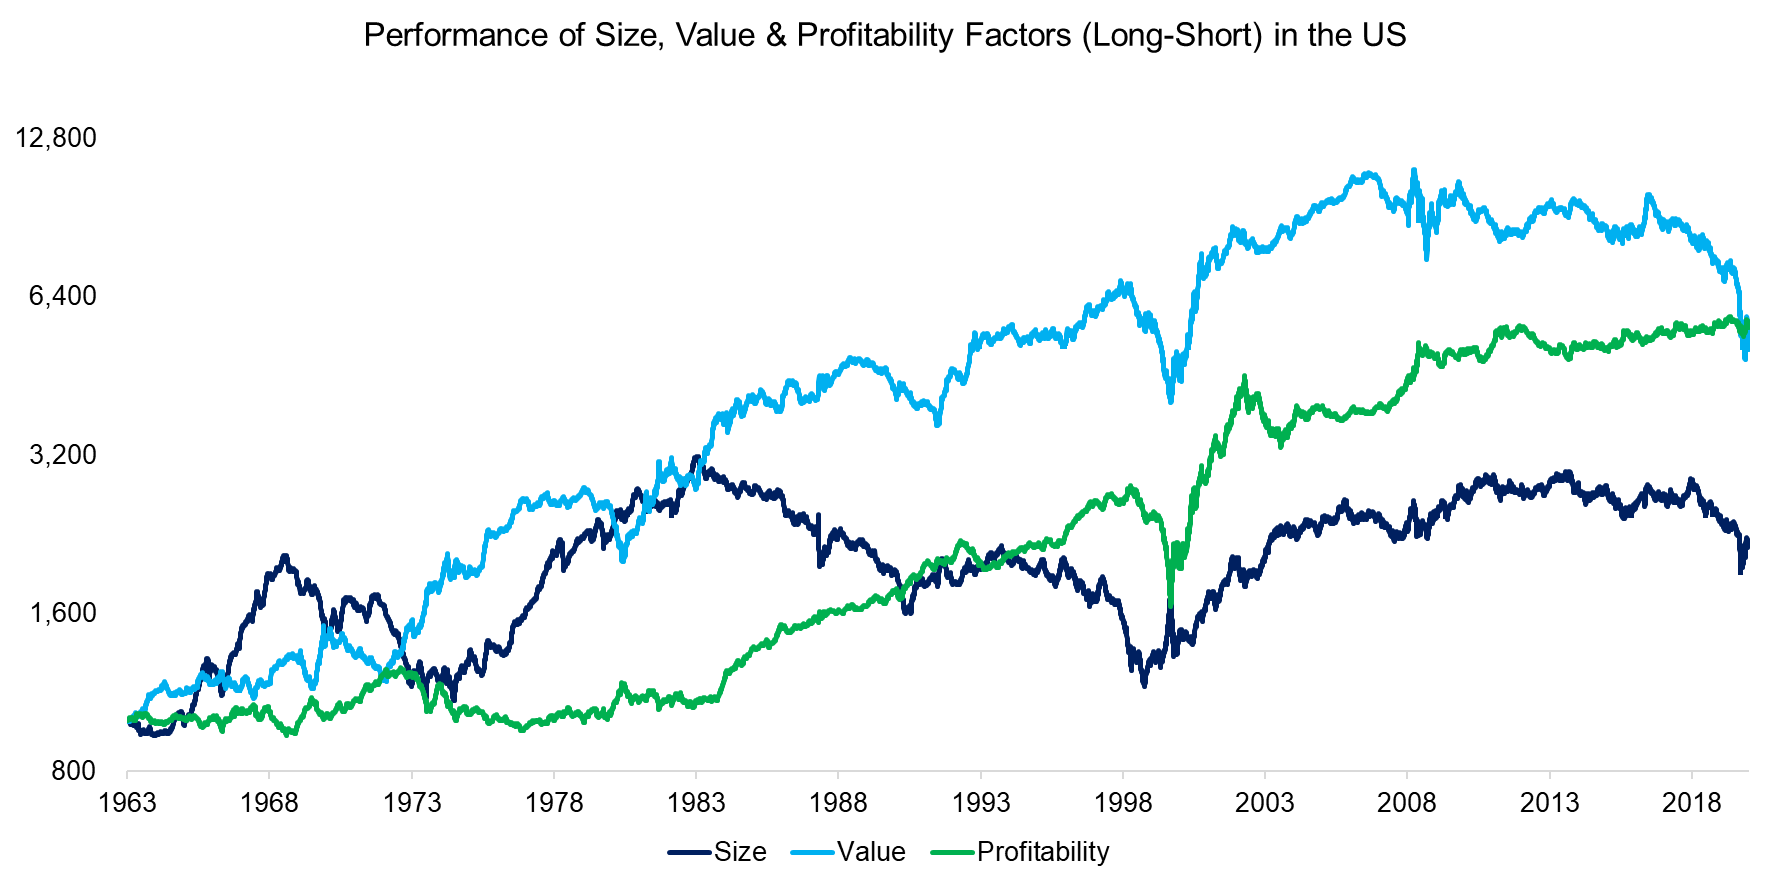
We compare the long-short performance of the Profitability factor with Size and Value, which highlights some similarities and some differences. Value and Profitability shared many common trends in performance and seemed highly correlated between 1983 and 2010. All three factors had significant drawdowns during the tech bubble in 1998 to 2000 when investors preferred large, expensive, and unprofitable tech stocks over small, cheap, and profitable companies. In the most recent decade, cheap and small-cap stocks underperformed while selecting profitable firms generated a slightly positive return.
Source: Kenneth R. French data library, FactorResearch
WHAT DRIVES THE PERFORMANCE OF THE PROFITABILITY FACTOR?
Based on the performance of the Profitability factor over the last approximately 60 years, it is surprising that it has not received more attention from investors. The returns were significantly more consistent (risk-return ratio of 0.64) compared to Value (0.44) and Size (0.19) and the factor experienced essentially only one large drawdown during the tech bubble.
However, chasing factor performance is as sensible as selecting the best performing mutual funds. Although a difficult endeavor that is unlikely ever fully satisfied, it is important to try to understand what drives factor performance. We observe that the Profitability factor started generating positive returns only from 1983 onward, before that there was a 20-year period of flat performance, which provides food for thought.
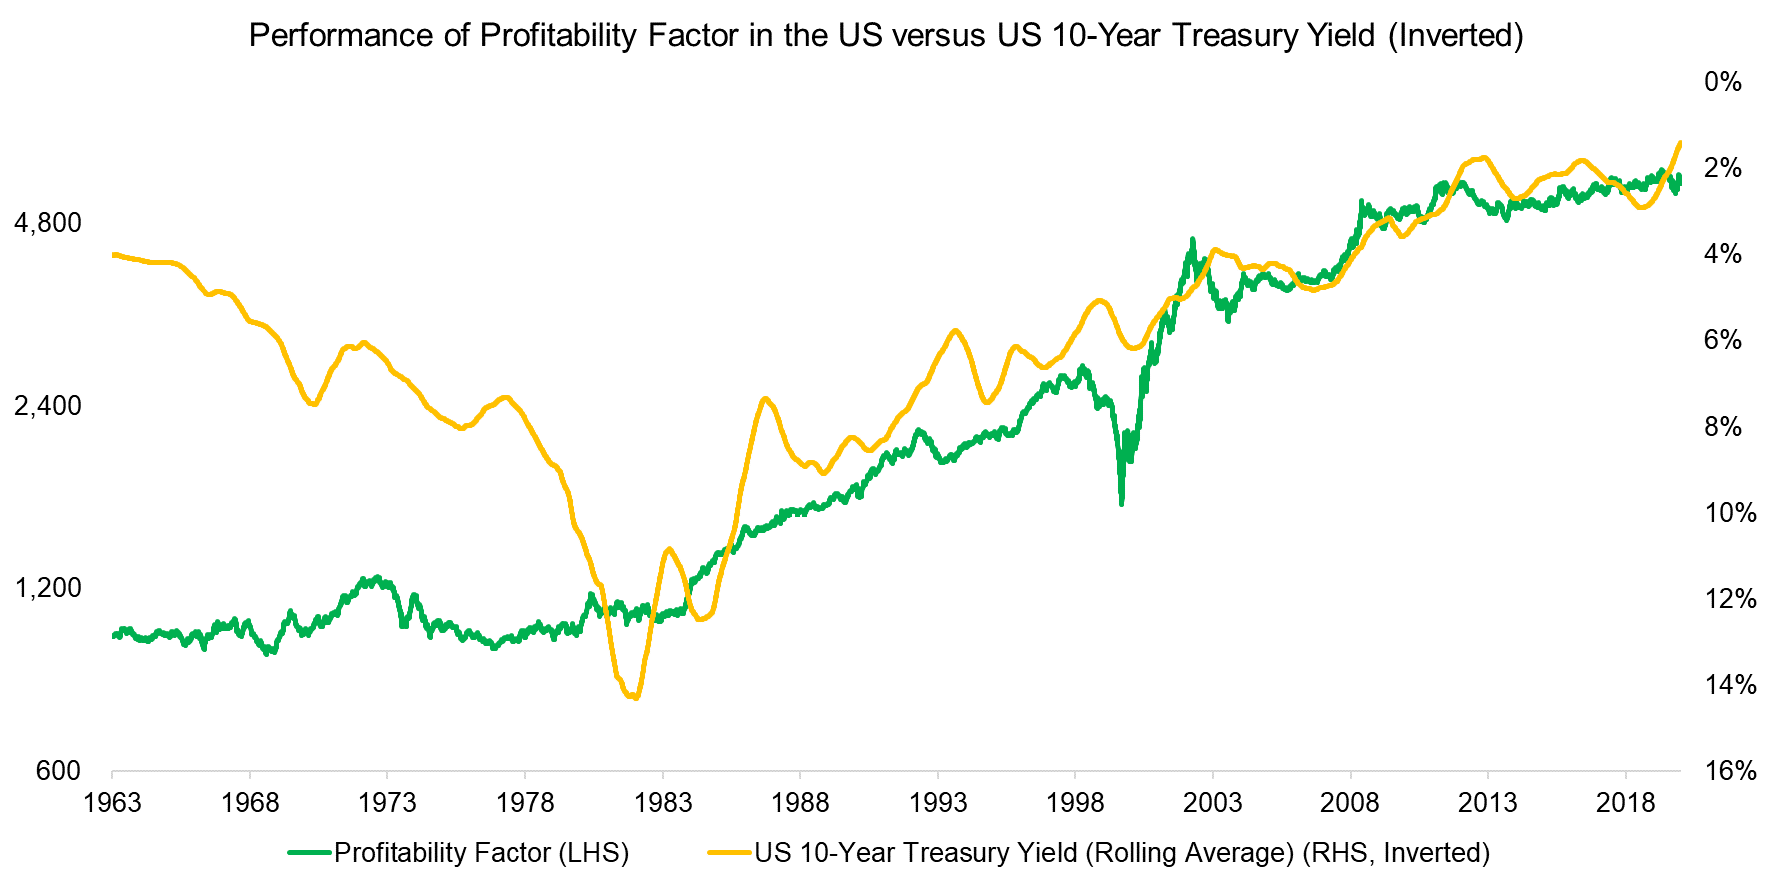
Interest rates in the US reached their peak around 1981 and declined consistently thereafter. Given this, we show the inverted yield curve of the US 10-year treasury bond, which highlights a positive relationship between declining bond yields and the performance of the Profitability factor (read Factors & Interest Rates).
Although the chart is visually appealing, it is unusual that the factor returns were not negative when bond yields were increasing, i.e. between 1963 and 1983.
Furthermore, why would declining bond yields be more accretive for profitable than unprofitable firms? Loss-making businesses arguably benefit more from reduced interest expenses as they can not operate long without profits. For example, improving profit margins from -5% to 0% should be viewed more positively by investors than an increase from 15% to 20%.
More research is required to confirm this relationship and provide explanations for these questions, but it seems more than just a coincidence.
Source: Kenneth R. French Data Library, FactorResearch
MOST VERSUS LEAST PROFITABLE STOCKS
Although it is interesting to review the positive performance of the Profitability factor, it is rather theoretical as most investors allocate to long-only and not long-short portfolios. Given this, it is important to establish if the excess returns are derived from the long or short portfolio.
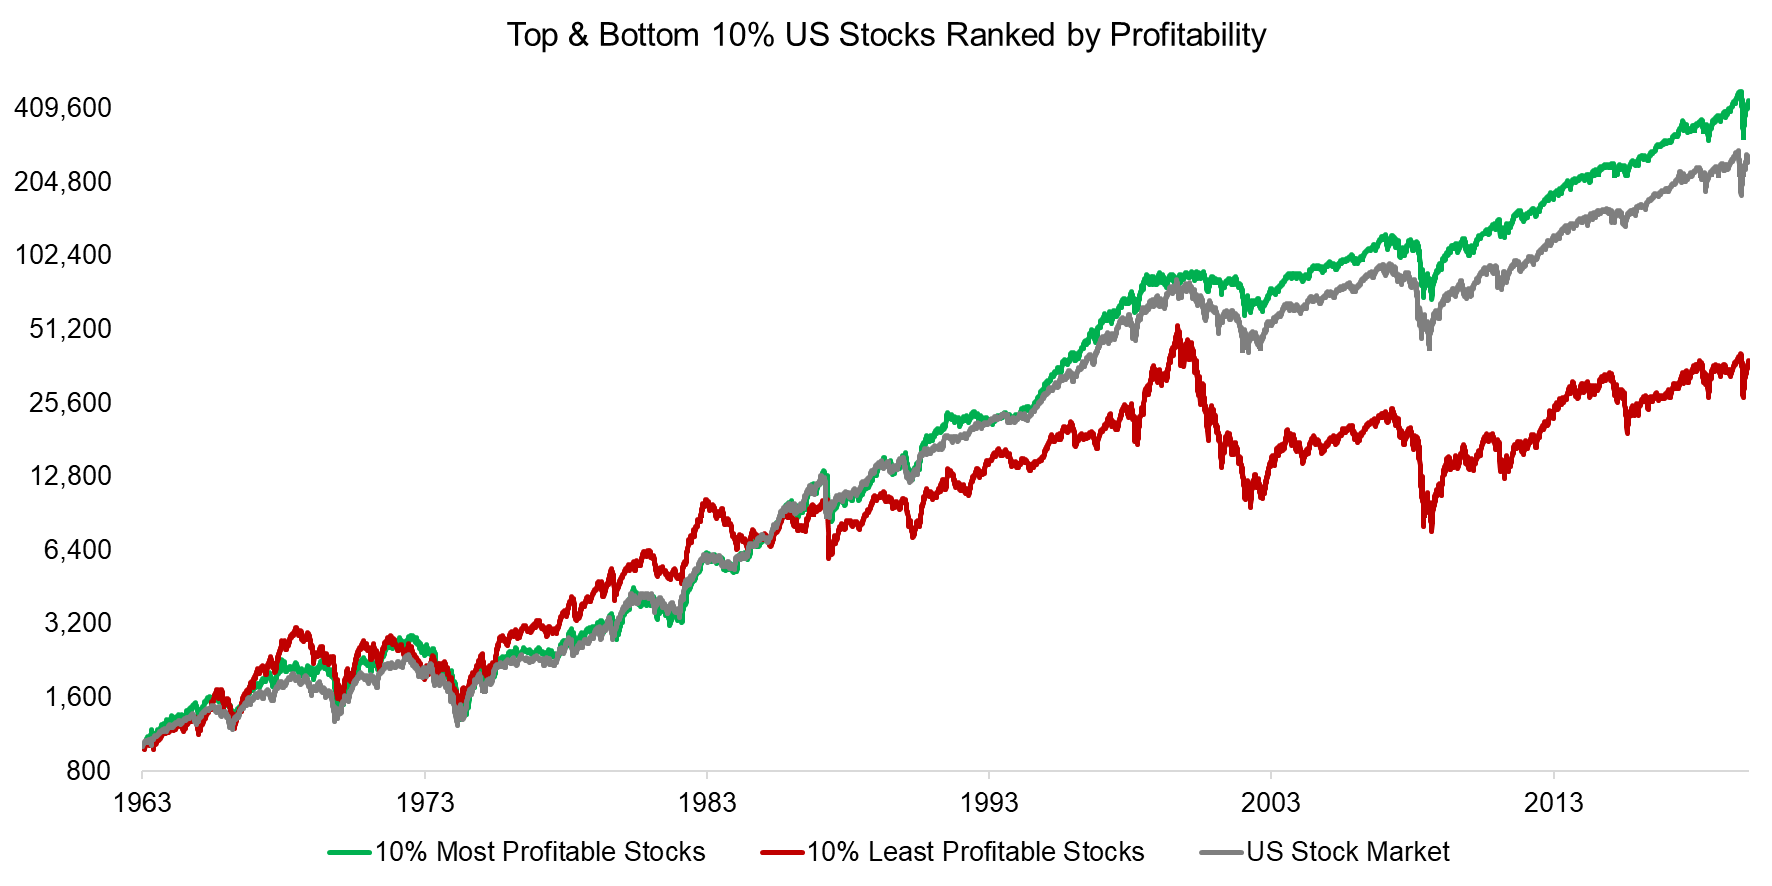
Analyzing the top and bottom 10% of US stocks ranked by profitability and weighted by their market capitalization highlights that most of the factor performance is explained by the underperformance of the least profitable companies, i.e the short portfolio. In fact, betting on the most profitable companies generated only a slightly better return than the stock market, primarily due to the better performance of highly profitable companies during the tech bubble implosion from 2001 to 2003.
Given these results, profitability seems more useful as a filter for excluding stocks than as a stand-alone criterion for stock selection.
Source: Kenneth R. French Data Library, FactorResearch
We can further analyze the most and least profitable companies by changing the stock weighting from market capitalization to equal-weighting. Theoretically, equal-weighting is the better approach to weighting as the returns are less influenced by the Size factor. Practically, market capitalization is more relevant as investors want to minimize transaction costs, which requires trading larger and more liquid stocks.
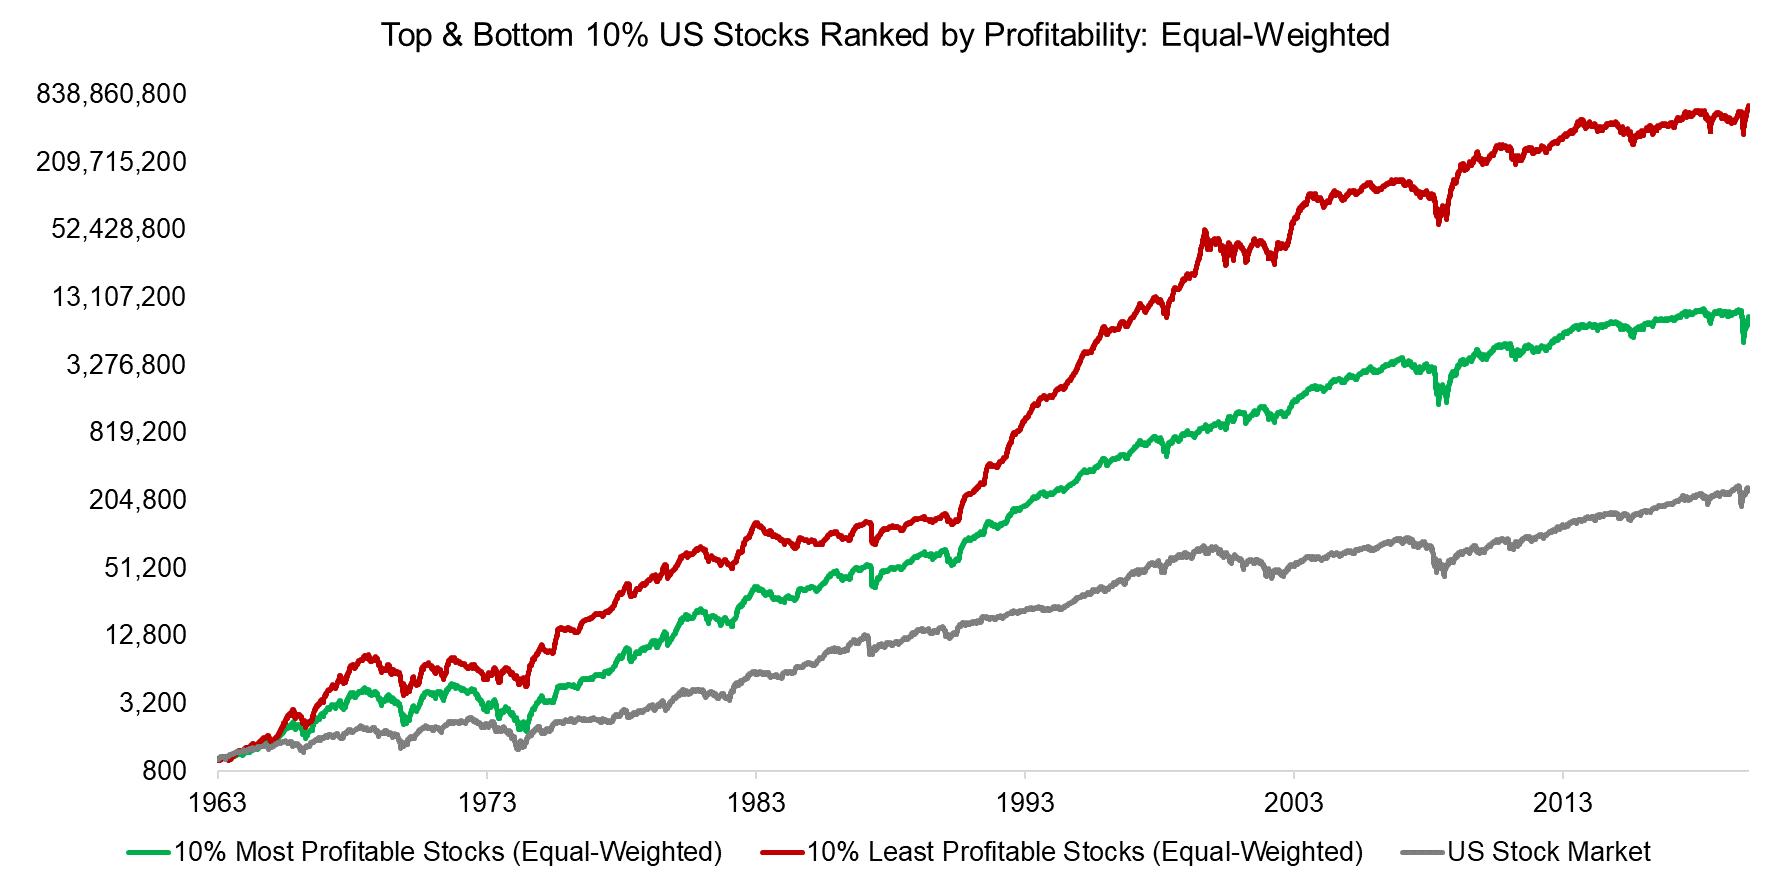
Somewhat surprisingly, the least profitable stocks significantly outperformed the most profitable companies when weighted equally. It is also worth highlighting that both portfolios outperformed the US stock market, which is market-capitalization-weighted.
Source: Kenneth R. French Data Library, FactorResearch
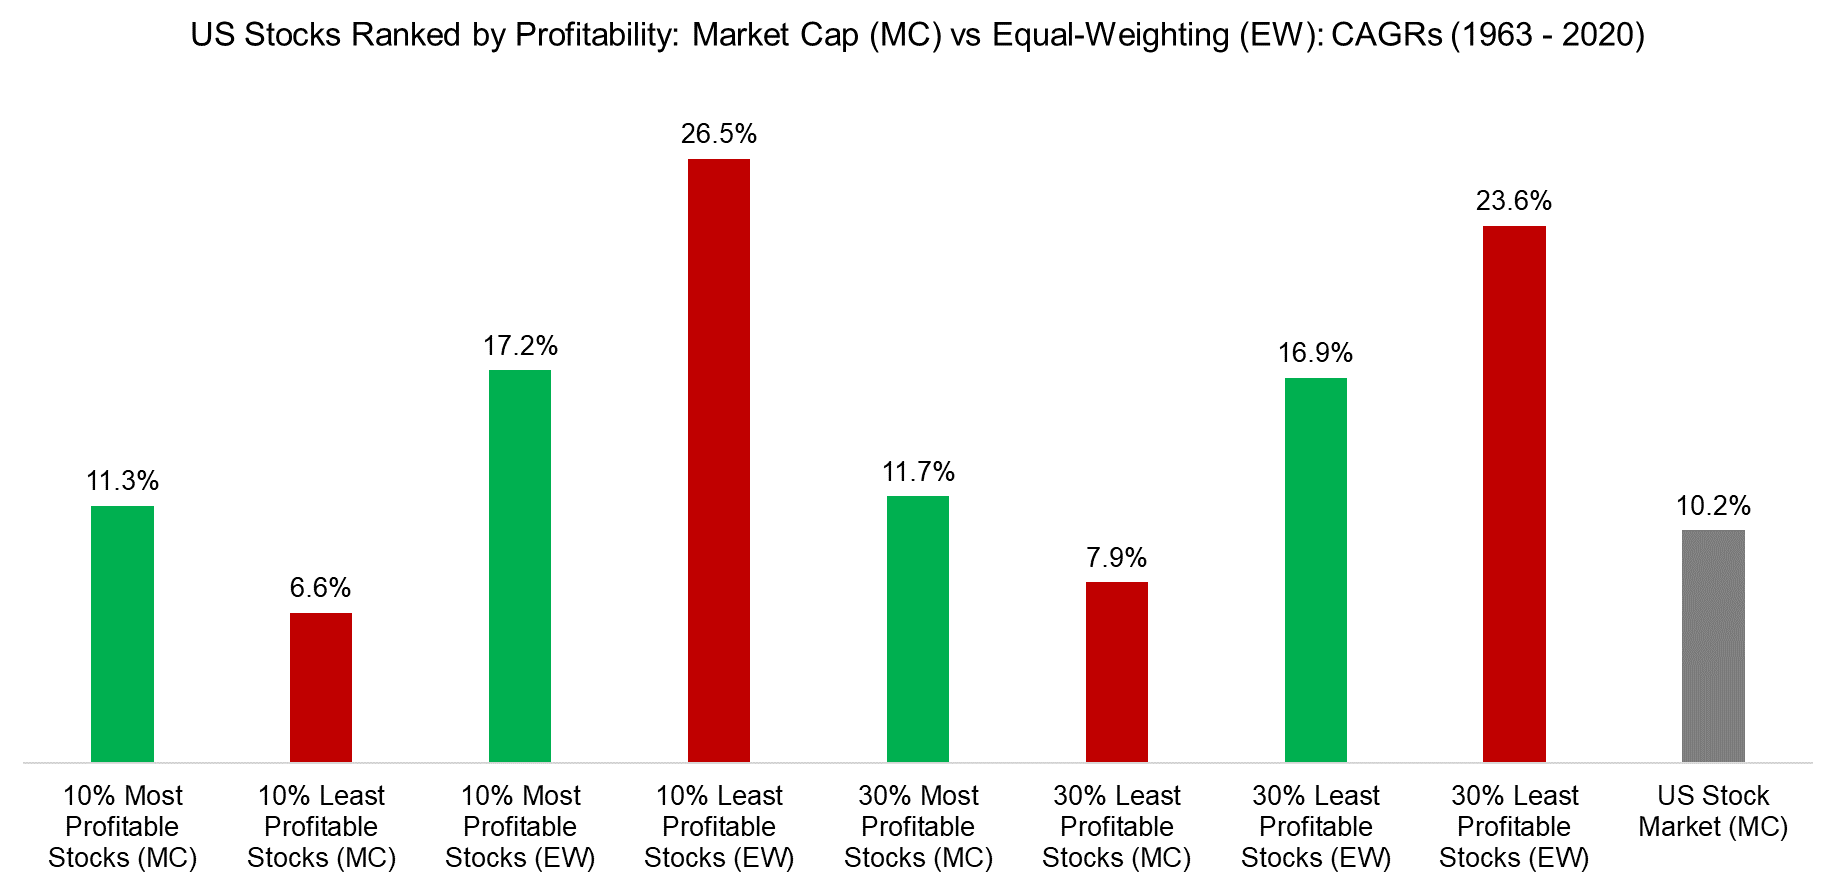
We can further investigate these rather unusual results by increasing the portfolio size from the top and bottom 10% to 30%, however, the conclusion does not change: on an equal-weighted basis, unprofitable stocks significantly outperformed profitable ones.
These results are likely explained by a few unprofitable micro or small-cap stocks that generated outsized returns. For example, consider a small biotech firm with one drug in the development pipeline that has been bleeding cash for years and one day receives approval from the FDA to move their product to the clinical trial stage. Such news typically results in large stock price gains.
Source: Kenneth R. French Data Library, FactorResearch
FURTHER THOUGHTS
Does the relatively low amount of assets that is allocated to Quality-themed smart beta ETFs in the US reflect some sort of wisdom of the crowd?
We only evaluated profitability as a metric for identifying high-quality businesses, but have not uncovered any substantial risks, at least when stocks are weighted by their market capitalization, which applies to the majority of investors. However, profitability seems most useful when used as a filter for excluding stocks in portfolio construction.
Investors who are not concerned with transacting in less liquid stocks might consider betting evenly on unprofitable firms, which was surprisingly profitable.
RELATED RESEARCH
ABOUT THE AUTHOR
Nicolas Rabener is the CEO & Founder of Finominal, which empowers professional investors with data, technology, and research insights to improve their investment outcomes. Previously he created Jackdaw Capital, an award-winning quantitative hedge fund. Before that Nicolas worked at GIC and Citigroup in London and New York. Nicolas holds a Master of Finance from HHL Leipzig Graduate School of Management, is a CAIA charter holder, and enjoys endurance sports (Ironman & 100km Ultramarathon).
Connect with me on LinkedIn or X.

