CROIC, CFROI, CROCI & CROCS
Searching for better value metrics
September 2020. Reading Time: 10 Minutes. Author: Nicolas Rabener.
SUMMARY
- Cash-return-on-invested-capital (CROIC) has been proposed by some as a superior Value metric
- Since the GFC in 2009, CROIC generated consistently positive compared to flat (or negative) returns from traditional valuation metrics
- However, CROIC turns out to be just a simple combination of Value & Quality factors
INTRODUCTION
CROIC, CFROI, CROCI & CROCS – the first three of these are financial ratios, the last one of them is an ugly, but comfortable shoe.
Given that the shoe has been sold more than 300 million times and became even more popular during the work-from-home environment in 2020, most readers probably identified Crocs as the odd one. Some might even be wearing a pair right now.
The first three acronyms refer to financial ratios that aim to offer an alternative to traditional valuation metrics. Two have been popularized by banks, i.e. Deutsche Bank claims cash-return-on-capital-invested (CROCI) and Credit Suisse cashflow-return-on-investment (CFROI). The numerator usually consists of EBITDA, NOPAT, free or operating cashflow, while the denominator is comprised of invested capital.
However, the definitions vary and investors should be cautious. For example, Investopedia, perhaps not the most highly regarded website by quantitative researchers, shows total equity value in the denominator for CROCI, but then states below the formula that long-term debt should also be included. Naturally, total equity value does not include long-term debt, so the formula and definition should be corrected.
Proponents argue that these are superior valuation metrics as they highlight the relationship between cashflow generation and invested capital, which is less stale than price-to-book and less prone to manipulation than price-to-earnings ratios. They provide a better perspective on the economics of a business.
In this short research note, we will investigate cash-return-on-invested-capital (CROIC) as an alternative Value metric (read Value Factor – Comparing Valuation Metrics).
CROIC VERSUS VALUE FACTOR PERFORMANCE IN THE US
We define CROIC as EBITDA divided by invested capital, where the latter is calculated as the sum of book equity and debt. We focus on all stocks in the US with a market capitalization larger than $1 billion and create a long portfolio of the top 10% of stocks with the highest CROIC and a short portfolio of the bottom 10% of stocks with the lowest CROIC. The long-short portfolio is rebalanced monthly and constructed beta-neutral. Each transaction incurs costs of 10 basis points.
It is worth noting that we are using a simplified version of the CROIC methodology. More sophisticated approaches apply multiple adjustments to the financial data, e.g. the equity can be adjusted for inflation and off-balance sheet items like leases can be included in the calculation of invested capital. Additional refinements are implemented for unique sectors like real estate.
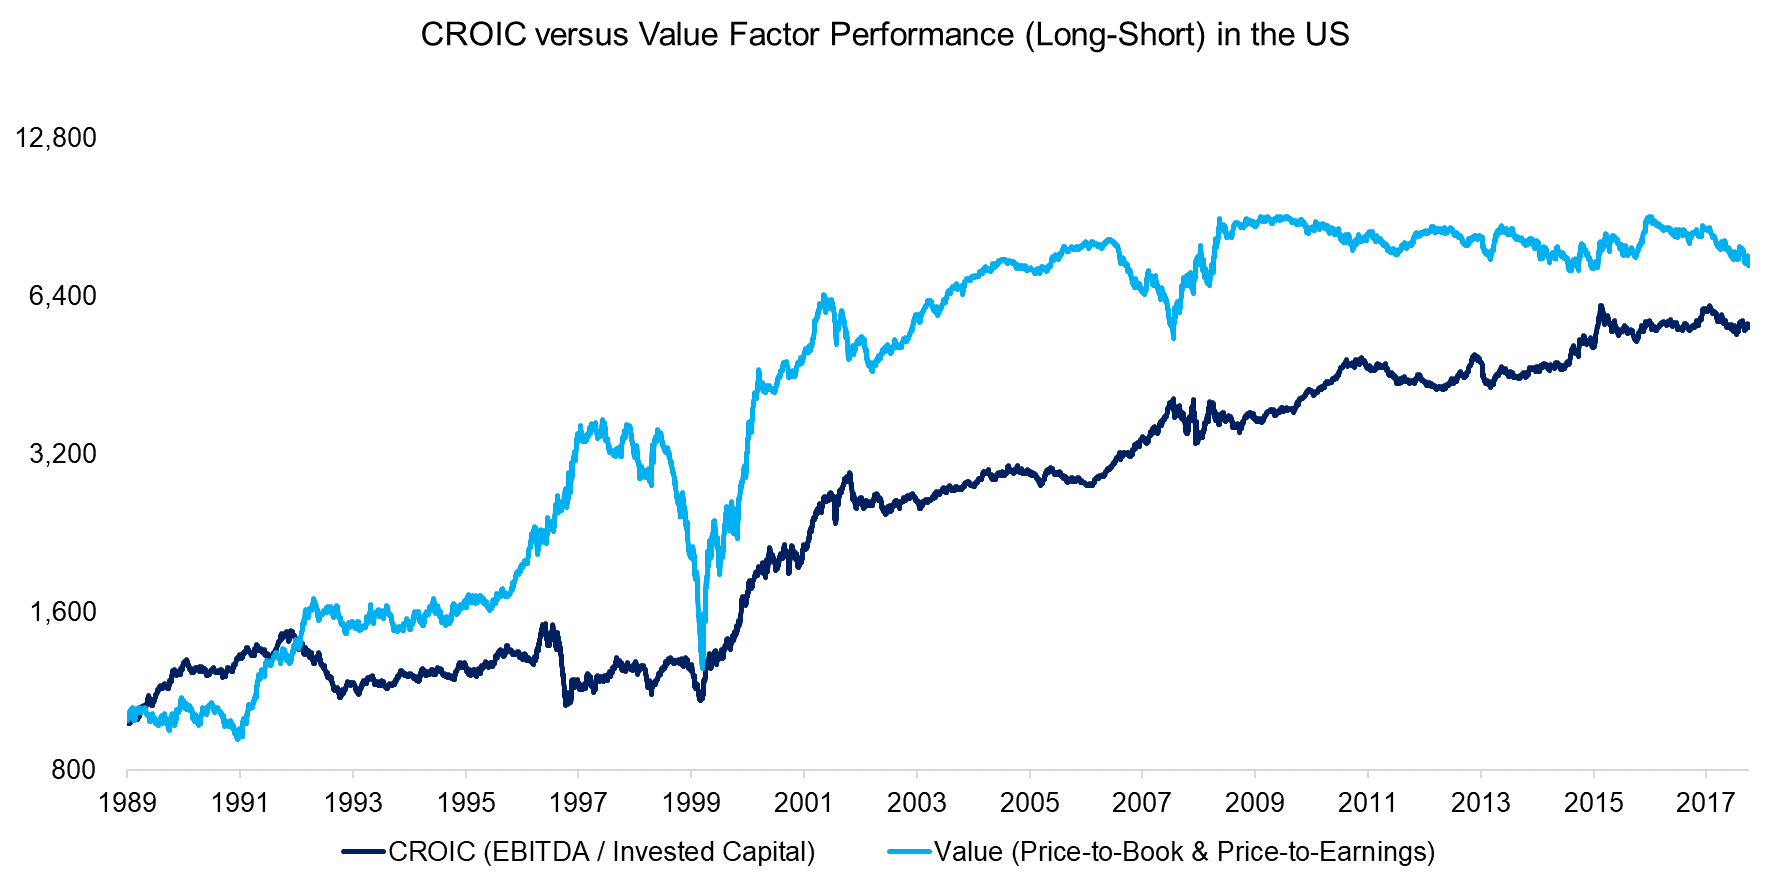
We compare the performance of the CROIC factor to Value, where stocks are selected on a traditional combination of price-to-book and price-to-earnings ratios. We observe approximately the same trends in performance in the period between 1989 and 2018. The key differences were a lower maximum drawdown of CROIC during the tech bubble in 1999 and consistently positive returns post the global financial crisis in 2009.
Given that most traditional Value investors are severely worn down after a decade of consistently losing money, these results are likely intriguing and worth a deeper look (read Mapping My Mind: Value Factor).
Source: FactorResearch
ANALYZING CROIC STOCKS
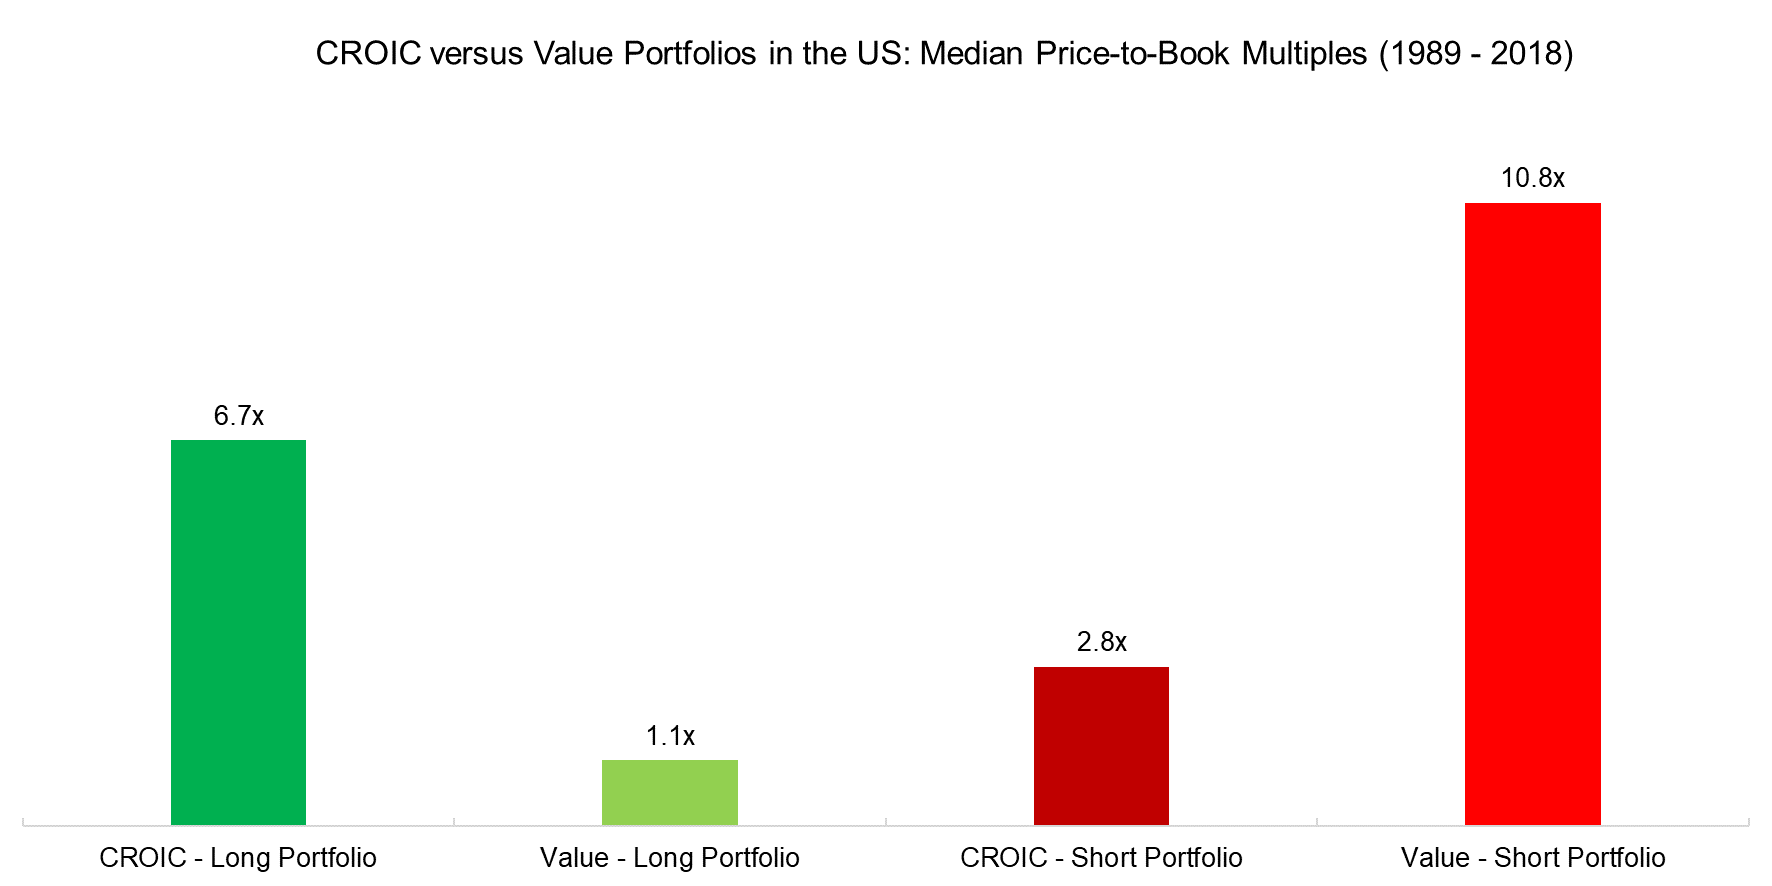
Given the 100,000 foot view shows similar performance between the CROIC and Value factors, it is worth comparing the portfolios. We contrast the long and short portfolios of both factors by measuring the median price-to-book values. Our goal is to ensure that we are buying cheap stocks in both cases and sticking to a Value investment philosophy, i.e., buy cheap, sell expensive.
Surprisingly, the long portfolio of the CROIC factor was almost twice as expensive as the short portfolio on average, in contrast to the Value factor, where the long portfolio was much cheaper than the short portfolio, per definition. It is not unusual for some stocks to appear cheap on one and expensive on another metric, e.g. on price-to-book versus price-to-earnings, however, on average the direction of being cheap or expensive on portfolio level usually aligns. A structural divergence as in this case is rather unique and requires further investigation.
Source: FactorResearch
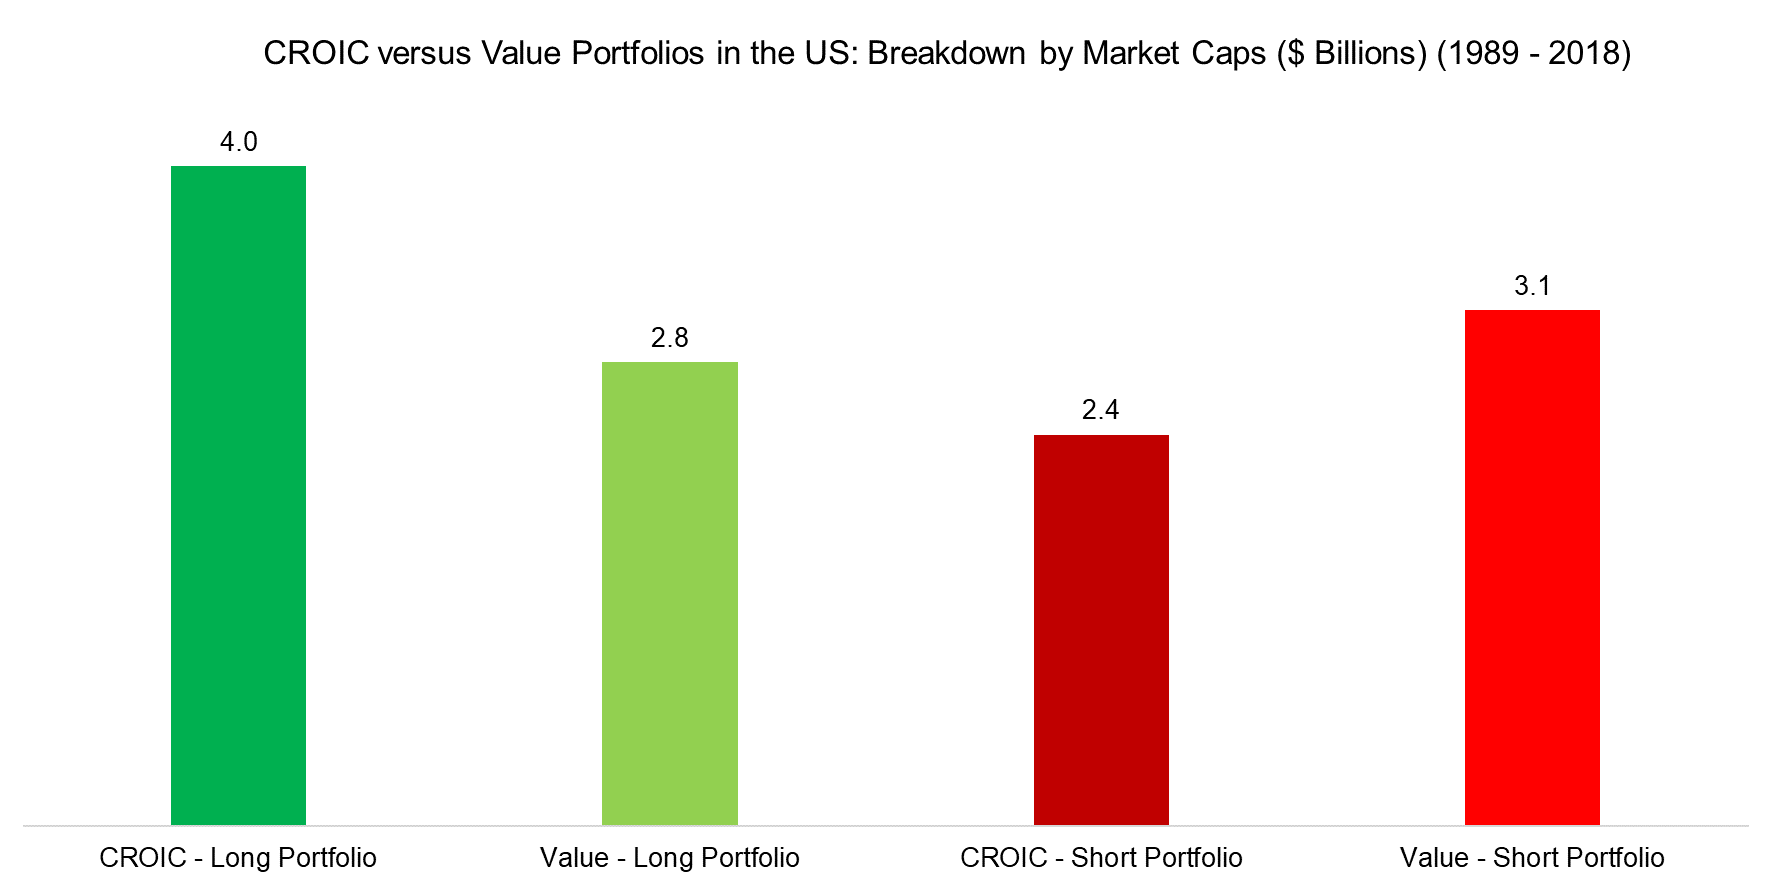
We continue our journey of analyzing CROIC stocks and compare the average market capitalizations of the long and short portfolios. Cheap stocks tend to be small caps, but in the case of the CROIC factor, this was the inverse as the long portfolio was comprised of stocks with larger market capitalizations on average. Again, CROIC stocks do not seem very “Valuely”.
Source: FactorResearch
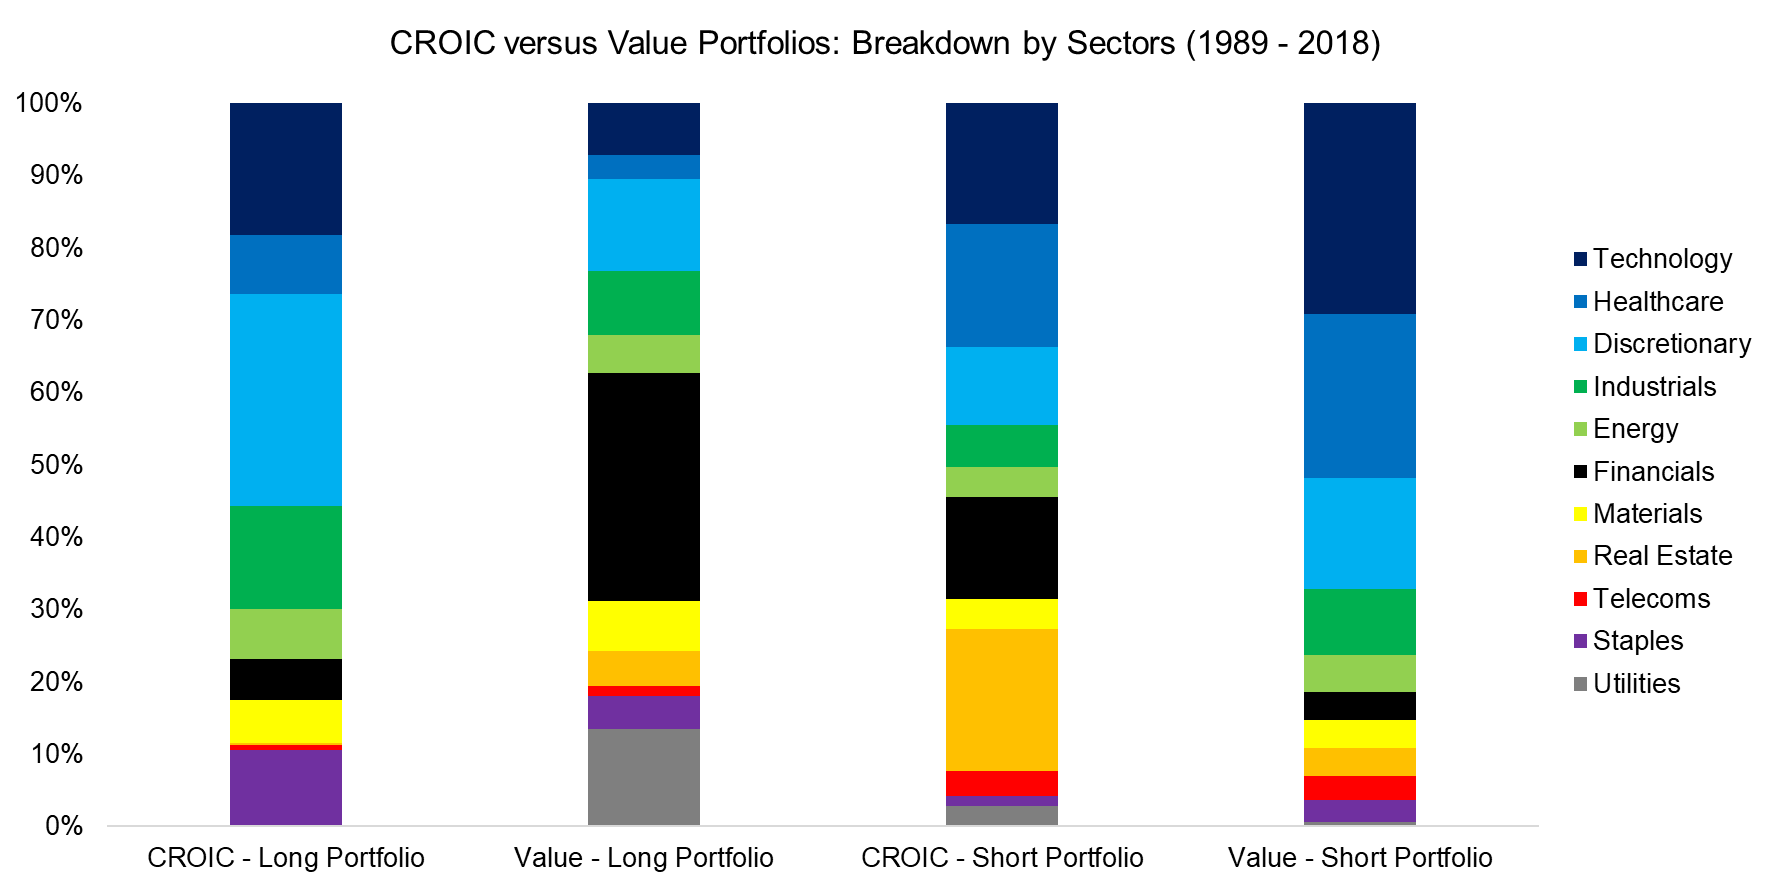
Finally, we provide a breakdown by sectors, which highlights some similarities and some differences between the CROIC and Value factors. The following observation:
- Long portfolio of CROIC: Long technology, discretionary, and industrials (61% contribution to the portfolio)
- Long portfolio of Value: Long discretionary, financials, and utilities (58%)
- Short portfolio of CROIC: Short technology, healthcare, and real estate (54%)
- Short portfolio of Value: Short technology, healthcare, and discretionary (67%)
Source: FactorResearch
Some of these sector biases can be explained by the stock selection process, e.g. CROIC uses EBITDA, which is not a useful metric for evaluating financial companies given that interest income constitutes a large part of their revenues.
The poor performance of Value in the period between 2009 and 2018 can be attributed to being long financial and short technology stocks. An investor skeptical of CROIC might argue that the attractive performance over the last decade is simply explained by lucky sector bets and not from using a metric that is superior for evaluating the economics of a business.
IS CROIC A VALUE OR QUALITY METRIC?
The same skeptical investor might question the difference between CROIC and EBITDA / EV. As per our definitions, the only difference is in the denominator, where enterprise value (EV) is calculated as the sum of market capitalization and debt. Furthermore, isn’t CROIC related to return-on-equity, where the latter is rather a measure of the quality of a business rather than its valuation?
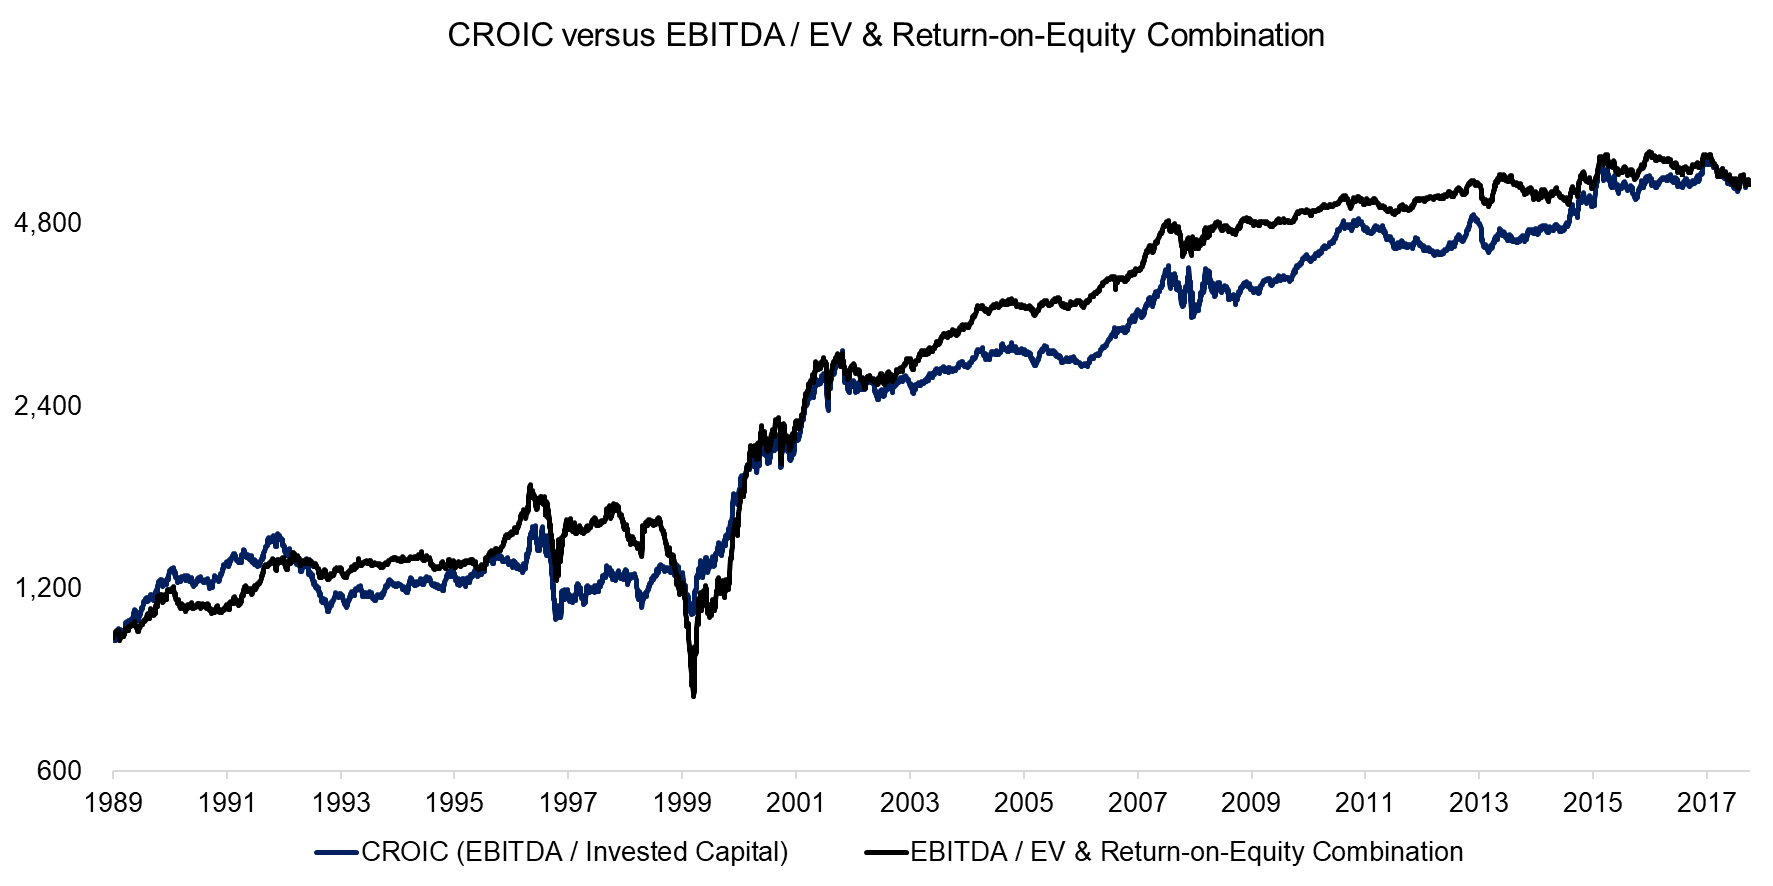
Given these questions, we create a simple equal-weighted combination between EBITDA / EV and return-on-equity. This measure turns out to replicate the performance of CROIC closely over the last 30 years. It seems that CROIC represents a combination of existing factors (ROE and EBITDA / EV) rather than a separate, differentiated single-factor.
Source: FactorResearch
FURTHER THOUGHTS
Running a Value fund is somewhat like being stranded on a tiny tropical island out in the ocean. You can’t really run away and are exposed to the harsh forces of nature. If you’re lucky, there might be a coconut tree or big rock providing some shade. But it will still be hot most of the day, regardless of where you’re sitting, and often you have to watch out for falling coconuts.
Searching for better metrics for Value is a perpetual research exercise for asset managers, despite accounting standards having moved only at glacial speed over the last few decades. Some metrics might be more appropriate for measuring the intrinsic value of a business in the current age where book values have become less meaningful for sectors like technology. However, it seems the trend in the performance of the Value factor is the same, regardless of the chosen metric.
RELATED RESEARCH
ABOUT THE AUTHOR
Nicolas Rabener is the CEO & Founder of Finominal, which empowers professional investors with data, technology, and research insights to improve their investment outcomes. Previously he created Jackdaw Capital, an award-winning quantitative hedge fund. Before that Nicolas worked at GIC and Citigroup in London and New York. Nicolas holds a Master of Finance from HHL Leipzig Graduate School of Management, is a CAIA charter holder, and enjoys endurance sports (Ironman & 100km Ultramarathon).
Connect with me on LinkedIn or X.

