Momentum Factor: Intra vs Cross-Sector
May the Force Be with You…
June 2017. Reading Time: 10 Minutes. Author: Nicolas Rabener.
SUMMARY
- Intra vs cross-sector Momentum factor profiles look remarkable similar
- Momentum is like a force that permeates sectors and countries
- Sector analysts need to pay attention to cross-sector Momentum
INTRODUCTION
Gravity is one of the fundamental laws of nature and every planet is affected by it, although the force of gravity might be quite different depending on the mass of the planet. We believe that factors are comparable to gravity in the sense that charts and metrics might look slightly different depending on how the factor is defined and what assumptions are used, but you can’t escape gravity and the trend will look similar. In this short research note we will analyse the Momentum factor and see how different the profiles look when the factor is calculated intra versus cross-sector.
METHODOLOGY
We use the standard academic definition for the Momentum factor of taking the 12-month return excluding the last month and go long winning and short losing stocks. We take the top and bottom 30% of the sectors and stock universes and calculate factor performance beta-neutral (read Factor Construction: Beta vs $-Neutrality). Stocks require a minimum market capitalization of $1bn and 10bps of transaction costs are included. Data is available for all developed markets, but only meaningful for the US given sufficient number of stocks in each sector to make the analysis statistically significant.
US MOMENTUM FACTOR PERFORMANCE (2000 – 2017)
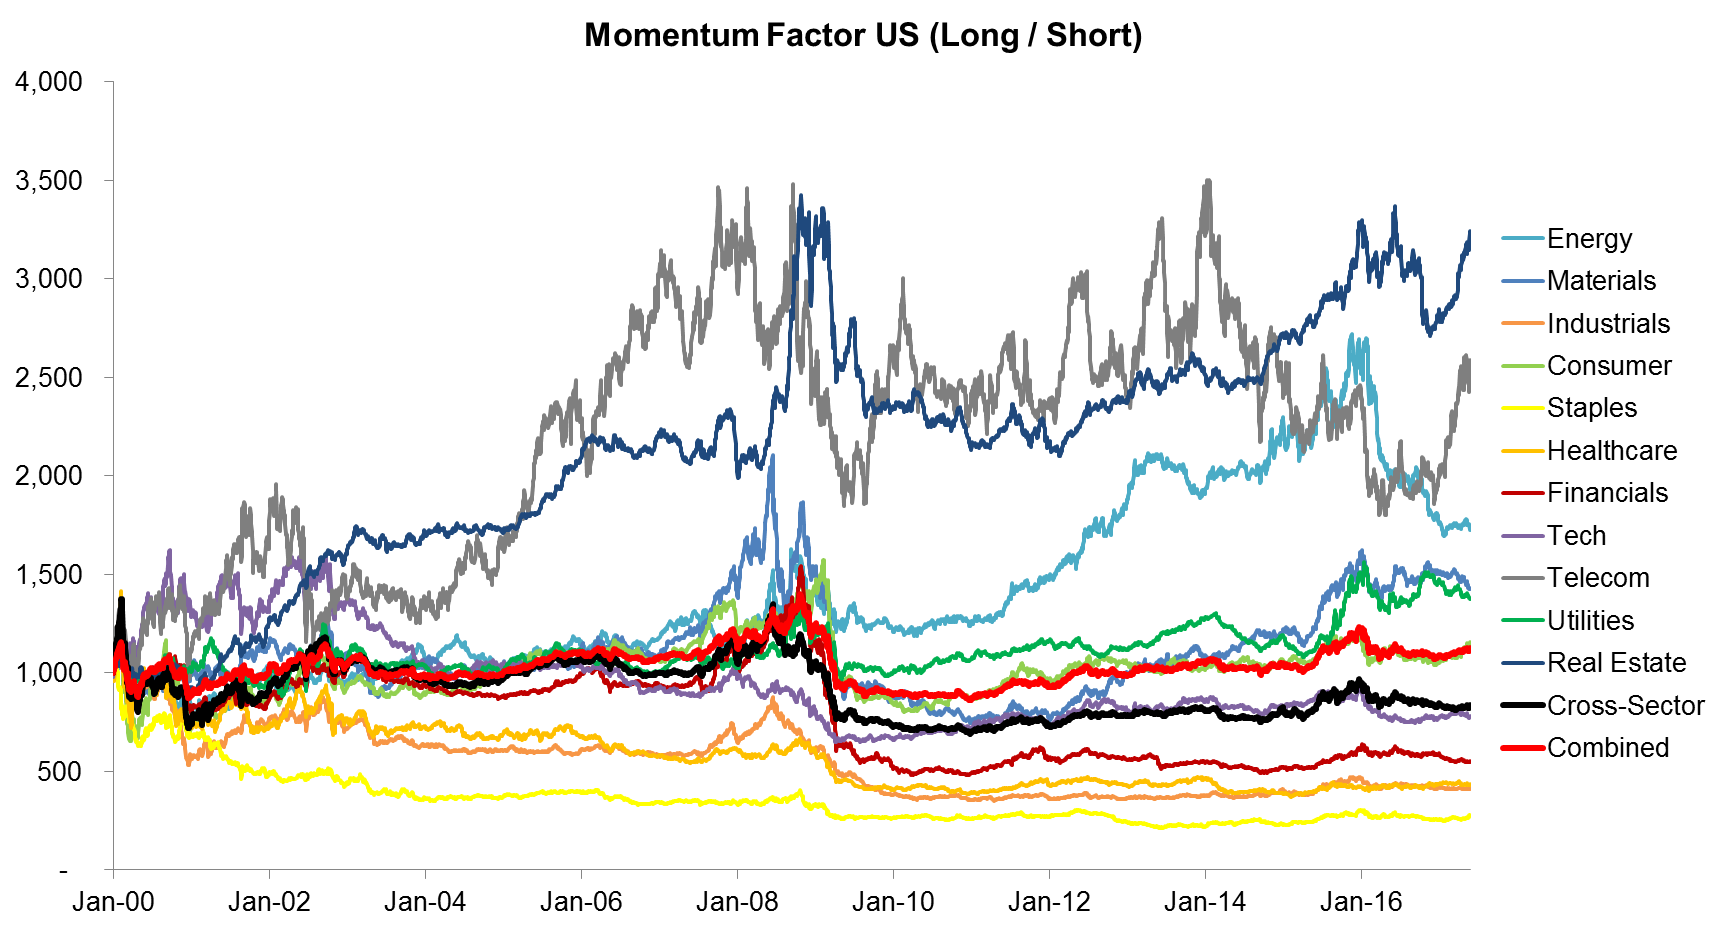
The chart below shows the performance of the Momentum factor (long / short) in the US for 11 sectors, cross-sector, and a combined profile, which is the simple average of the 11 sector profiles. We observe quite a range of outcomes in terms of profitability and some similarities, e.g. all seem to have experienced a crash in 2009.

Source: FactorResearch
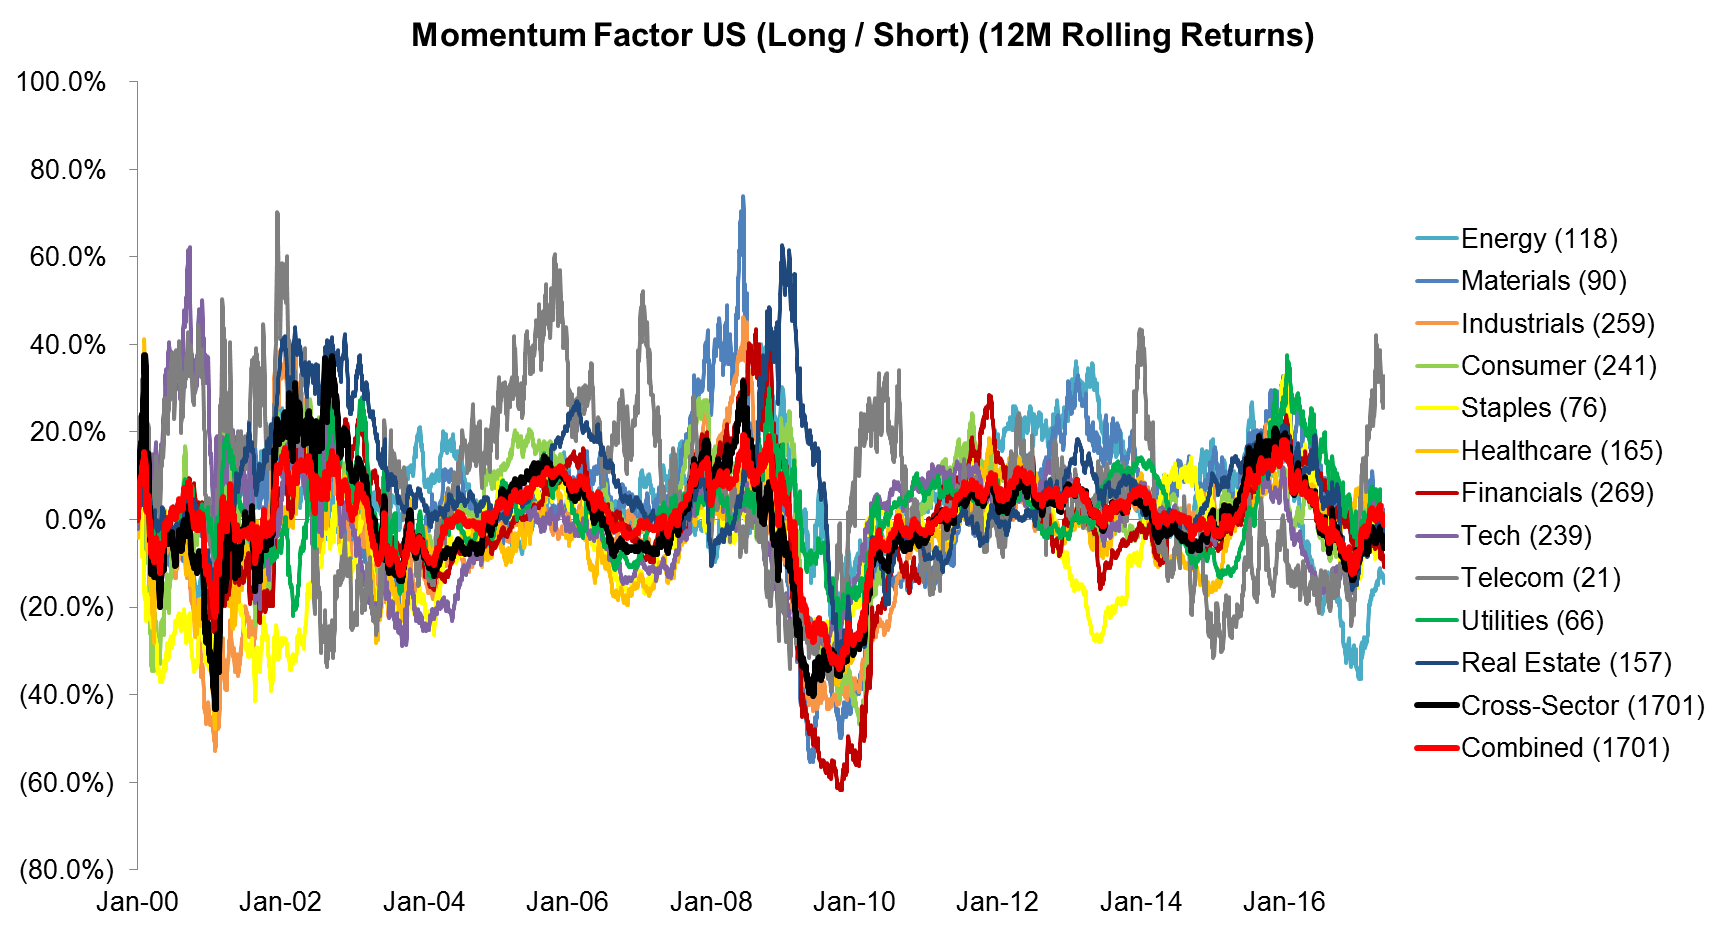
We can change the chart to show the rolling 12-month returns in order to get a better sense of the similarity of the profiles. Some trends can be observed more clearly, but overall it’s still a complex chart. Some sector profiles, e.g. Telecom, seem to trade quite differently to the rest of the sectors. However, this is likely simply a reflection of a much more limited stock universe, which is highlighted by the numbers in brackets behind the sector names, e.g. the Telecom sector only had 21 stocks at the end of analysis, which dilutes the force of the factor as single stocks then have a much larger impact.

Source: FactorResearch
We can mitigate the single stock risk by excluding any sector that had less than 100 stocks at the end of 2016, but still must treat the sector profiles with caution as there might have been very few stocks at the beginning of the analysis. The chart below shows quite clearly that sectoral Momentum roughly mirrors cross-sector Momentum.
Source: FactorResearch
It’s quite interesting that sectoral Momentum is so similar to cross-sector Momentum as the later often takes significant sector bets, which seem to be replicated on sector level. As an example: cross-sector Momentum in the US was significantly short the Energy sector at the end of 2015 as the oil price had declined significantly throughout the year, and this Energy short was replicated indirectly in other sectors, e.g. in the short portfolio of the Real Estate sector via real estate stocks that had similar characteristics to the Energy shorts. For a Real Estate sector stock analyst this relationship might not be so clear as drawing similarities between Energy and Real Estate stocks is not obvious.
Momentum therefore seems much like a force that permeates across sectors and to a degree also across countries, e.g. nearly all Momentum profiles across developed markets had significant drawdowns in spring 2009 as the sentiment changed and equity markets started recovering from the Global Financial Crisis.
US MOMENTUM FACTOR METRICS (2000 – 2017)
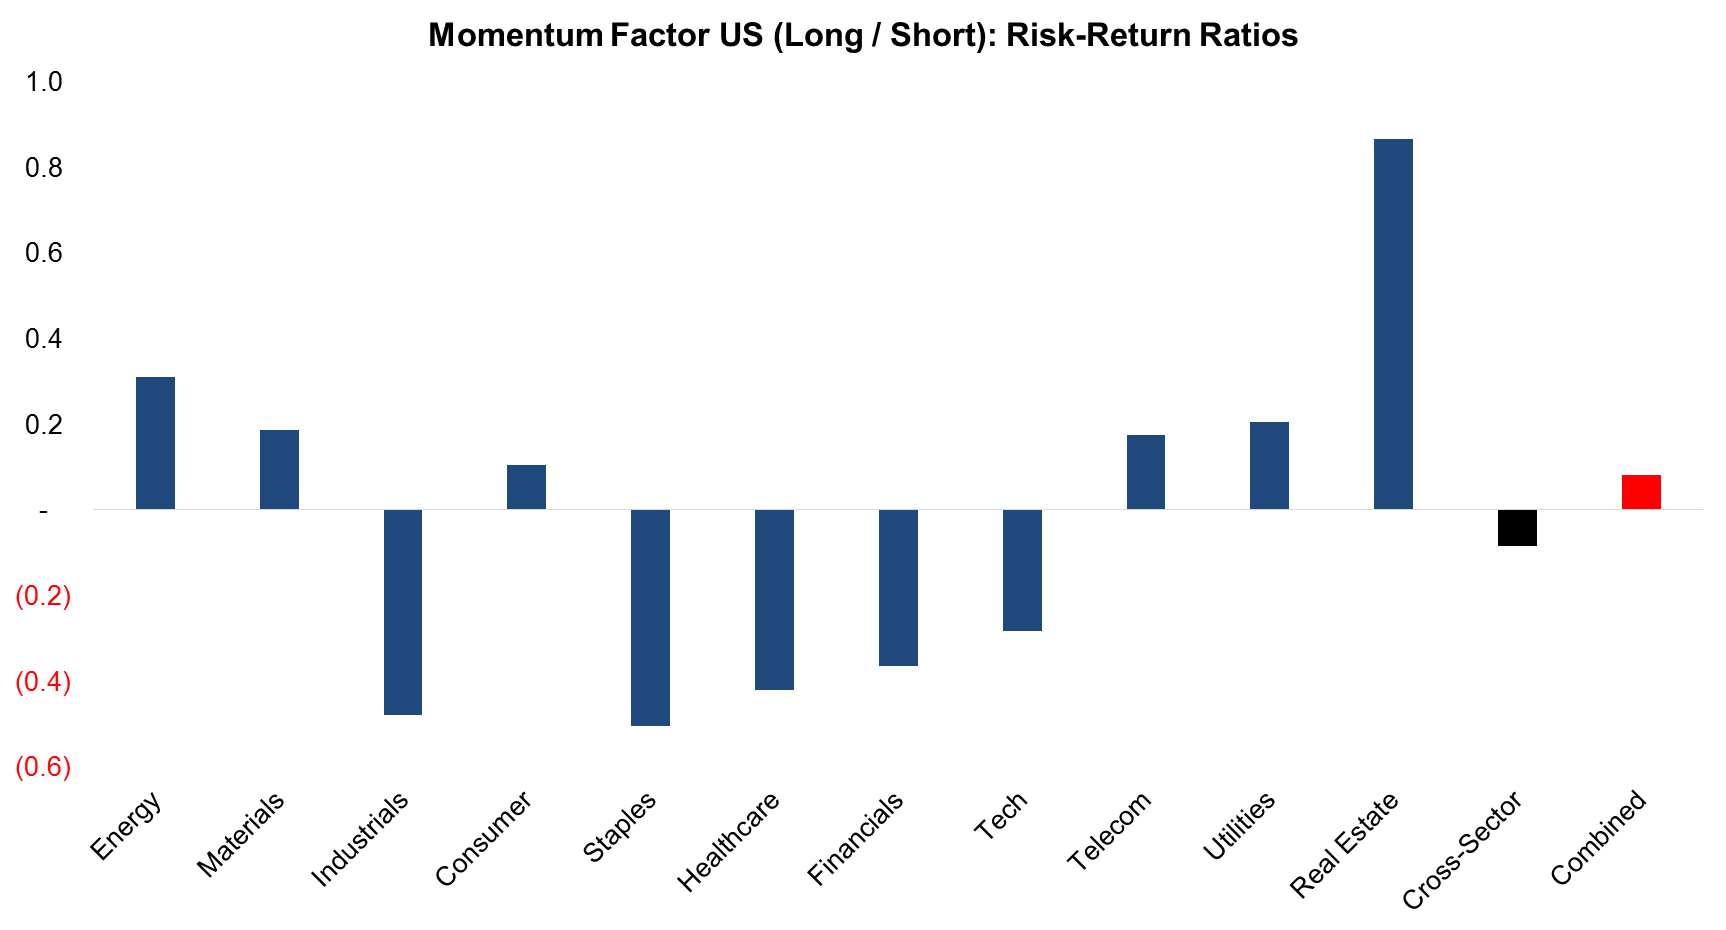
Intuitively sector Momentum should show better risk metrics than cross-sector Momentum as the bets are likely to be less extreme given narrower universes. However, the chart below shows that the average risk-return ratio for sectoral Momentum was not higher than for cross-sector Momentum in the period from 2000 to 2017.

Source: FactorResearch
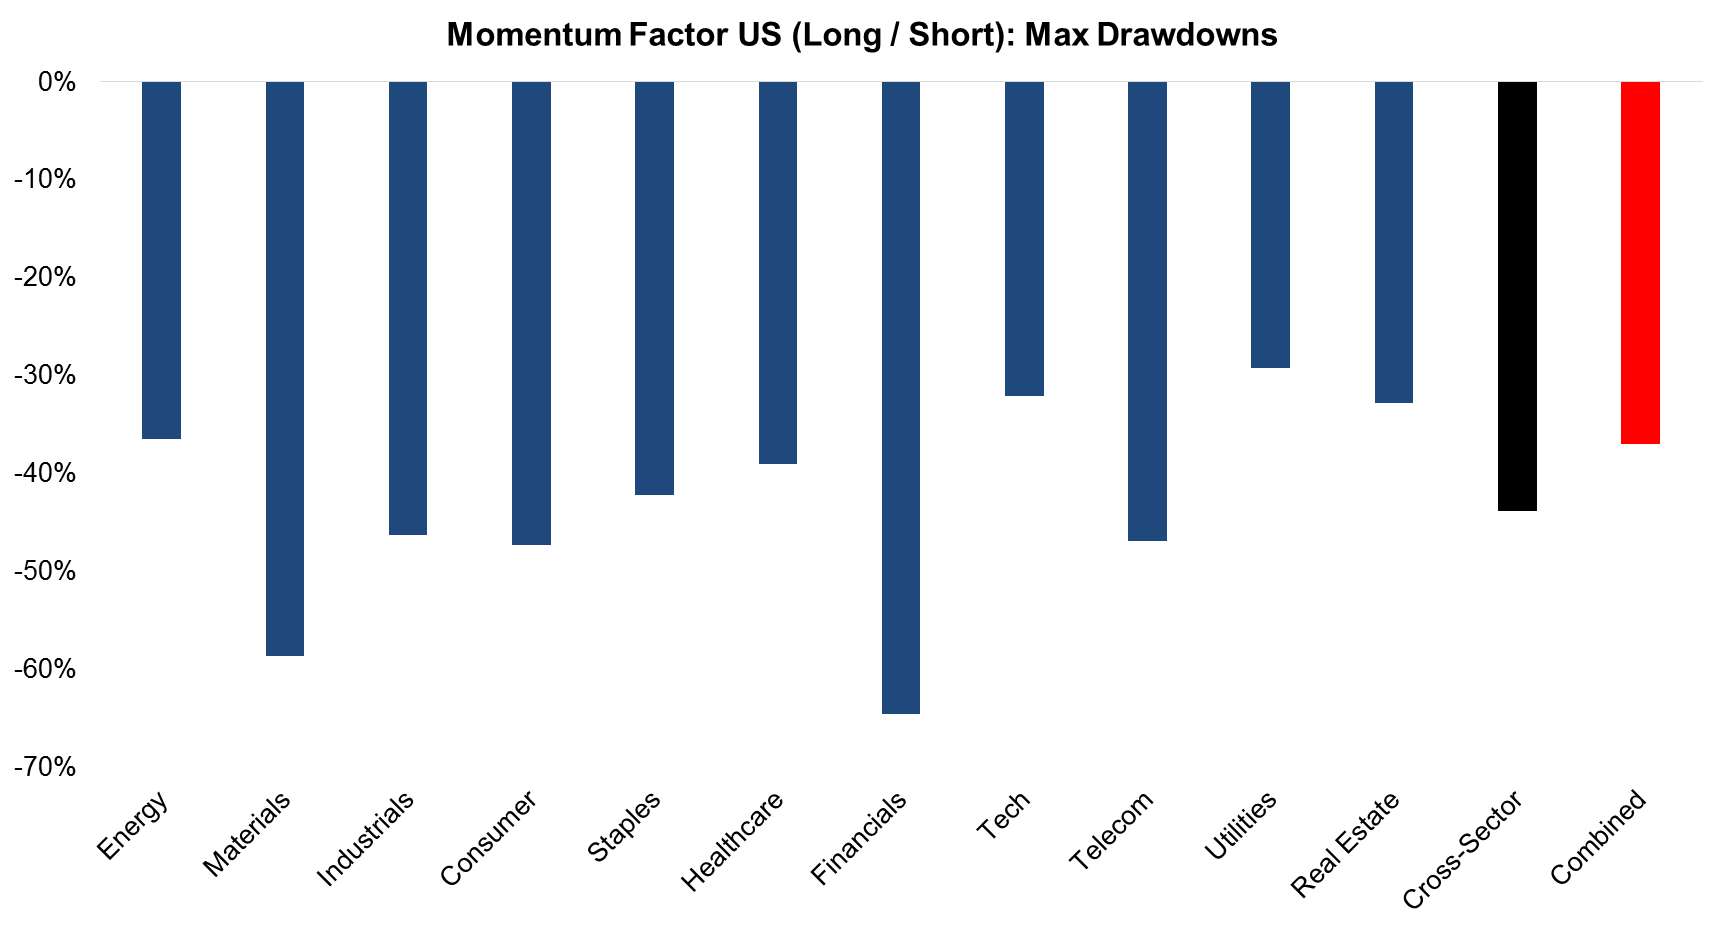
It’s also worth showing the max drawdowns, where we can see most sectoral Momentum drawdowns are comparable to the cross-sector one. The drawdown for the combined profile is slightly lower, highlighting the diversification benefits of combining multiple sectoral Momentum profiles.

Source: FactorResearch
FURTHER THOUGHTS
Given that Momentum seems like a force that permeates sectors, it’s worth questioning if investors should replicate Momentum strategies on sector level at all. The implication for sector analysts is that they need to pay attention to cross-sector Momentum as they are not operating in zero-gee.
ABOUT THE AUTHOR
Nicolas Rabener is the CEO & Founder of Finominal, which empowers professional investors with data, technology, and research insights to improve their investment outcomes. Previously he created Jackdaw Capital, an award-winning quantitative hedge fund. Before that Nicolas worked at GIC and Citigroup in London and New York. Nicolas holds a Master of Finance from HHL Leipzig Graduate School of Management, is a CAIA charter holder, and enjoys endurance sports (Ironman & 100km Ultramarathon).
Connect with me on LinkedIn or X.

