Quality Factor: How To Define It?
Same, Same, but Different?
July 2017. Reading Time: 10 Minutes. Author: Nicolas Rabener.
SUMMARY
- Different Quality definitions result in dramatically different return profiles
- Questionable if there is structural alpha in the Quality factor
- Investors would not have benefited significantly from exposure to Quality in the GFC
INTRODUCTION
The Greeks said that beauty is in the eye of the beholder, investors might say the same the Quality factor. It’s likely the factor where opinions are most diverse regarding the definition. Broadly speaking there are qualitative and quantitative evaluations and these are often combined in a scoring model. Criteria like management quality or the soundness of strategy are intuitively appealing, but difficult to verify given a lack of data. In this short research note we will analyse three quantitative criteria, which are commonly used when used in defining the Quality factor, and compare their return profiles (read Value & Quality Factor Valuations) .
METHODOLOGY
We will focus on three metrics: the debt-to-equity ratio, return-on-equity, and gross margins, which are chosen as they are available for all companies and therefore maximise the number of available stocks. We construct long and short portfolios in the US, Europe, and Japan based on the top and bottom 10% of the stock universes ranked by the quality metrics. The portfolios are created dollar-neutral and only feature companies with market capitalizations above $1bn.
THE QUALITY FACTORS ACROSS REGIONS
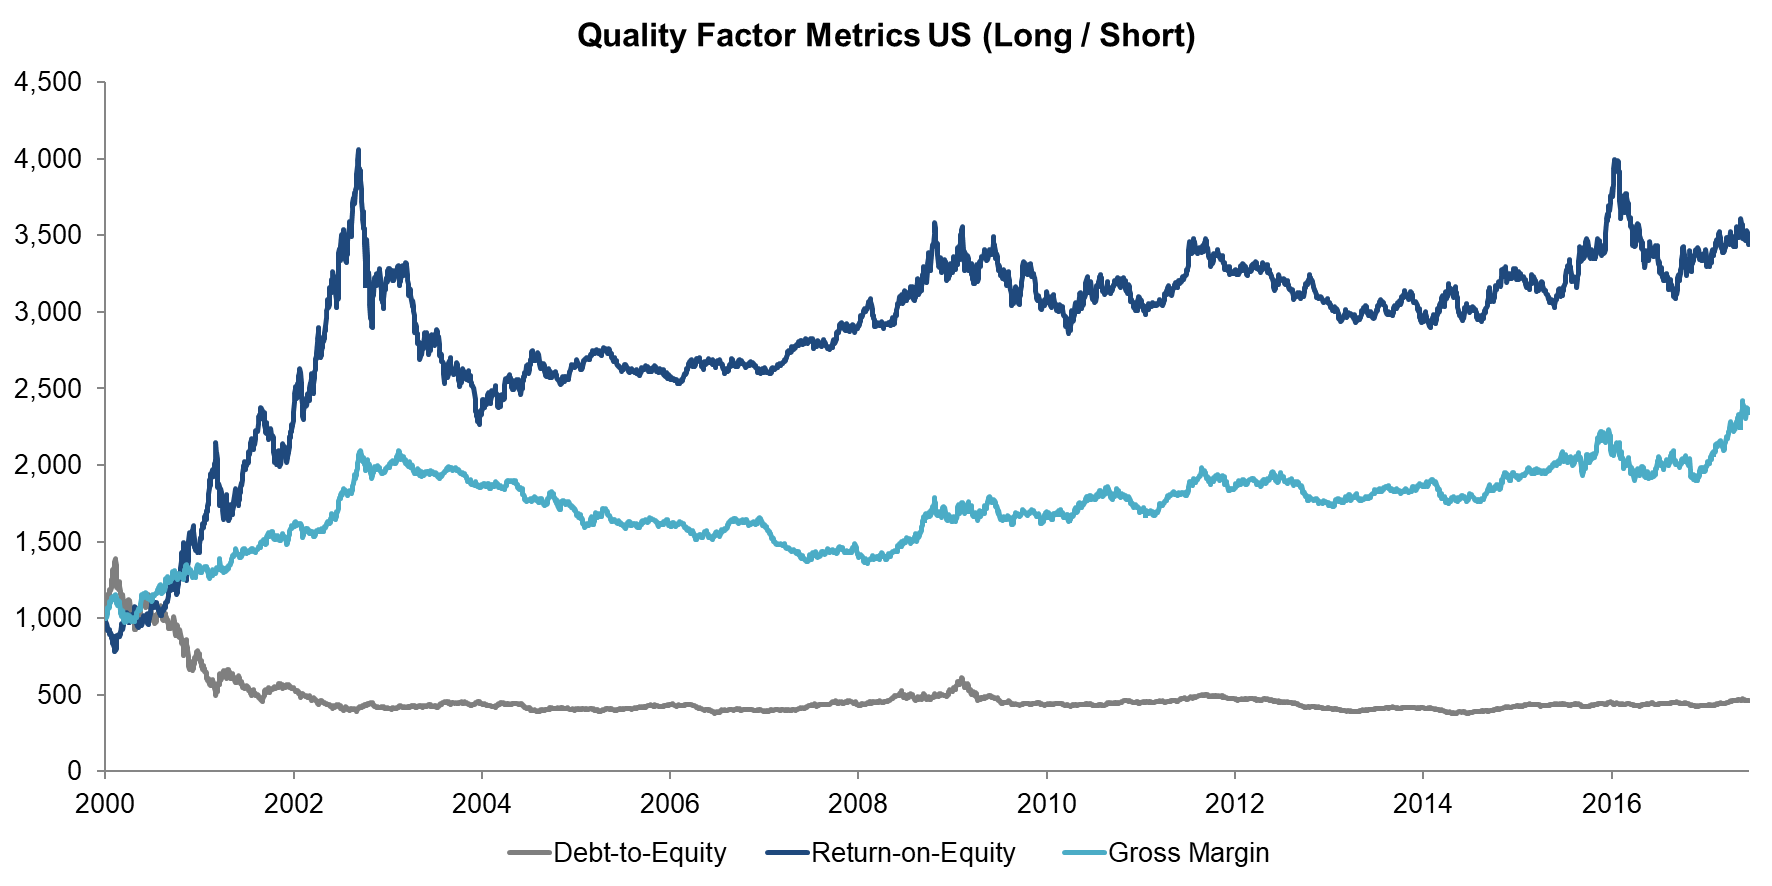
The chart below shows the performance of the three Quality metrics in the US from 2000 to 2017. The different Quality factors are mostly flat throughout the period, except for the early years. The debt-to-equity Quality factor lost approximately 50% of its value between 2000 and 2002, which can be explained by having debt-free Tech companies in the long portfolio during the Tech bubble implosion. The return-on-equity Quality factor shows the opposite as profitless Tech companies were in the short portfolio. We can observe that different metrics lead to quite different results.
Source: FactorResearch
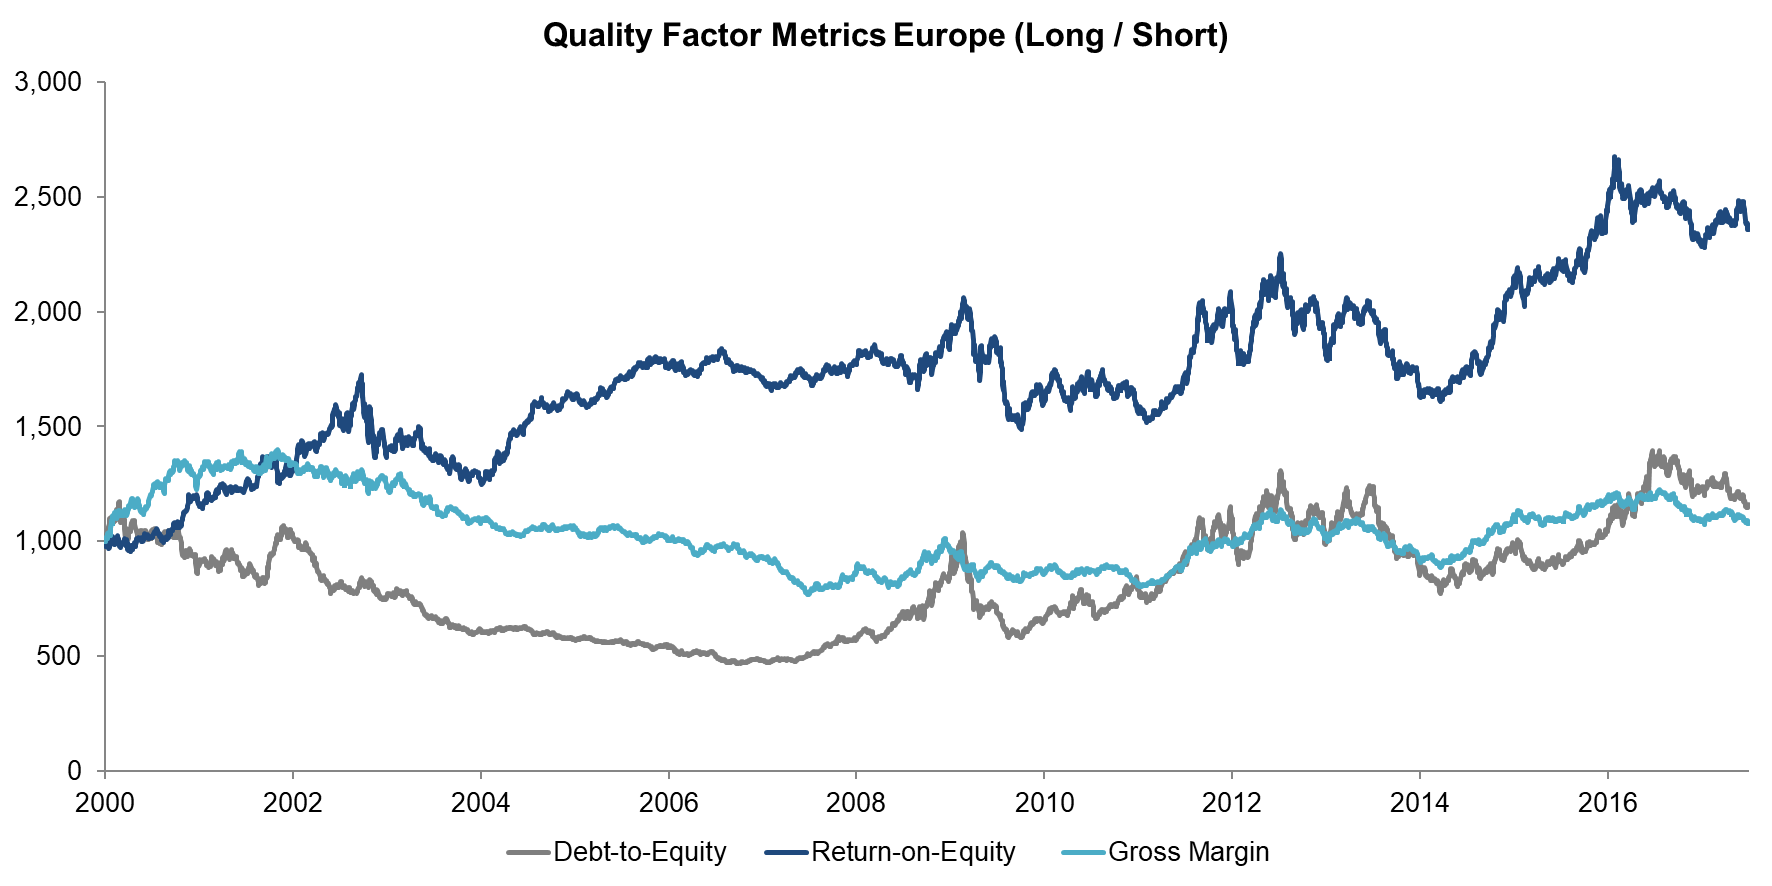
The next chart shows the performance of the Quality factors in Europe, which has some similarities and some differences to the US. The key difference is that all three Quality factors have generated positive returns since the Global Financial Crisis (“GFC”), which likely mirrors the European debt crises and general investor concerns with the region.
Source: FactorResearch
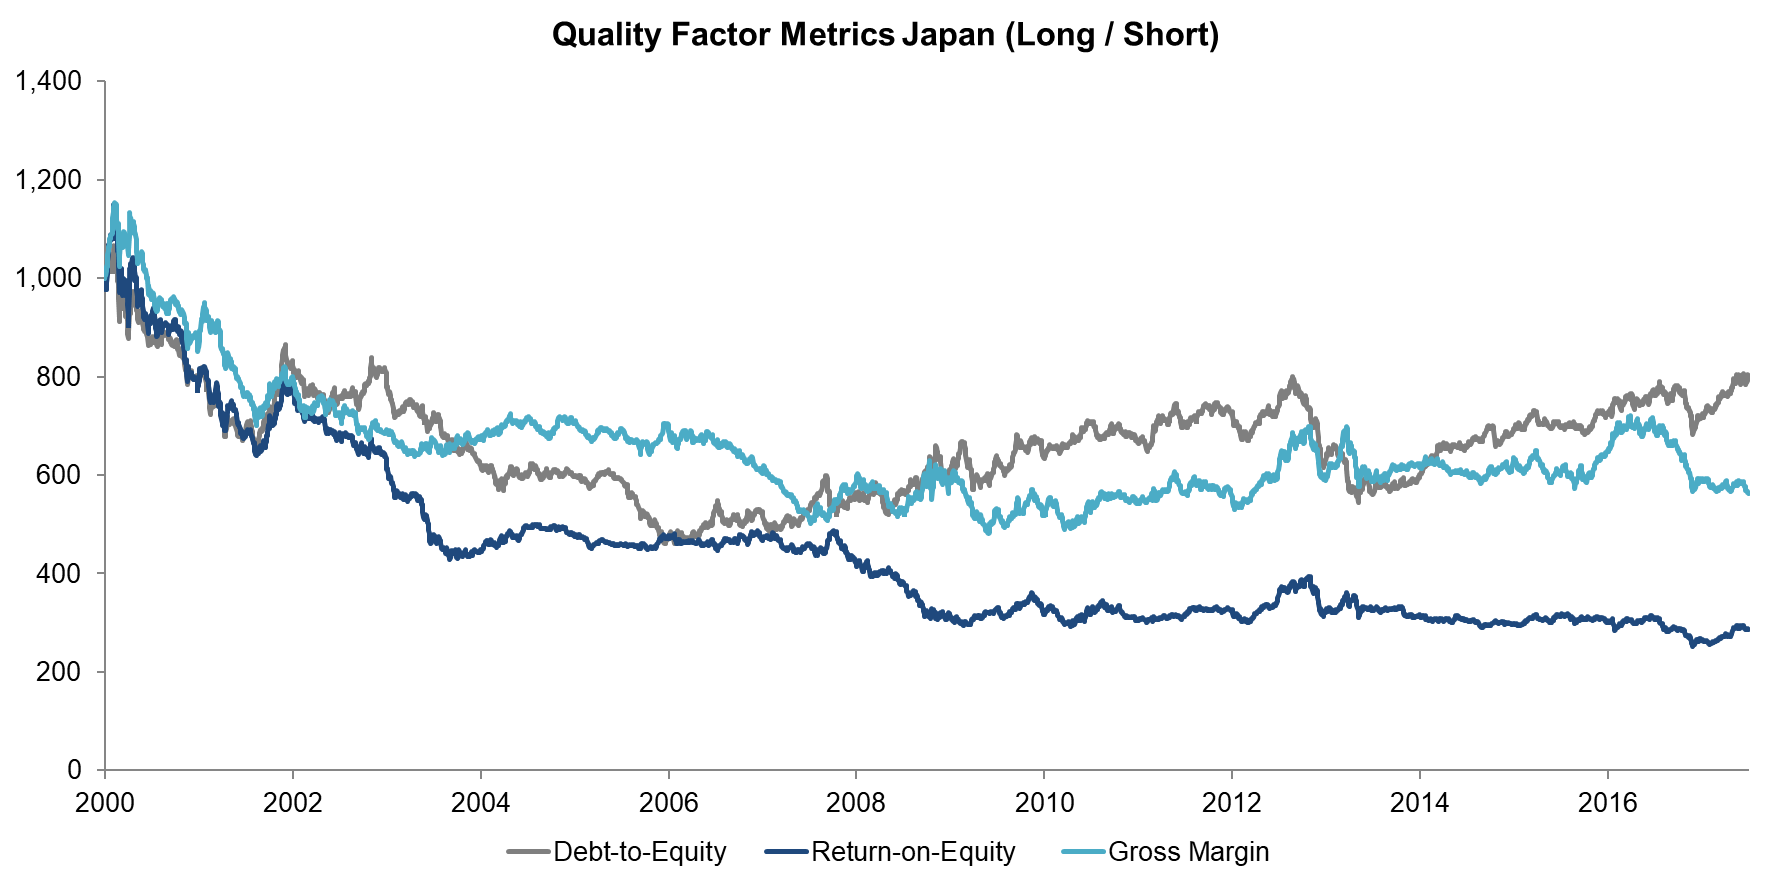
The performance of all Quality factors in Japan has been negative since 2000. Return-on-equity is consistently negative, which might be explained by too much money chasing highly profitable companies, therefore making their valuations unsustainable. Given that Japan had zero interest rates for more than two decades, balance sheet metrics like debt-to-equity should be less meaningful than in other countries.
Source: FactorResearch
TRENDS IN THE QUALITY FACTORS
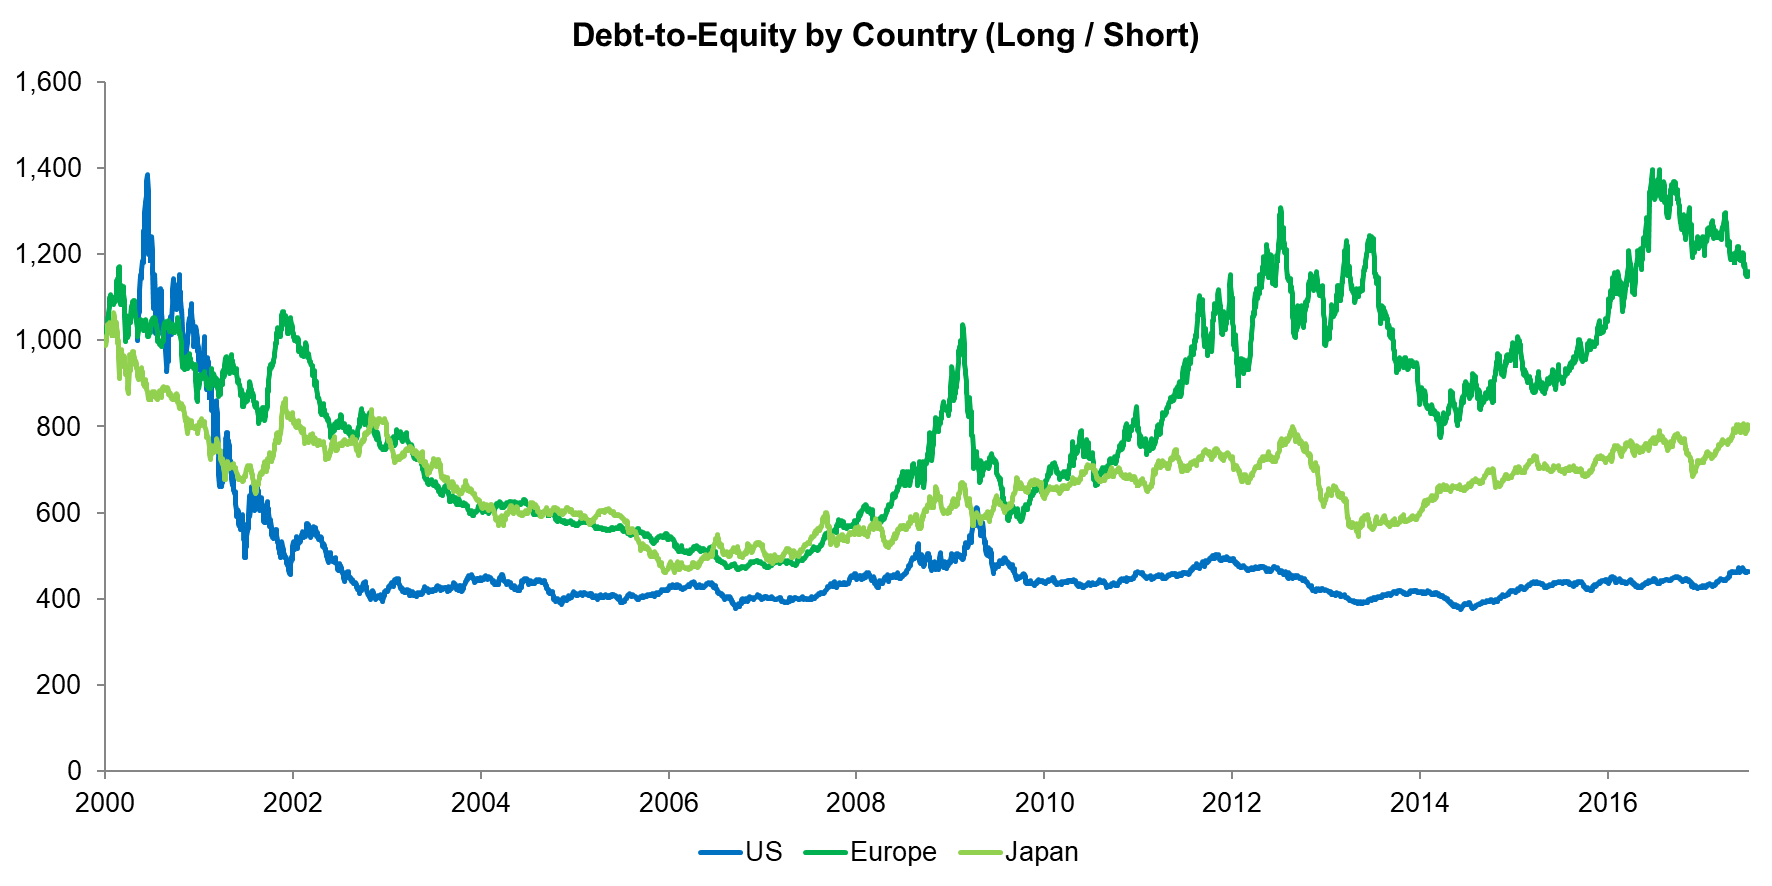
So far the analysis concentrated on observing the three different metrics in each of the regions. It’s also interesting to see if there are trends across regions as it would indicate global market forces that drive factor performance. The chart below shows the debt-to-equity Quality factor across regions and indeed there are similarities. In all three regions the factor lost about 50% of its value until the GFC, which partially can be explained by the Tech bubble implosion. It’s worth highlighting that the factor generated positive returns going into the GFC, but the returns are rather low for the US and Japan and only meaningful for Europe. If investors could have anticipated the GFC, then this Quality definition would not have protected their portfolios significantly.
Source: FactorResearch
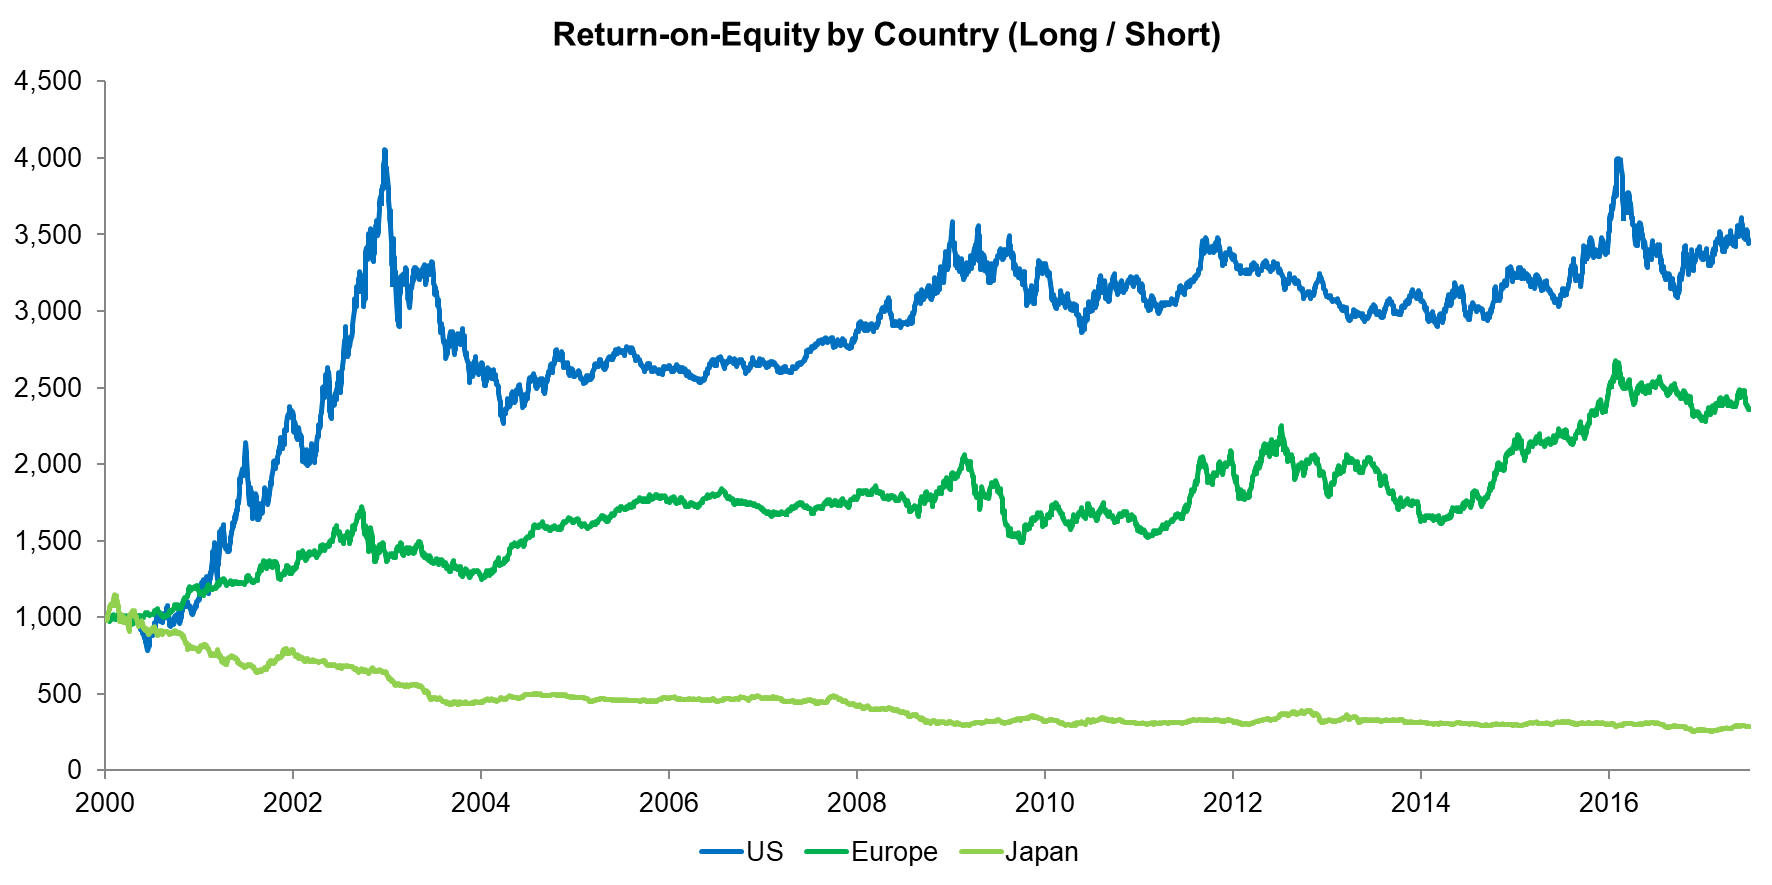
The next chart shows the performance of the return-on-equity Quality factor, which in the early years of the analysis shows strongly positive returns, i.e. the opposite of the debt-to-equity factor and is also explained by the Tech bubble. However, this Quality definition also didn’t generate attractive returns during the GFC, which is somewhat perplexing as we would have expected investors to prefer highly profitable companies during crisis time.
Source: FactorResearch
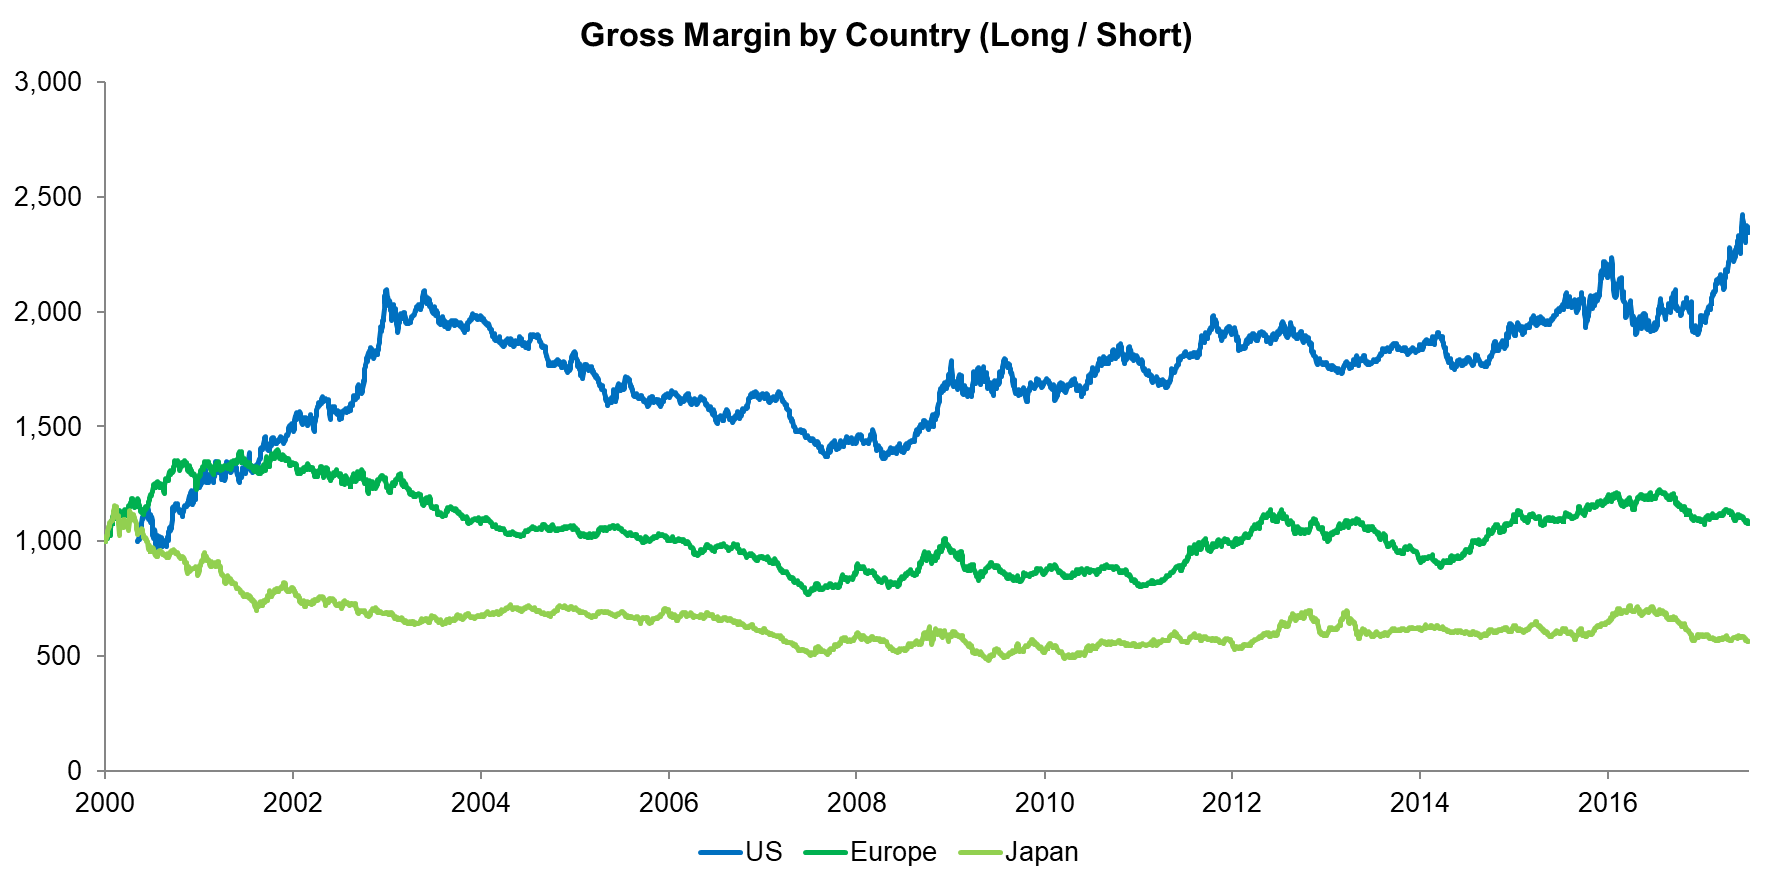
The final chart shows the performance of the profit margin Quality factor, which shows the flattest profiles of all three Quality metrics. We can observe that companies with higher profit margins don’t seem to outperform consistently. It’s worth highlighting again that the factor performance during the GFC is somewhat muted. As a comparison, the Value factor, which can be regarded as the opposite of the Quality factor to a degree, lost over 50% heading into the GFC.
Source: FactorResearch
FURTHER THOUGHTS
This short research note shows that the different definitions of the Quality factor result in dramatically different return profiles. Interestingly none of these seems to generate consistent positive returns over time or would have helped significantly as a hedge during the GFC.
We do need to highlight that the portfolios were constructed dollar and not-beta neutral. The Quality factors exhibit a net negative beta over time, which means rising markets dampened their return profiles, and beta-neutral portfolios might show structural alpha. We will cover this in a subsequent note.
ABOUT THE AUTHOR
Nicolas Rabener is the CEO & Founder of Finominal, which empowers professional investors with data, technology, and research insights to improve their investment outcomes. Previously he created Jackdaw Capital, an award-winning quantitative hedge fund. Before that Nicolas worked at GIC and Citigroup in London and New York. Nicolas holds a Master of Finance from HHL Leipzig Graduate School of Management, is a CAIA charter holder, and enjoys endurance sports (Ironman & 100km Ultramarathon).
Connect with me on LinkedIn or X.

