Portfolio Allocations vs Risk Contributions
What’s driving my portfolio?
April 2023. Reading Time: 10 Minutes. Author: Nicolas Rabener.
SUMMARY
- Most investors analyze investment products based on their holdings
- However, holdings often misportray of what is determining the risk profile
- A factor exposure analysis can identify the performance & risk contributors
INTRODUCTION
It is difficult to watch an hour of European television and not see an advertisement from the Italian confectionary company Ferrero. The ads for Kinder Schokolade feature large glasses of milk, the ones for Nutella buckets of hazelnuts, and for Mon Cheri farmers harvesting cherries. Essentially, these brands are trying to suggest there are health benefits when consuming their products. However, a nutritional analysis would highlight that 100g of Kinder Schokolade contains 53g of sugar, which despite being delicious, is anything but healthy.
There are plenty of products in the investment world that are similarly misleading. Private equity, venture capital, and real estate are all marketed as providing uncorrelated returns to stock markets, but these “alternative” asset classes provide nothing but exposure to the economy, ie the same risk exposure as the S&P 500 (read Private Equity: Fooling Some People All the Time?). If the economy enters a recession, then private as well as public company valuations decline.
However, even a traditional equity / bond (60/40) portfolio can be misleading as the holdings do not provide a meaningful perspective of what is driving its performance and risk profile.
In this research article, we will contrast portfolio allocations versus risk contributions.
ANALYZING A 60/40 PORTFOLIO
First, we run a simple factor exposure analysis on the BlackRock 60/40 Target Allocation Fund (BIGPX) using returns from the last 12 months. The name of the fund is misleading as it does not just provide exposure to US equity and bond markets, but also to international and emerging market stocks. Some of the positions are unusual as they practically provide opposite factor exposures, eg the fund holds a European value and a European growth ETF (read Growth ETFs: Performance & Factor Exposures).
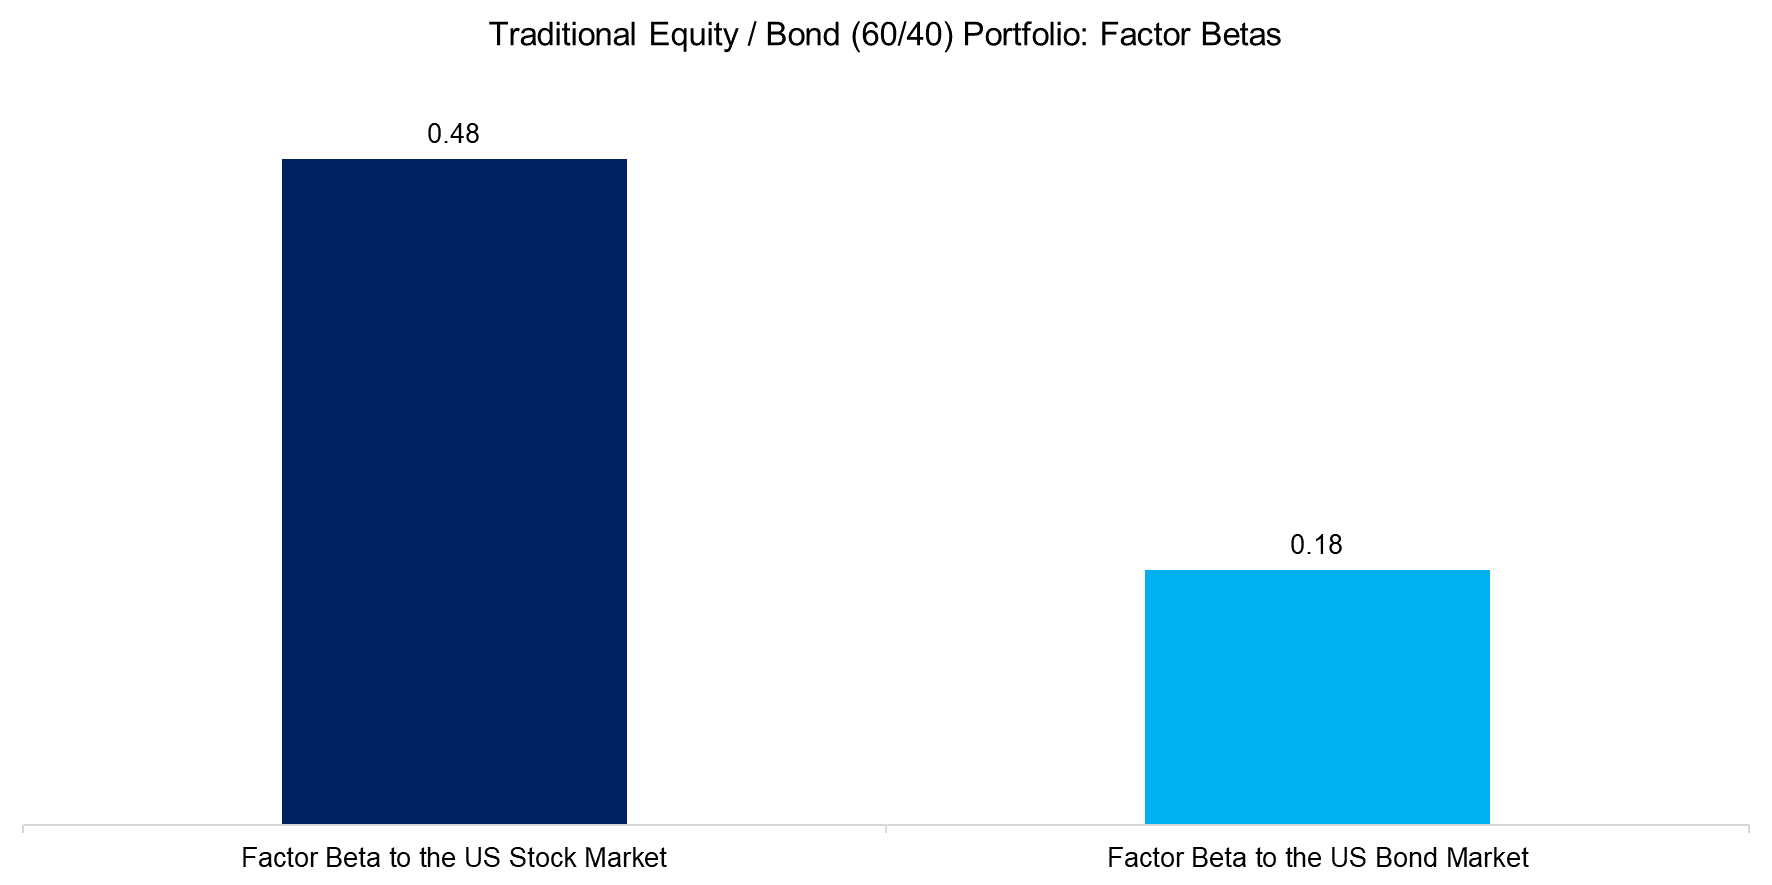
The analysis highlights a beta of 0.48 to the U.S. stock market and 0.18 to the U.S. bond market. It is rather intuitive to translate these betas into percentages that roughly equate to the portfolio allocations, i.e. 60% to stocks and 40% to bonds.
However, betas represent the sensitivity of the portfolio to these factors, which have a low informational value unless compared to the underlying time series. In the case of equities, this is relatively easy as most investors have some recollection of the recent stock market performance, but how about the performance of the momentum factor? Betas are far more difficult to interpret in such cases.
Source: Finominal
PORTFOLIO ALLOCATIONS VS RISK CONTRIBUTIONS
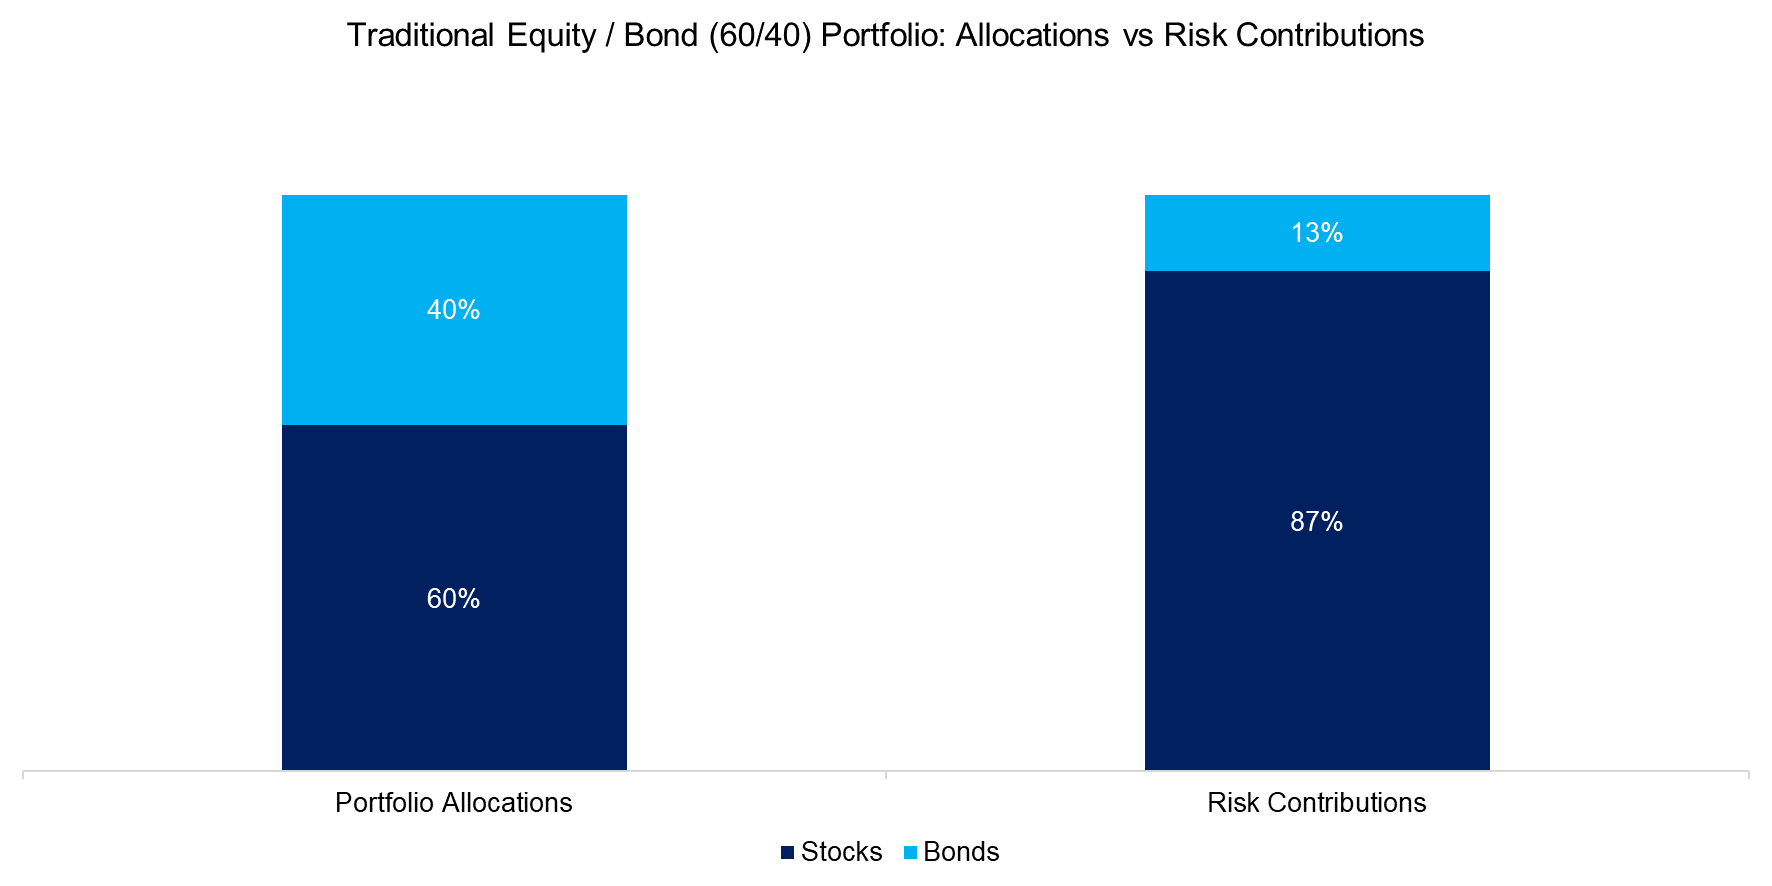
As a result of the factor exposure analysis, we have the betas that we can use to calculate how much each asset class has contributed to the risk of the 60/40 portfolio using the methodology from Grinold and Kahn (2000). Although the portfolio has only a 60% allocation to stocks, 87% of the portfolio’s volatility can be attributed to equities.
Given this, a 60/40 portfolio is much less diversified from a risk than from an allocation perspective, which becomes highly relevant for investors that require capital in the short-term, e.g. a private investor close to retirement. The S&P 500 has lost more than 50% of its value multiple times throughout history, so portfolios should be constructed and reviewed with a clear view of their inherent risks.
Source: Finominal
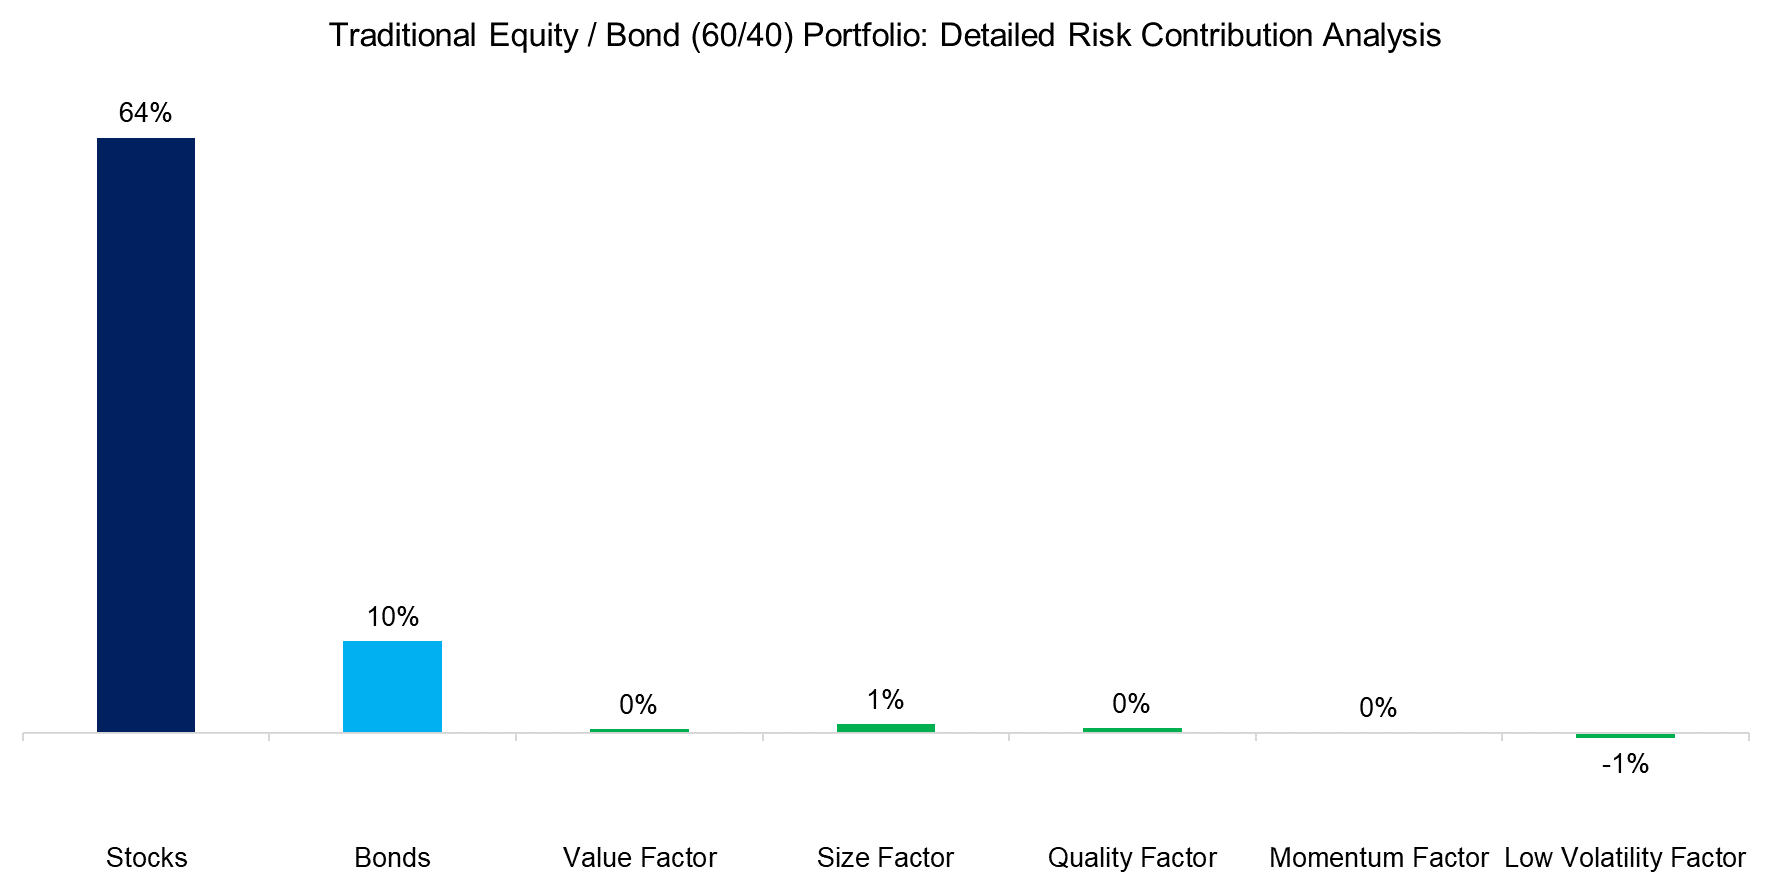
However, it is not only equity and fixed-income markets that impact the 60/40 portfolio, but also other factors. We expand the factor exposure analysis to include five standard equity factors.
Given the plain-vanilla nature of this portfolio, there was little equity factor exposure. However, we do note that the low volatility factor exhibits a negative risk contribution, which implies that this exposure reduced the portfolio risk.
Source: Finominal
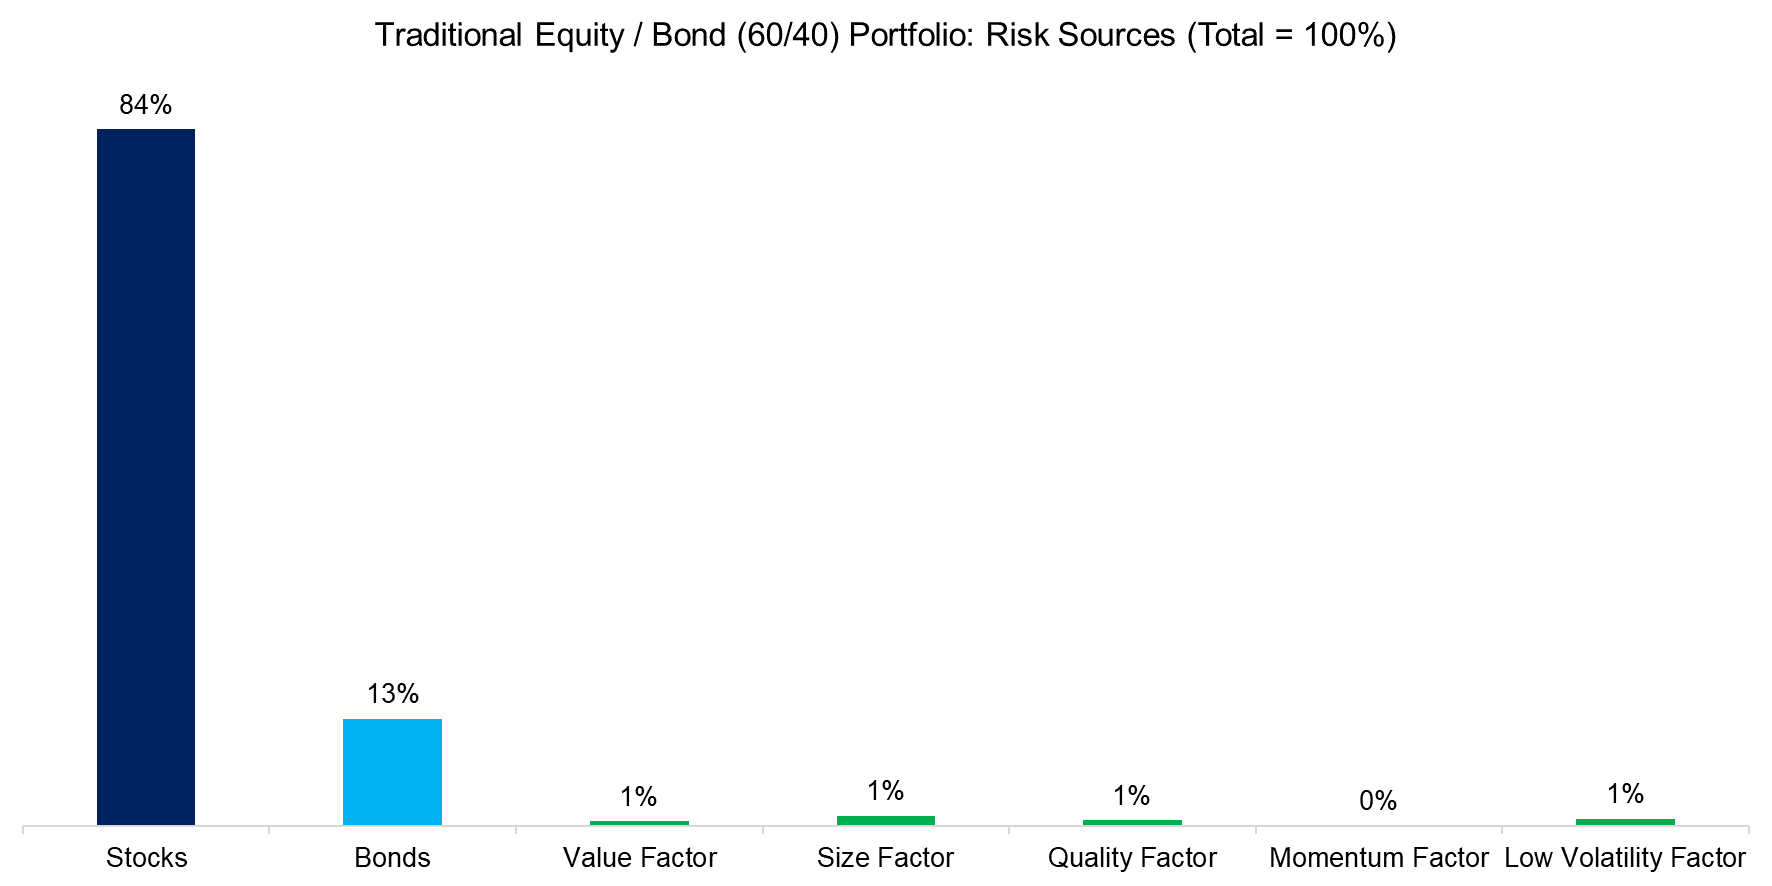
We can use the marginal risk contributions to calculate the risk sources by taking absolute values and standardizing these so that the total risk equates to 100%. This calculation makes different portfolios comparable as they have the same scale, but we always need to remember that some of the risk contributions might be negative.
Source: Finominal
RISK CONTRIBUTION ANALYSIS OF SMART BETA ETFS
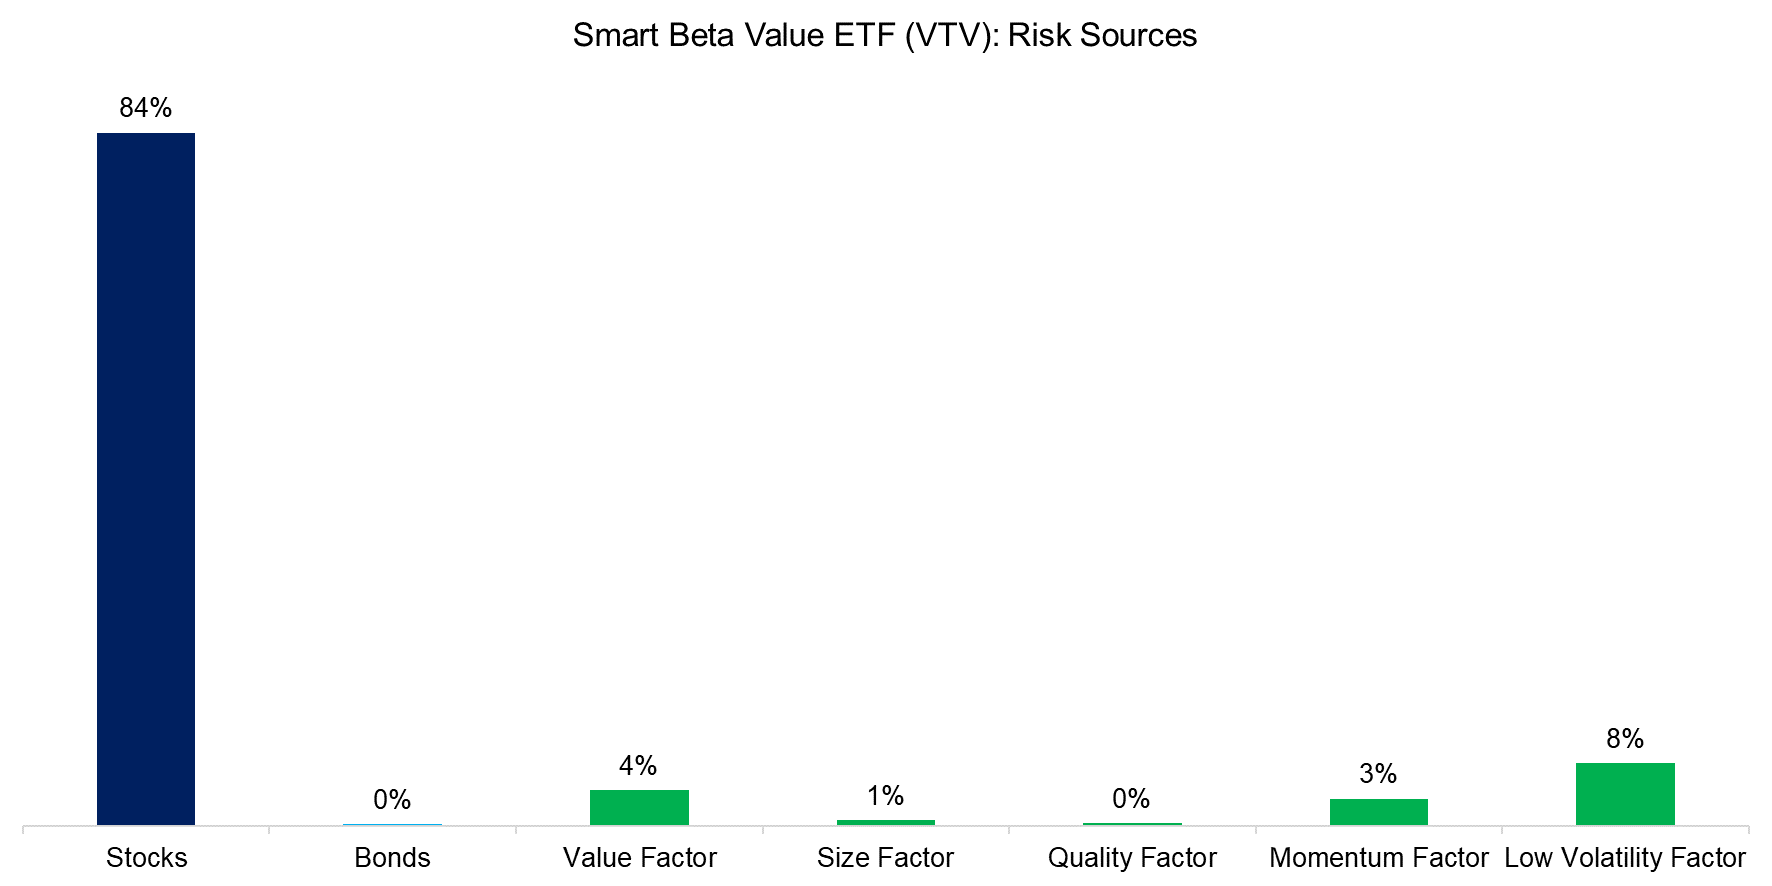
If a risk contribution analysis reveals insights into a 60/40 portfolio, then it will be even more useful for more complex products. Given this, we evaluate Vanguard’s Value ETF (VTV), which is the largest smart beta ETF in its category with $100 billion of assets under management.
Investors would expect that the value factor is a key driver of VTV’s performance, but that is marginal to the risk contribution from the stock market. The ETF is a long-only product that merely overweights cheap companies, so is still primarily driven by equities (read Smart Beta, Broken by Design?). Furthermore, the value factor contributed less to the risk over the last 12 months than the low volatility factor.
Source: Finominal
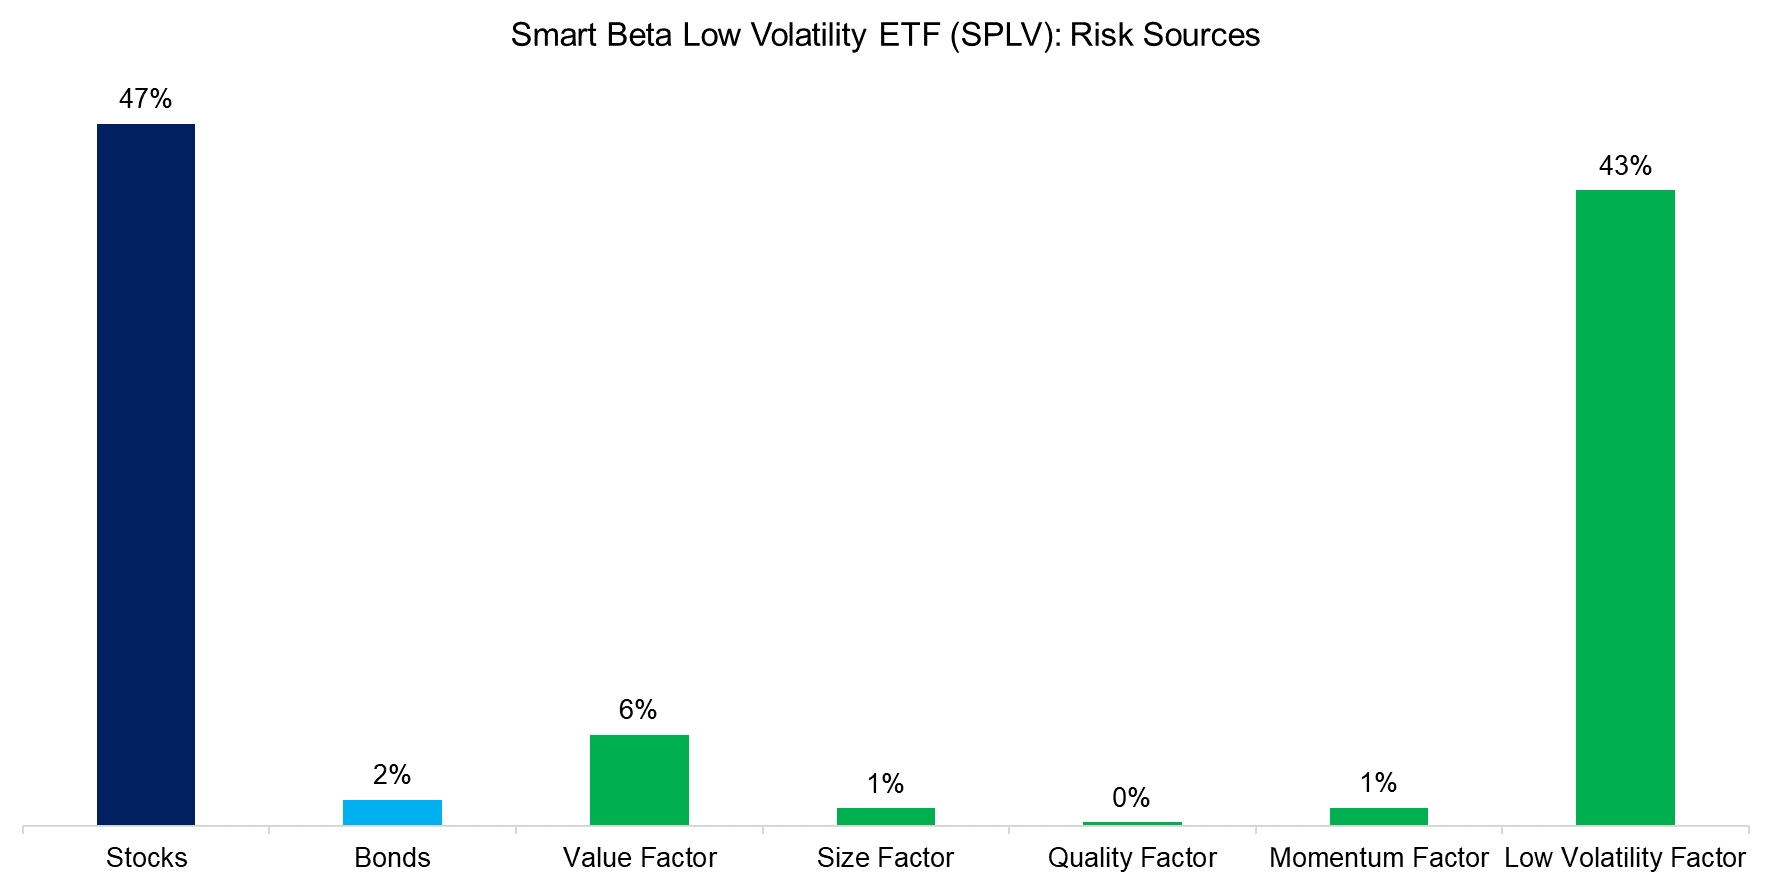
In contrast, running the same risk sources analysis for a smart beta low volatility (SPLV) ETF highlights that the primary factor contributed almost as much risk as the general stock market. Most smart beta ETFs provide simply stock market exposure with a factor tilting, but in this case, the portfolio construction of SPLV, which selects the 100 least volatile stocks of the S&P 500, provides significantly higher factor exposure.
Source: Finominal
FURTHER THOUGHTS
Like reasonable parents looking at the nutrient table before buying snacks for their children and not relying on the manufacturers’ advertisements, investors need to go beyond factsheets provided by asset managers. The holdings of an investment product say very little about what is driving its performance and risk, but that is what ultimately determines its suitability for an investor. Trust, but verify, as they say.
RELATED RESEARCH
Sector vs Factor-based Benchmark Selection
Mirror, Mirror, on the Wall, which is the Fairest Benchmark of All?
Outperformance Ain’t Alpha
Factor Exposure Analysis 101: Linear vs Lasso Regression
Factor Exposure Analysis 103: Exploring Residualization
Time Machines for Investors
Factor Exposure Analysis 102: More or Less Independent Variables?
What’s my International Exposure?
Beta in Beta-Neutral Factors
REFERENCED RESEARCH
ABOUT THE AUTHOR
Nicolas Rabener is the CEO & Founder of Finominal, which empowers professional investors with data, technology, and research insights to improve their investment outcomes. Previously he created Jackdaw Capital, an award-winning quantitative hedge fund. Before that Nicolas worked at GIC and Citigroup in London and New York. Nicolas holds a Master of Finance from HHL Leipzig Graduate School of Management, is a CAIA charter holder, and enjoys endurance sports (Ironman & 100km Ultramarathon).
Connect with me on LinkedIn or X.

