Replicating a CTA via Factor Exposures
Possible?
November 2022. Reading Time: 10 Minutes. Author: Nicolas Rabener.
SUMMARY
- Strategies can be copied by recreating them from scratch or using factor exposures
- CTAs can be replicated via factor exposure analysis by utilizing only 4 asset classes
- Not a perfect replication, but surprisingly good given the limited input
INTRODUCTION
Our two most recent research articles focused on creating a CTA, also known as managed futures or trend following strategies, from scratch (read Creating a CTA from Scratch – I & Creating a CTA from Scratch – II). Essentially, we applied a simple 12-month lookback for determining up and down trends in 59 markets from four asset classes. The result was a diversified portfolio of long and short positions that had a correlation of 0.6 to the SG CTA Index, which is the benchmark index for the managed futures industry, in the period from 2000 to 2022.
This approach is called a bottom-up replication as it copies the investment and portfolio construction process of CTAs. However, we can also replicate indices top-down via factor exposure analysis (read Replicating Famous Hedge Funds), which we explore in this research article.
We will only use four indices representing U.S. equities, U.S. Treasuries, commodities, and the U.S. Dollar, which are all available via ETFs. Given that CTAs trade up to 200 markets, we are likely to fail to achieve a close replication, but we shall see.
FACTOR EXPOSURE ANALYSIS
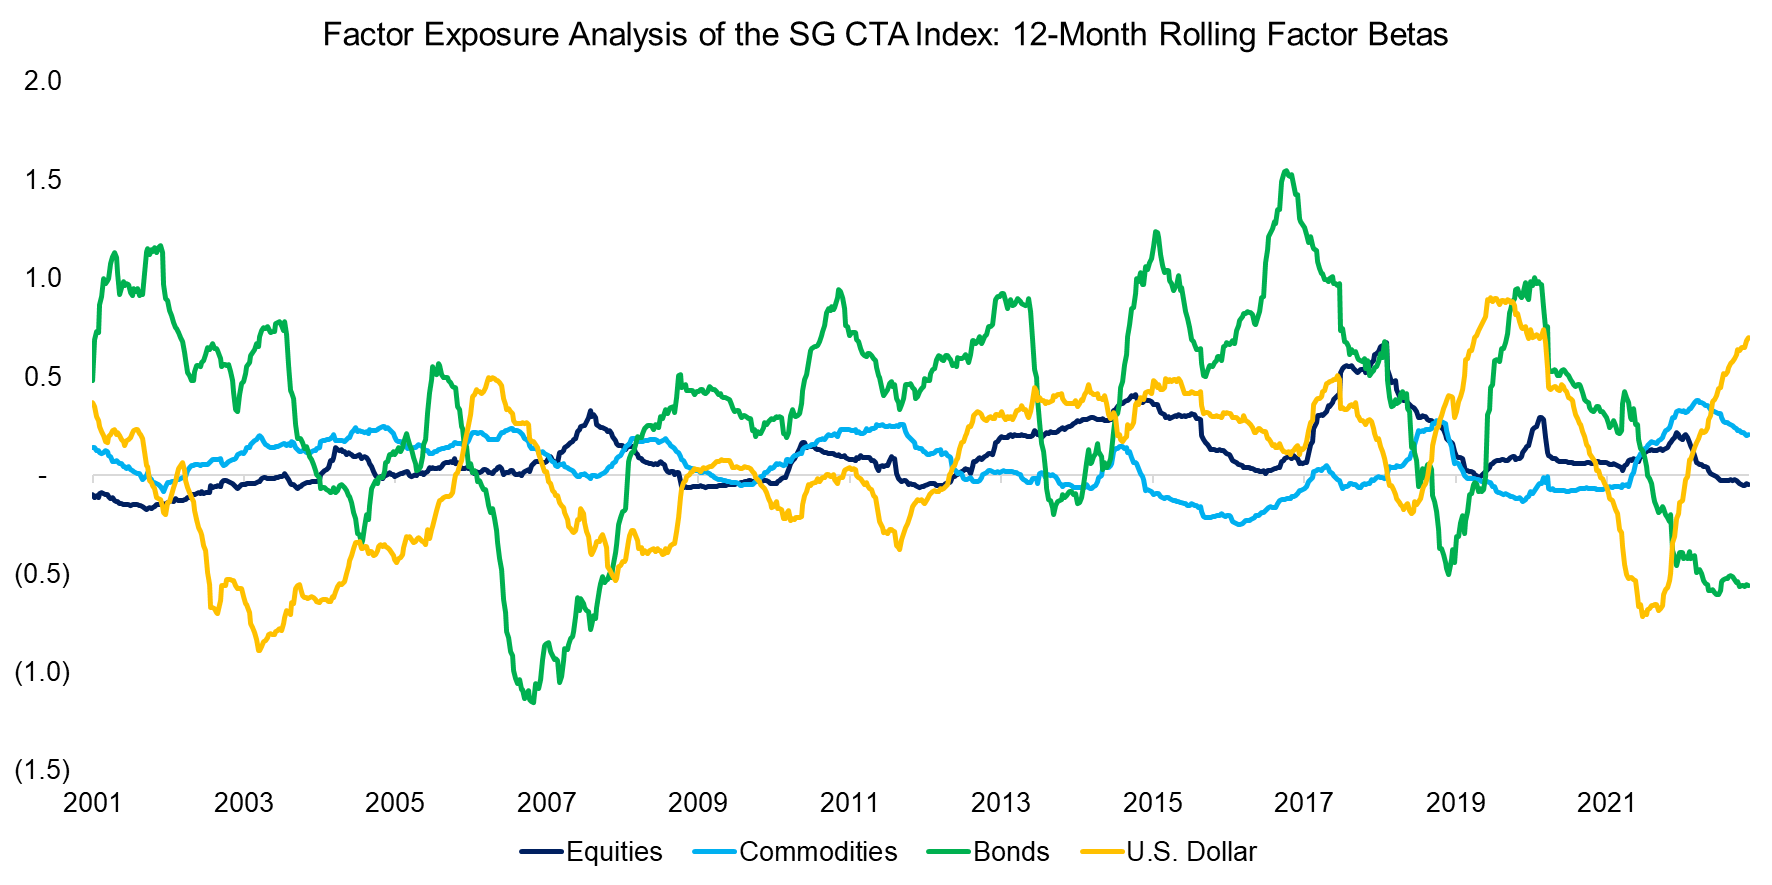
First, we conduct a simple regression analysis using the four asset class indices for deriving the factor betas for the SG CTA Index. We observe that the betas changed their signs multiple times in the period from 2001 to 2022. Furthermore, the betas to bonds and the U.S. Dollar were more extreme, but that is simply a function of bonds and currencies being less volatile than equities and commodities.
The current exposure of the SG CTA Index, which is comprised of 20 large and well-known managed futures funds, is long the U.S. Dollar, long commodities, neutral on equities, and short bonds.
Source: Societe Generale, Finominal
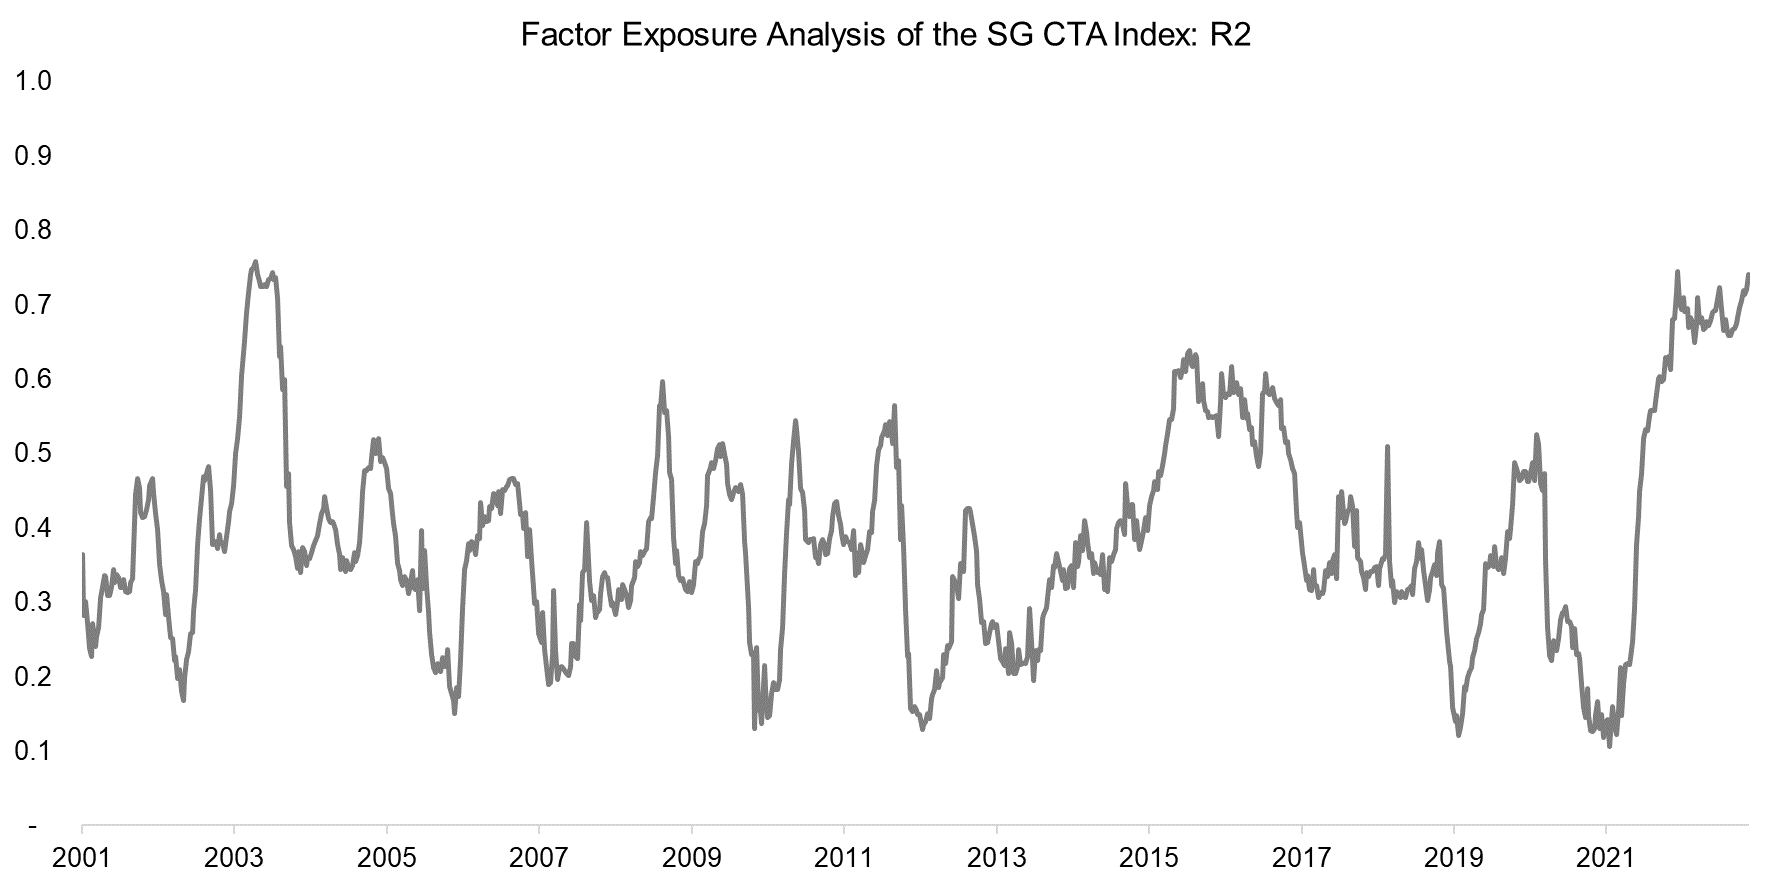
Given that we are using a regression for the top-down replication, it is worth reviewing the R2 over time (read Factor Exposure Analysis 101: Linear vs Lasso Regression). As expected, it is low with an average of 0.39 for the last 20 years, which implies that the four asset classes can only moderately explain the returns of the SG CTA Index.
Source: Finominal
CTA REPLICATION INDEX
Given that the R2 was relatively low, we should expect the replication via factor exposures to be quite poor. We create the CTA Replication Index by taking long or short exposure in each of the four asset classes, depending on the factor betas. Rebalancing occurs monthly, trading is implemented based on yesterday’s data, and transaction costs are ignored. We also leverage each of the indices, so that the portfolio volatility matches that of the SG CTA Index, which is approximately 8%.
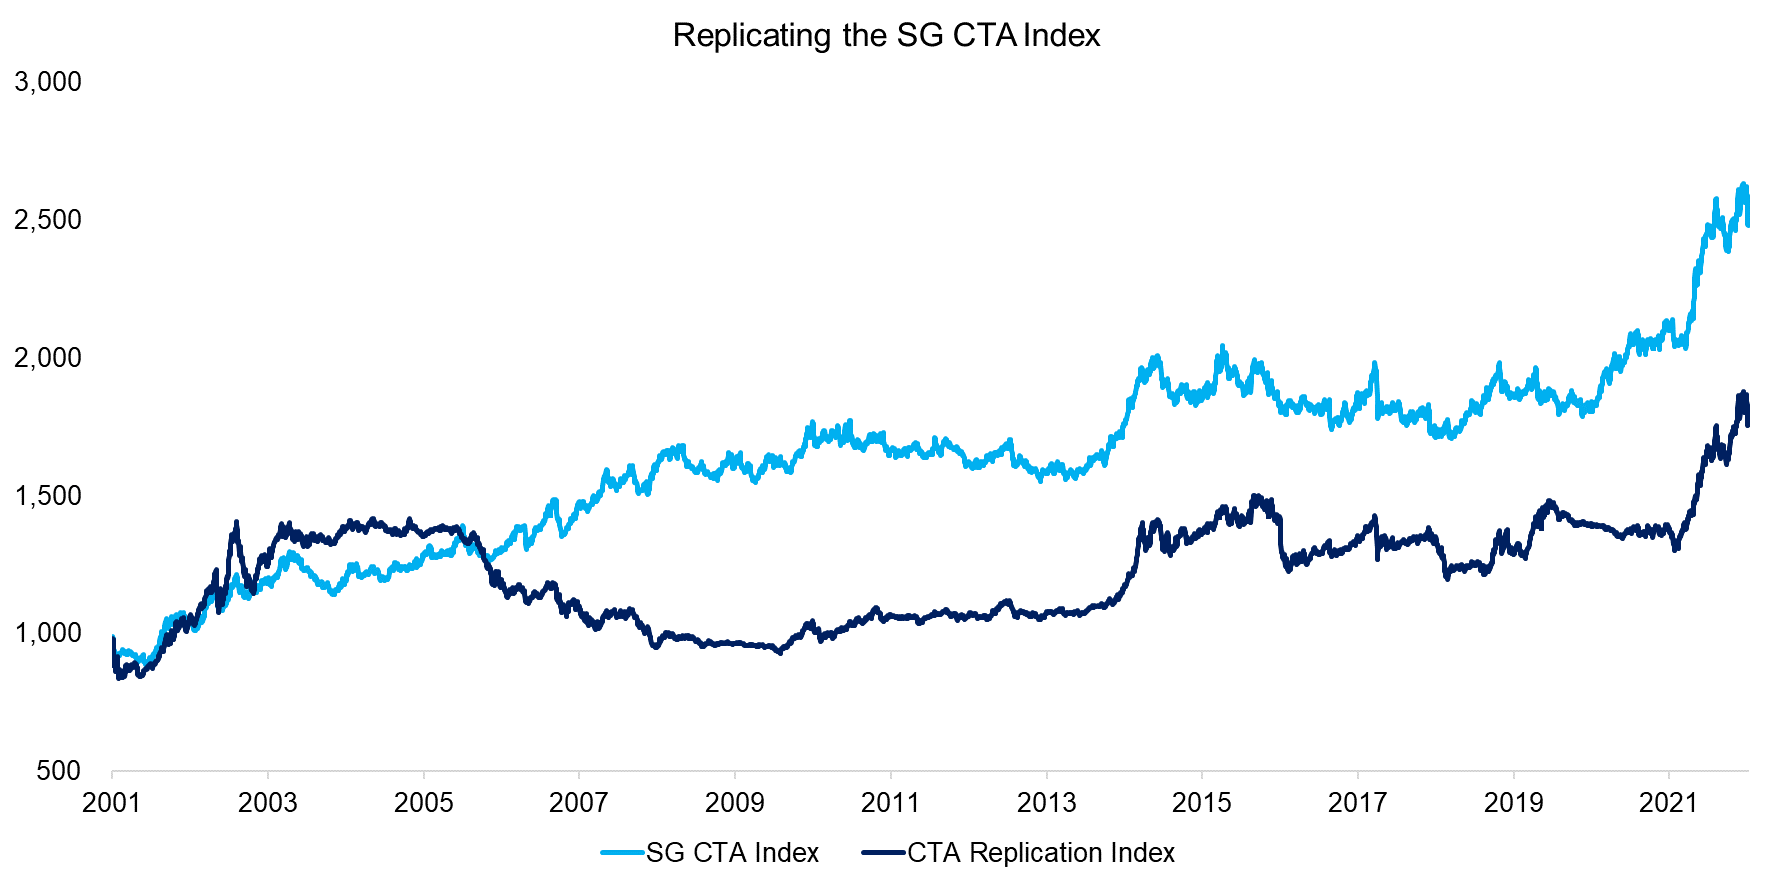
And indeed, contrasting the performance of the SG CTA Index and to the Replication Index highlights only moderate success. The SG CTA Index generated a CAGR of 4.4% in the period from 2001 to 2022, compared to 2.7% for the replication index.
We observe that both indices had similar trends in performance between 2001 and 2005, then diverged significantly during the global financial crisis, and then converged again from 2010 onwards.
Source: Finominal
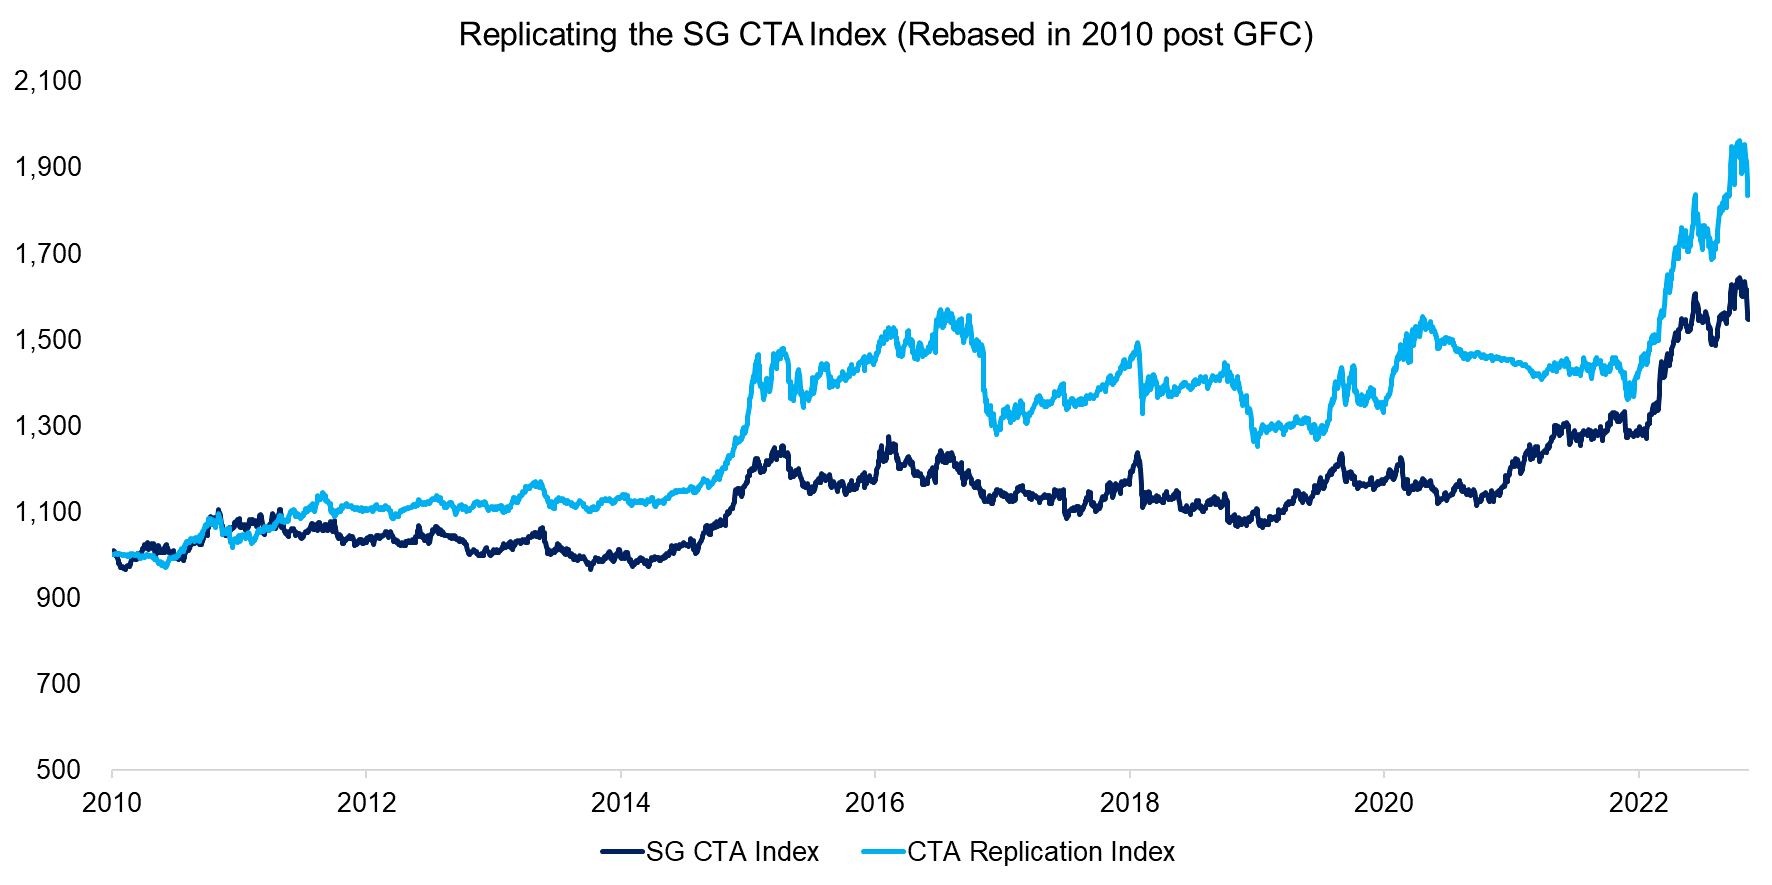
If we rebase the indices post the global financial crisis in 2010, then the performance of the replication index becomes much more comparable to that of the SG CTA Index.
Naturally, we can not simply ignore time periods like the global financial crisis when evaluating investing strategies, but it does highlight that the portfolios were significantly different in the period from 2006 to 2009. During this period financial markets were in turmoil with many trends occuring across the various markets, e.g. oil reached its all-time high in 2008 while equities were already crashing. Replicating all these trends via four asset classes indices is unlikely to capture what the average CTA was trading.
Source: Societe Generale, Finominal
CORRELATION ANALYSIS
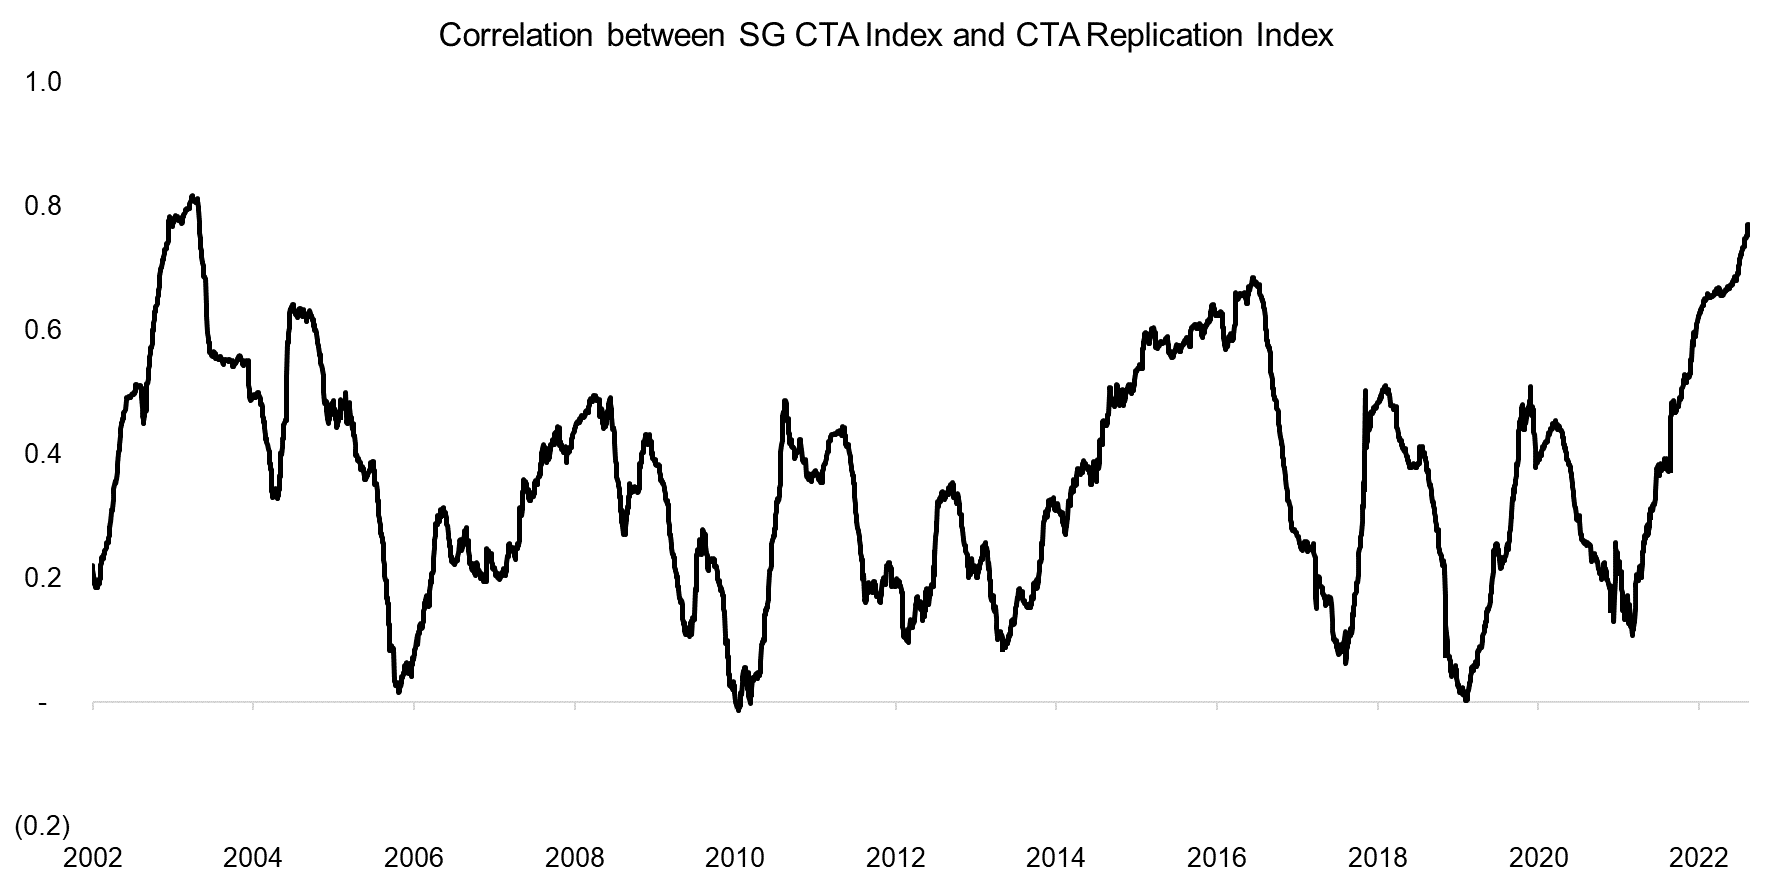
Next, we can calculate the correlation between the SG CTA Index and CTA Replication Index, which was 0.34 on average in the period from 2002 to 2022, compared to 0.6 for the bottom-up approach for creating a CTA from scratch. If we would use all the 59 indices used in the bottom-up approach, then the correlation would likely be significantly higher.
Source: Finominal
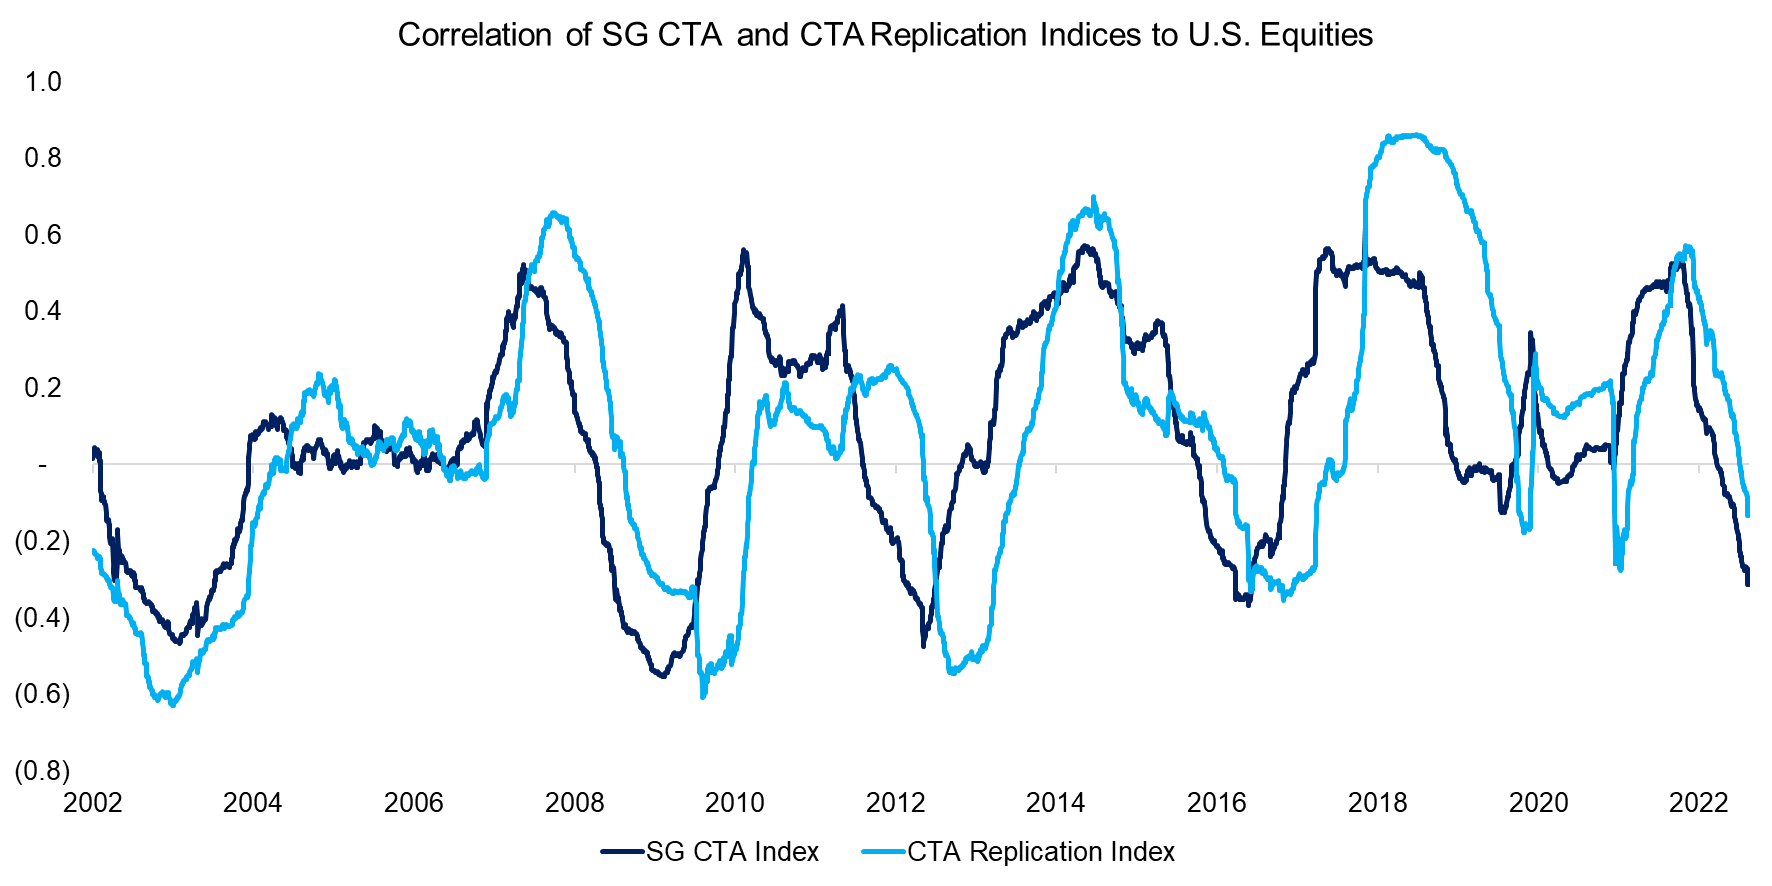
However, it is worth highlighting that both indices offered close to zero correlations to equities, which highlights their potential for diversifying traditional equity-bond portfolios. The correlation of the CTA Replication Index is lagged to that of the SG CTA Index, which is explained by monthly rebalancing and 12-month lookback for calculating the factor betas.
Source: Societe Generale, Finominal
FURTHER THOUGHTS
Is this an impressive replication?
Not if we look at R2 of the factor exposure analysis or correlation between the SG CTA Index and CTA Replication Index, which were low in both cases.
However, we managed to broadly capture what the average CTA is doing with only four indices, which is remarkable given its simplicity. Add a few more markets, implement a more thoughtful portfolio construction framework, and le voila – the replication will evolve from broad-brush to fine art.
RELATED RESEARCH
Creating a CTA from Scratch – I
Creating a CTA from Scratch – II
Managed Futures: The Empire Strikes Back
Defensive & Diversifying Strategies in YTD 2022
Building a Diversified Portfolio for the Long-Term – Part II
Managed Futures: Fast & Furious vs Slow & Steady
Hedging via Managed Futures Liquid Alts
60/40 Portfolios Without Bonds
A Horse Race of Liquid Alternatives
Liquid Alternatives: Alternative Enough?
Hedge Fund ETFs
Market Neutral Funds: Powered by Beta?
ABOUT THE AUTHOR
Nicolas Rabener is the CEO & Founder of Finominal, which empowers professional investors with data, technology, and research insights to improve their investment outcomes. Previously he created Jackdaw Capital, an award-winning quantitative hedge fund. Before that Nicolas worked at GIC and Citigroup in London and New York. Nicolas holds a Master of Finance from HHL Leipzig Graduate School of Management, is a CAIA charter holder, and enjoys endurance sports (Ironman & 100km Ultramarathon).
Connect with me on LinkedIn or X.

