GARP Investing: Golden or Garbage? II
More the latter than the former unfortunately
August 2023. Reading Time: 10 Minutes. Author: Nicolas Rabener.
SUMMARY
- Buying cheap growth stocks is intuitively appealing to investors
- Almost 50% of the US stocks are trading below a PEG ratio of 1 currently
- However, GARP stocks have not generated positive excess returns since 2005
INTRODUCTION
In 2019, we published a research note on growth-at-reasonable-price (GARP) investing (Garp Investing: Golden or Garbage?), where we concluded that the strategy had some nice attributes, eg outperforming significantly during the implosion of the technology bubble in 2001. Fast forward 20 years and another technology bubble burst with some former darlings like Peloton or Zoom having lost more than 90% of their value.
Given this, it would be interesting to see if GARP stocks outperformed again during the correction of growth stocks in 2022. However, there is also a second research question namely that despite the favorable backtesting results, there are surprisingly few mutual funds and ETFs offering exposure to GARP stocks. If this strategy is so good, why aren’t there more products out there?
In this research note, we will have another look at GARP investing.
DEFINING GARP STOCKS
GARP stocks are defined as having a price-earnings-growth (PEG) ratio of below one with the P/E ratio in the nominator and three-year earnings growth in the denominator. We consider all stocks in the US stock market with a market capitalization above $1 billion and create a portfolio by selecting all available GARP stocks. The portfolio is equal-weighted, rebalanced on a monthly basis, and we include 10 basis points for transaction costs.
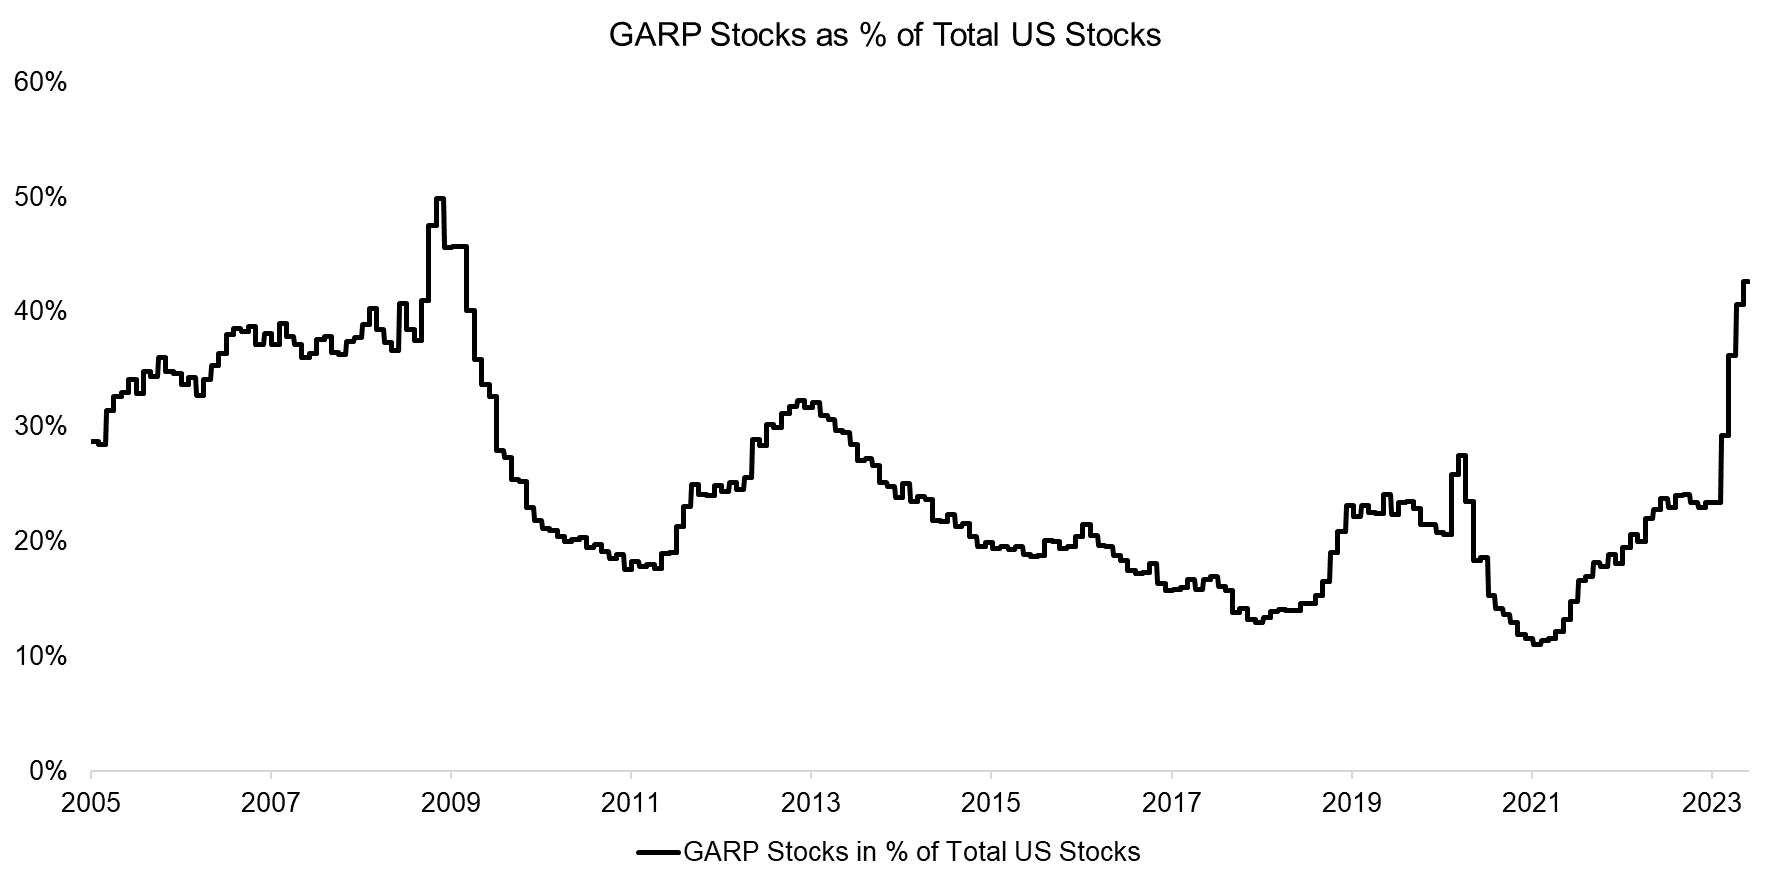
First, we evaluate the number of GARP stocks in our universe, which varied wildly across time. Specifically, we observe the number of GARP stocks breached 50% during the Global Financial Crisis in 2008, when valuations reached extremely low levels, and has most recently also come close to this magnitude again. In contrast, during bull periods of the stock market like 2010, 2018, or 2021, less than 20% of the stocks featured PEG ratios of below 1.
Source: Finominal
CHARACTERISTICS OF GARP STOCKS
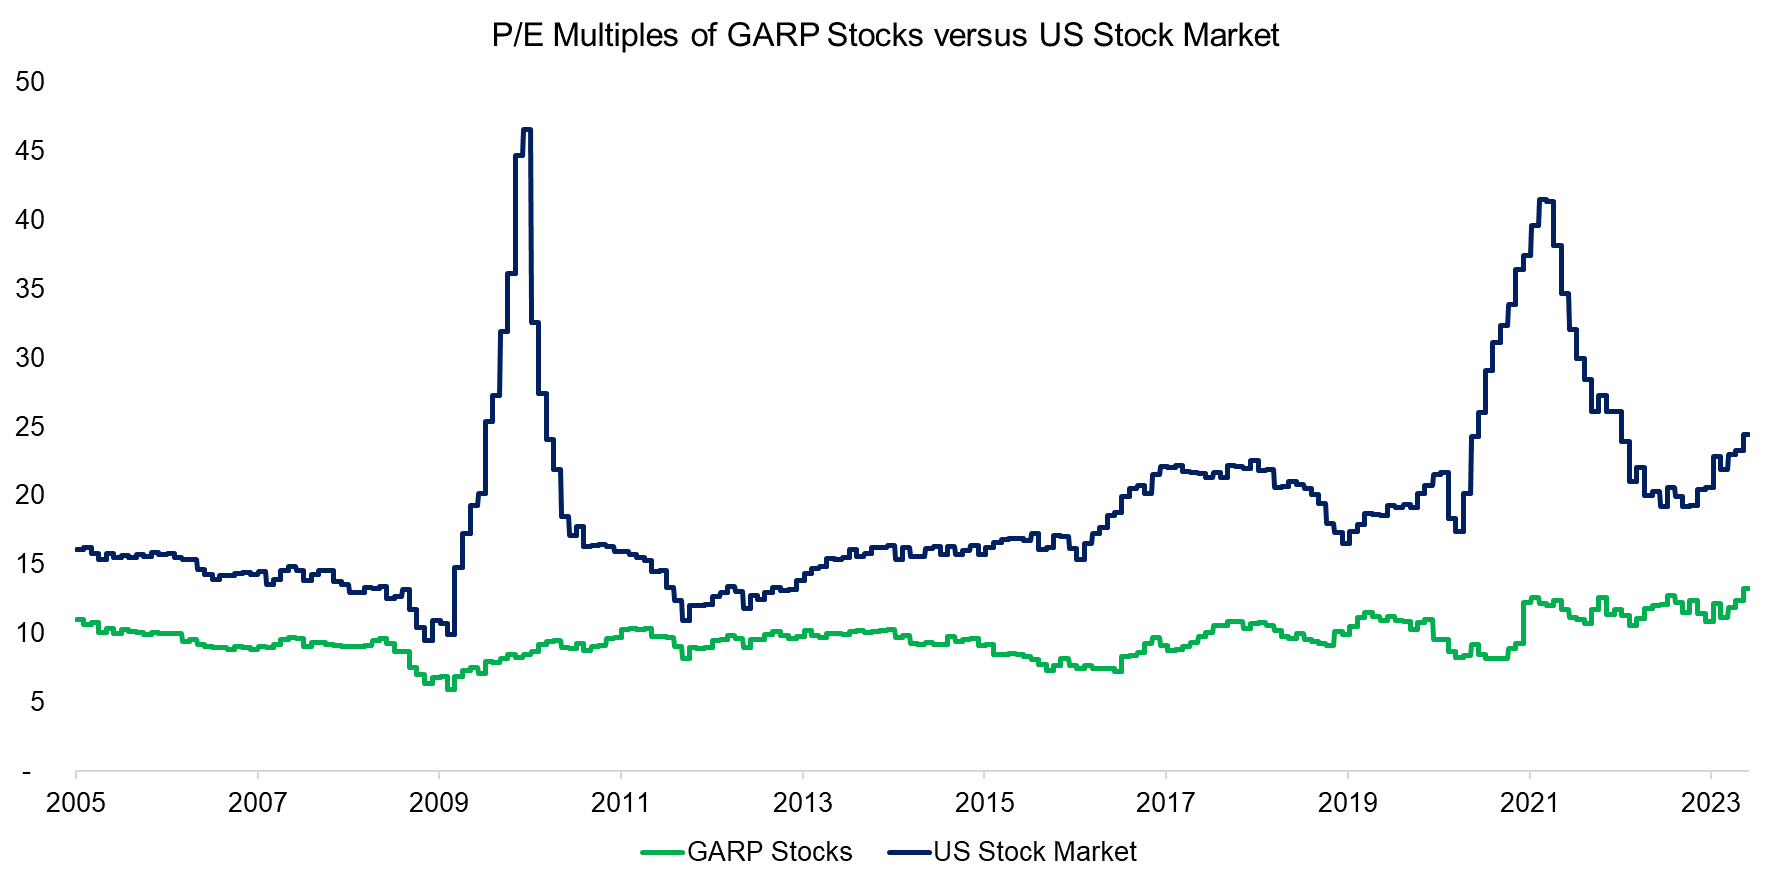
Next, we evaluate the valuation characteristics of GARP stocks. We observe that these stocks have traded at an average P/E ratio of below 10x in the period between 2005 and 2023, compared to 19x for the entire US stock market. Furthermore, the broad stock market reached excessive valuation levels during crisis times like the GFC in 2009 or COVID-19 in 2020 when earnings decreased significantly, which GARP stocks avoided.
Source: Finominal
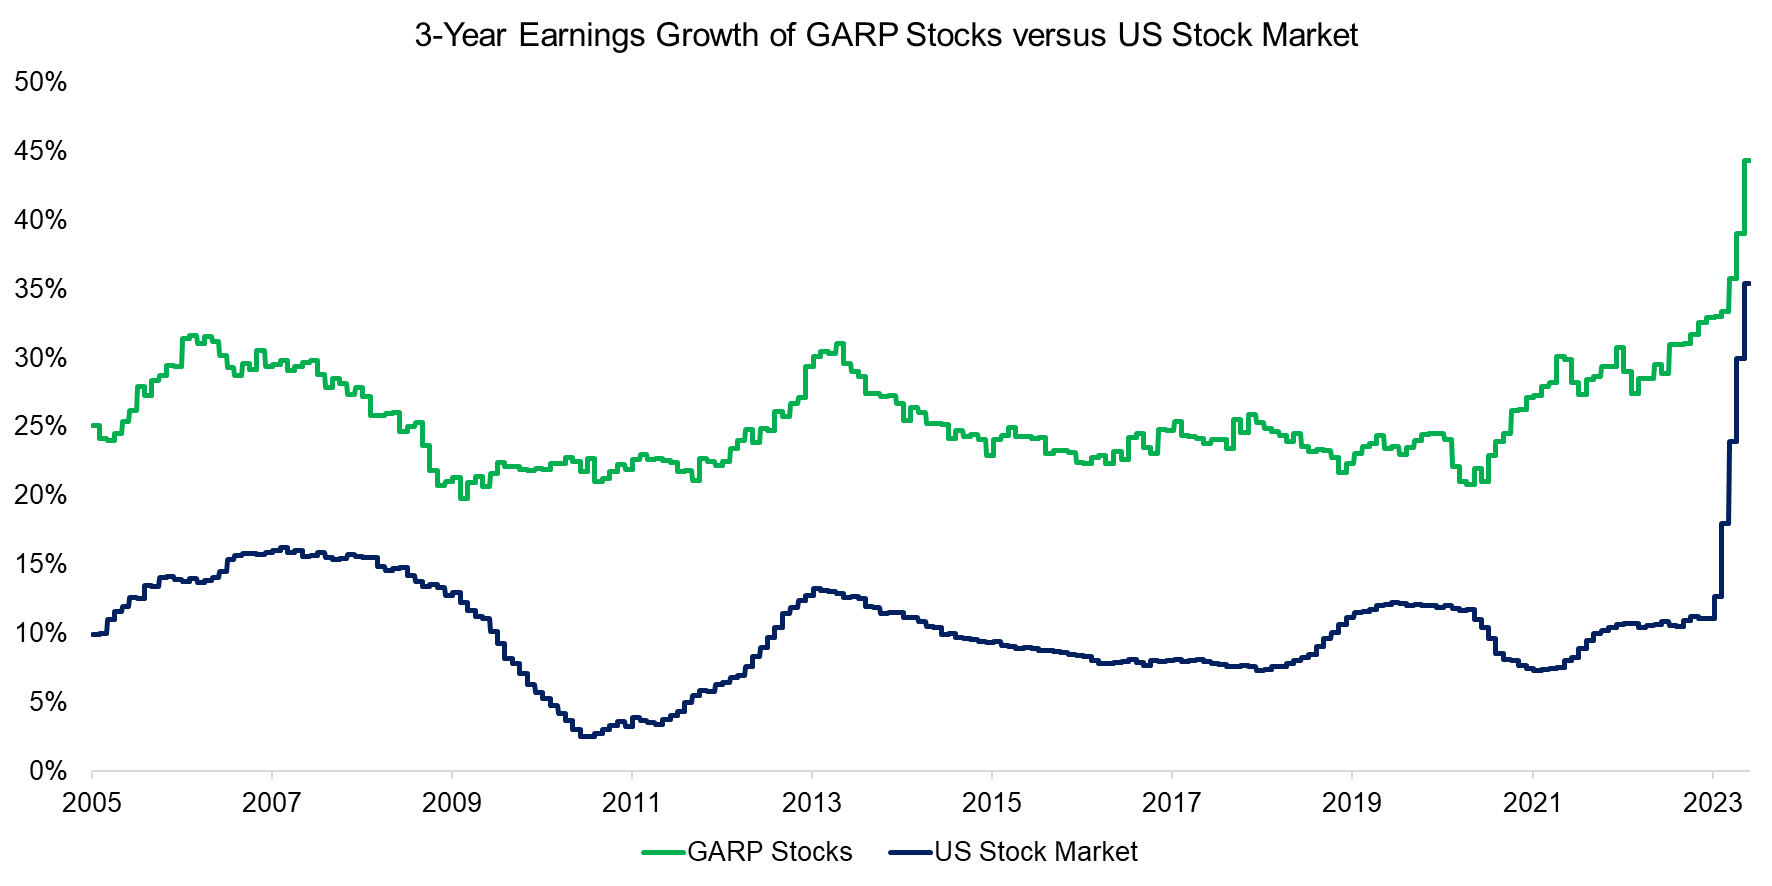
Then we analyze the three-year earnings growth rate of GARP stocks, which highlights an average rate of 26% in the period from 2005 to 2023, compared to 10% for all stocks. The 15% gap remains relatively constant throughout the period. The earnings growth seems to explode in 2023, but that is explained by using 2020 as the starting point when using a three-year lookback, where earnings were depressed given the COVID-19 crisis.
Source: Finominal
PERFORMANCE OF GARP STOCKS
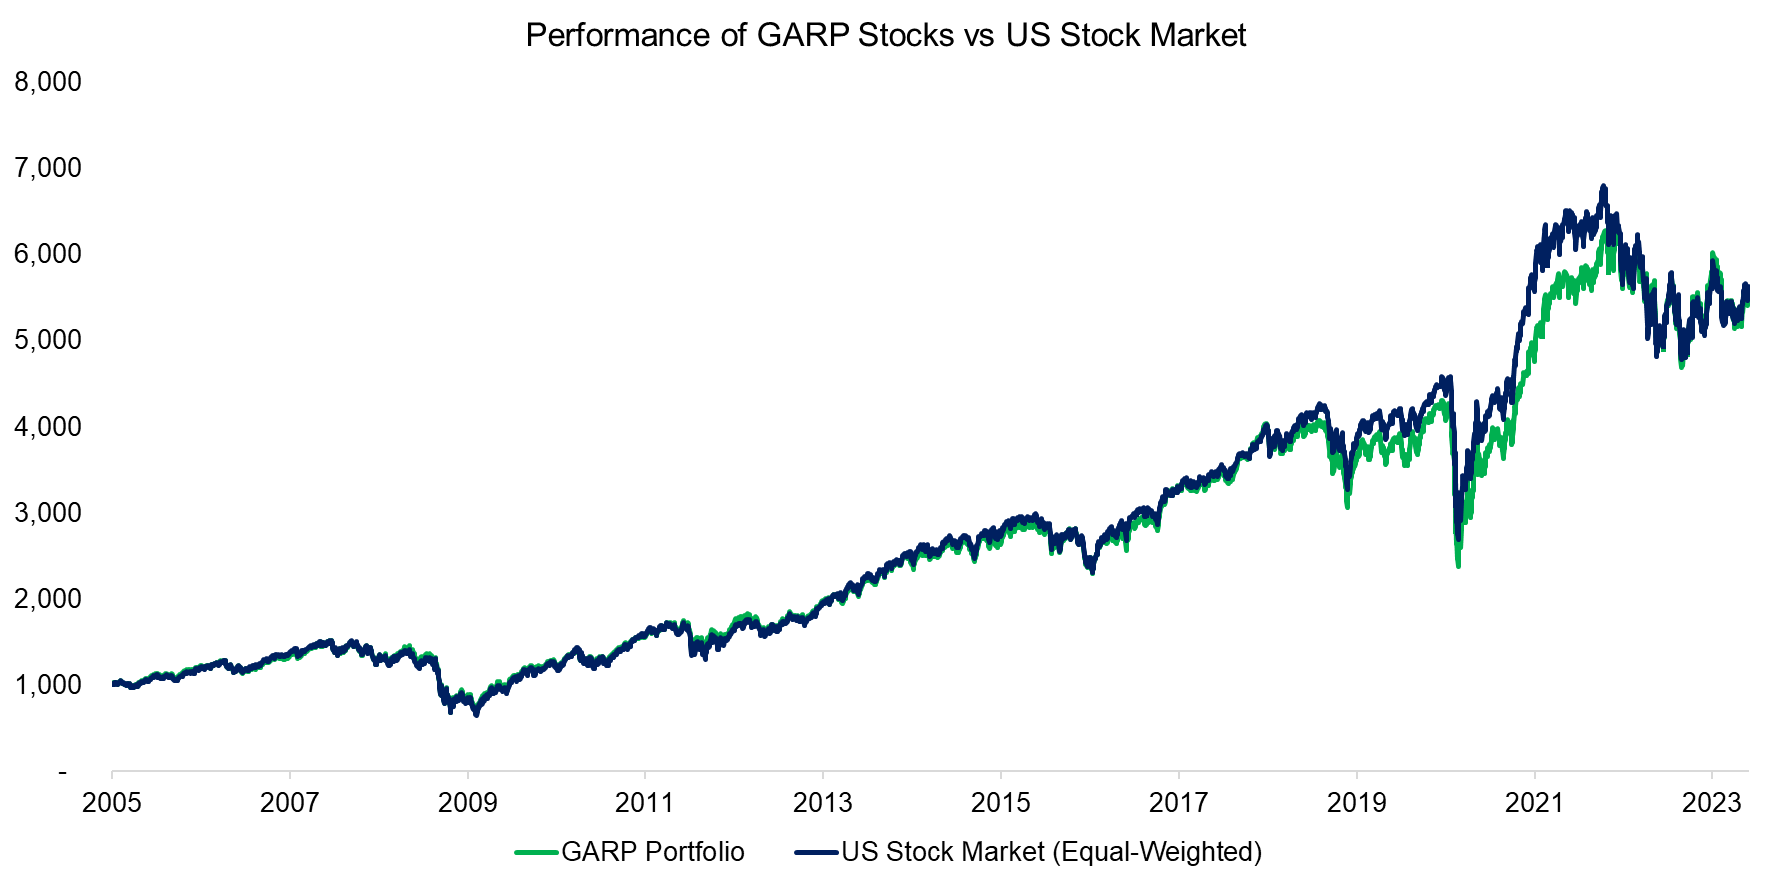
Finally, we evaluate the performance of GARP investing, which highlights an almost identical performance to an equal-weighted index of the entire US stock market over the last 18 years. GARP stocks underperformed slightly between 2018 and 2022, but then slightly outperformed in 2022 when growth stocks fell out of favor.
Source: Finominal
The performance analysis above can be challenged as we created a portfolio using all GARP stocks, which at times includes large parts of the entire stock market and was not always particularly concentrated.
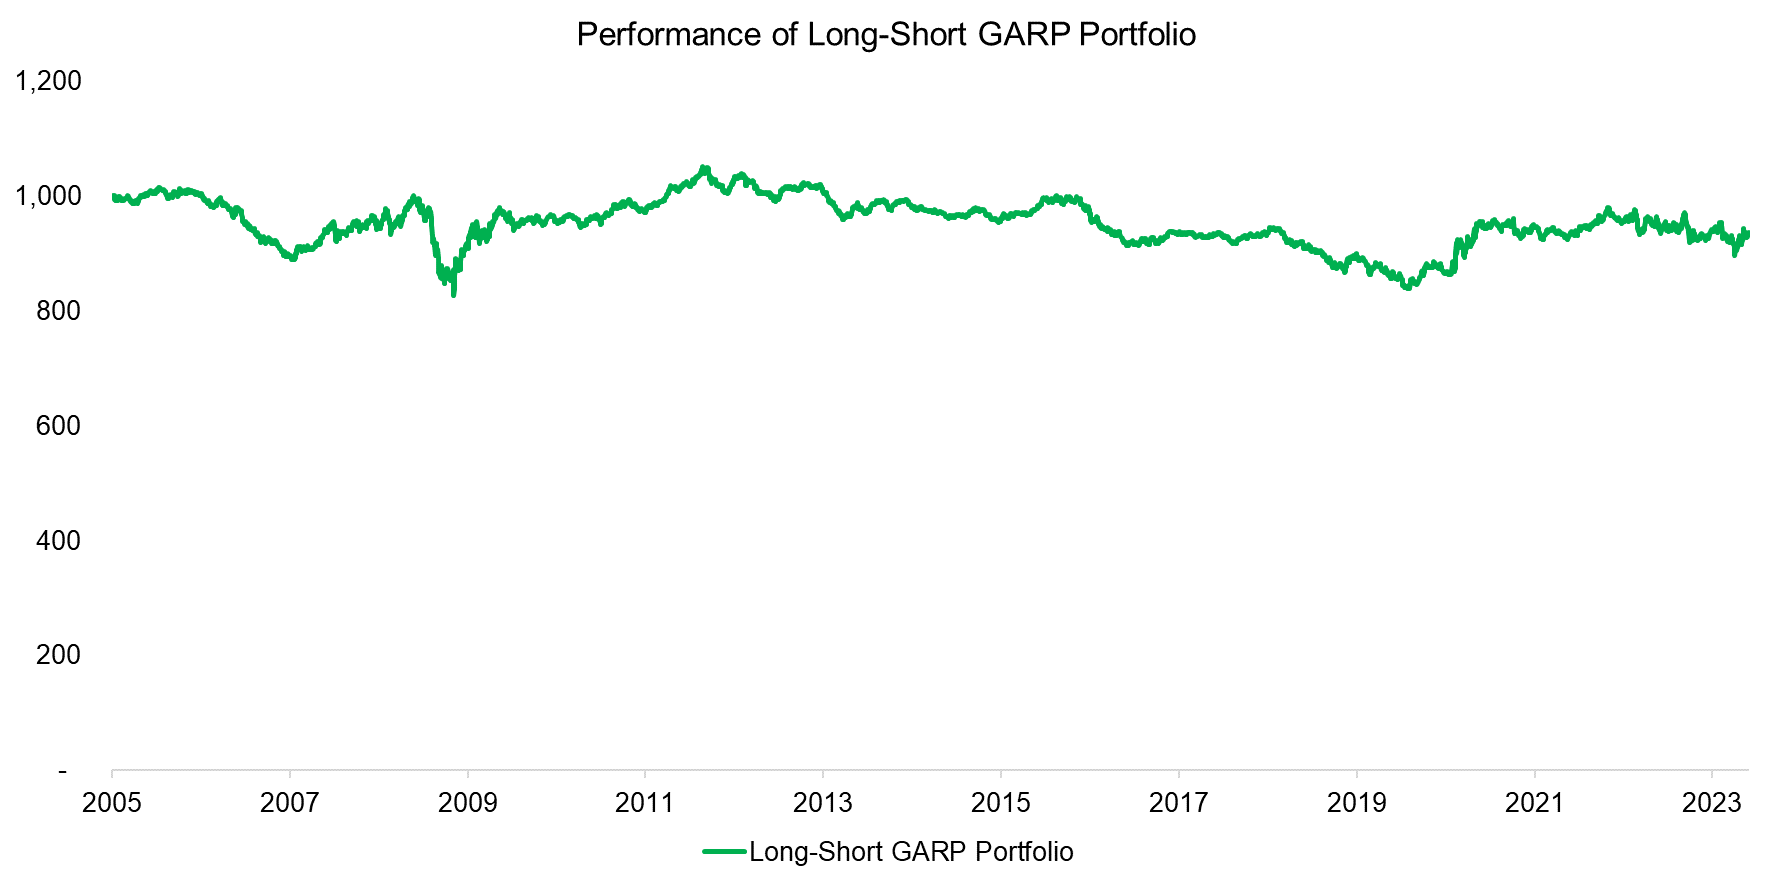
However, we can highlight the performance of GARP stocks more clearly by constructing a long-short portfolio, where we go long the 30% of stocks with the lowest PEG ratio and short the 30% with the highest PEG ratio. We observe that the performance of this portfolio was essentially flat since its inception in 2005.
Source: Finominal
FURTHER THOUGHTS
It seems that our second take on GARP investing is slightly less optimistic than our first one, which can partially be explained by us using a different provider for fundamental and price data than in 2019. Theoretically, the major data providers like Bloomberg or Factset offer the same data for US stocks, but in practice, there are differences that impact strategy backtesting significantly. Although it is questionable which data provider offers the better data, the conservative assumption would be to go with the less attractive backtest.
Furthermore, GARP stocks did not outperform as strongly during the tech bubble implosion of 2022 as they did during the one in 2001, which further deteriorates the strategy’s attractiveness. Although buying cheap growth stocks is intuitively appealing to investors, it is perhaps too good to be true, at least for generating alpha.
RELATED RESEARCH
GARP: Golden or Garbage?
Upside versus Downside Stocks
Shorting Lousy Stocks = Lousy Returns?
What Are Growth Stocks?
Integrated Value, Growth & Quality Portfolios
Sequential Model: Sorting by 5 Factors
ABOUT THE AUTHOR
Nicolas Rabener is the CEO & Founder of Finominal, which empowers professional investors with data, technology, and research insights to improve their investment outcomes. Previously he created Jackdaw Capital, an award-winning quantitative hedge fund. Before that Nicolas worked at GIC and Citigroup in London and New York. Nicolas holds a Master of Finance from HHL Leipzig Graduate School of Management, is a CAIA charter holder, and enjoys endurance sports (Ironman & 100km Ultramarathon).
Connect with me on LinkedIn or X.

