HY Bonds = High or Hazardous Yield?
Sacrificing return of capital for return on capital
February 2024. Reading Time: 10 Minutes. Author: Nicolas Rabener.
SUMMARY
- The correlation of high yield (HY) to investment-grade (IG) bonds has been increasing
- HY bonds can simply be replicated via a combination of the S&P 500 and IG bonds
- Replication portfolios offer better Sharpe ratios, which makes a case against using HY bonds in asset allocation
INTRODUCTION
When we recently ran a peer review analysis for BlackRock’s 60/40 Target Allocation Fund (BIGPX), then the list of ETF peers did not only include similar cross-asset allocation funds, but also high yield funds like Fidelity’s High Yield Factor ETF (FDHY) and iShares’ iBoxx $ High Yield Corporate Bond ETF (HYG).
Our initial reaction was that the algorithmic peer selection process was poor, but upon further reflection, this assessment might be correct. After all, high yield bonds sit somewhere between equity and debt in the capital structure of companies. Given that a 60/40 portfolio represents a combination of equity and debt securities, this might be equivalent to a high yield bond portfolio.
However, this implies that high yield bonds provide negative diversification benefits as they increase the equity and debt exposures, which makes them structurally unattractive for a diversified portfolio.
In this research article, we will review the use of high yield bonds within asset allocation.
FACTOR EXPOSURE ANALYSIS
In this analysis, we use iShares’ iBoxx $ High Yield Corporate Bond ETF (HYG) as the benchmark for high yield bonds given that it is the largest ETF with approximately $15 billion of assets under management in this category.
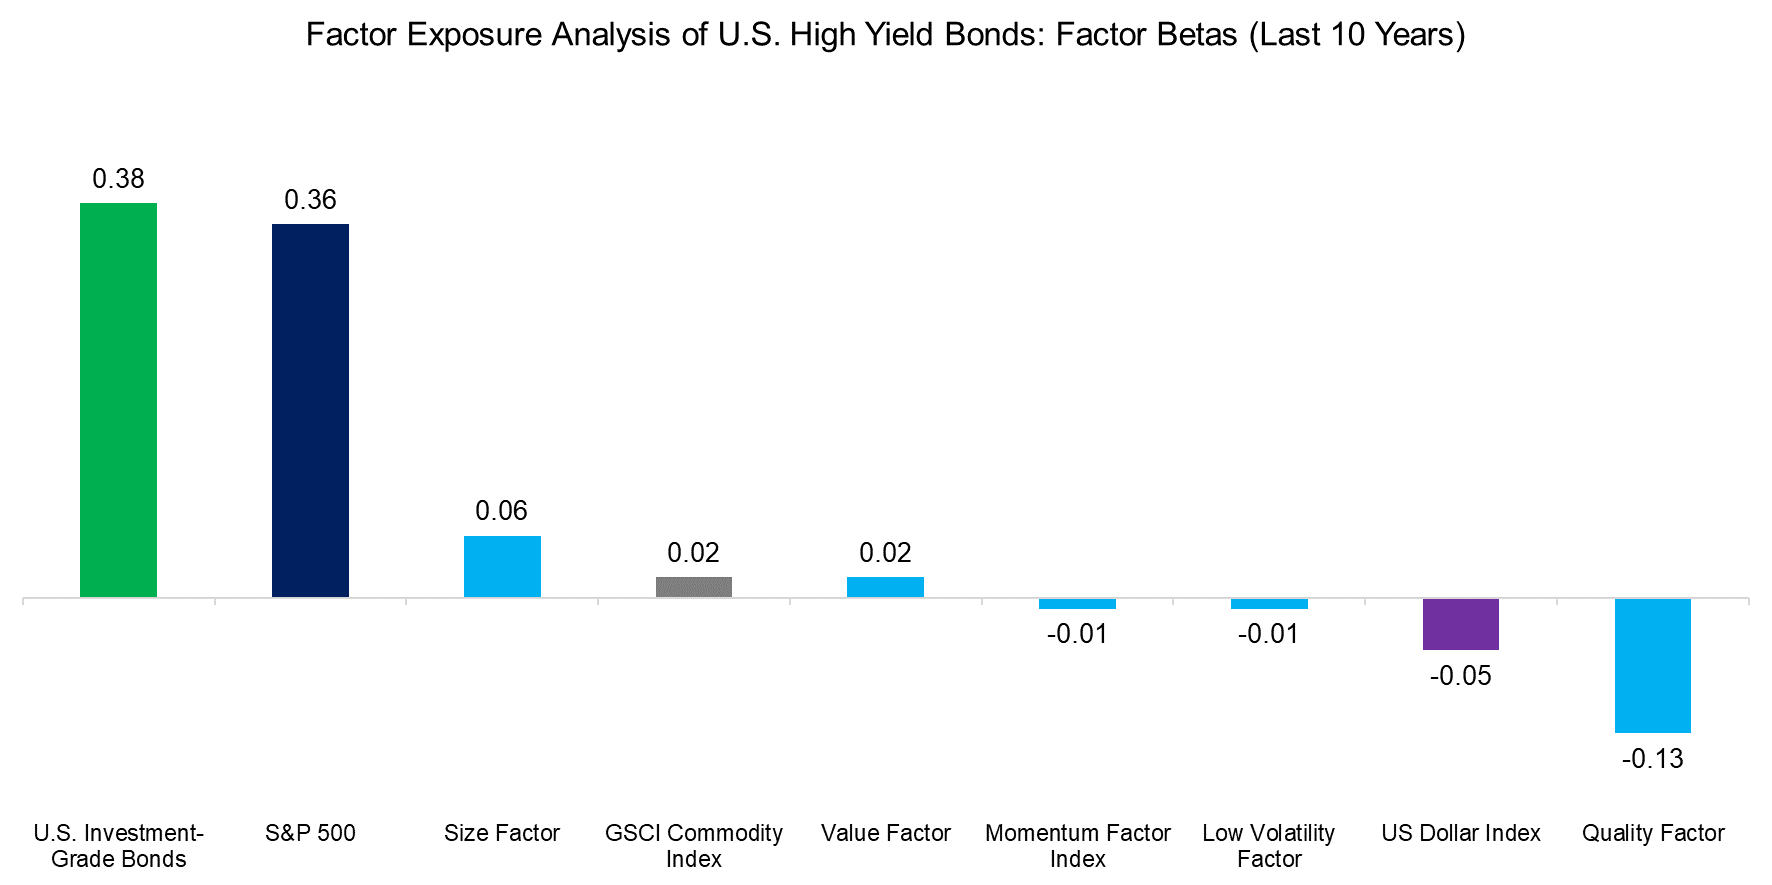
First, we run a factor exposure analysis that reveals that high yield bonds exhibit almost identical betas to U.S. investment-grade bonds and the S&P 500 when using daily returns and a 10-year lookback period. The betas to the US Dollar index, commodities, and popular equity factors are minor, except for a significant negative exposure to the quality factor, which reconciles with the typical high yield corporate bond issuer representing a company that features too much leverage and poor profitability.

Source: Finominal
CORRELATIONS TO THE STOCK & BOND MARKETS
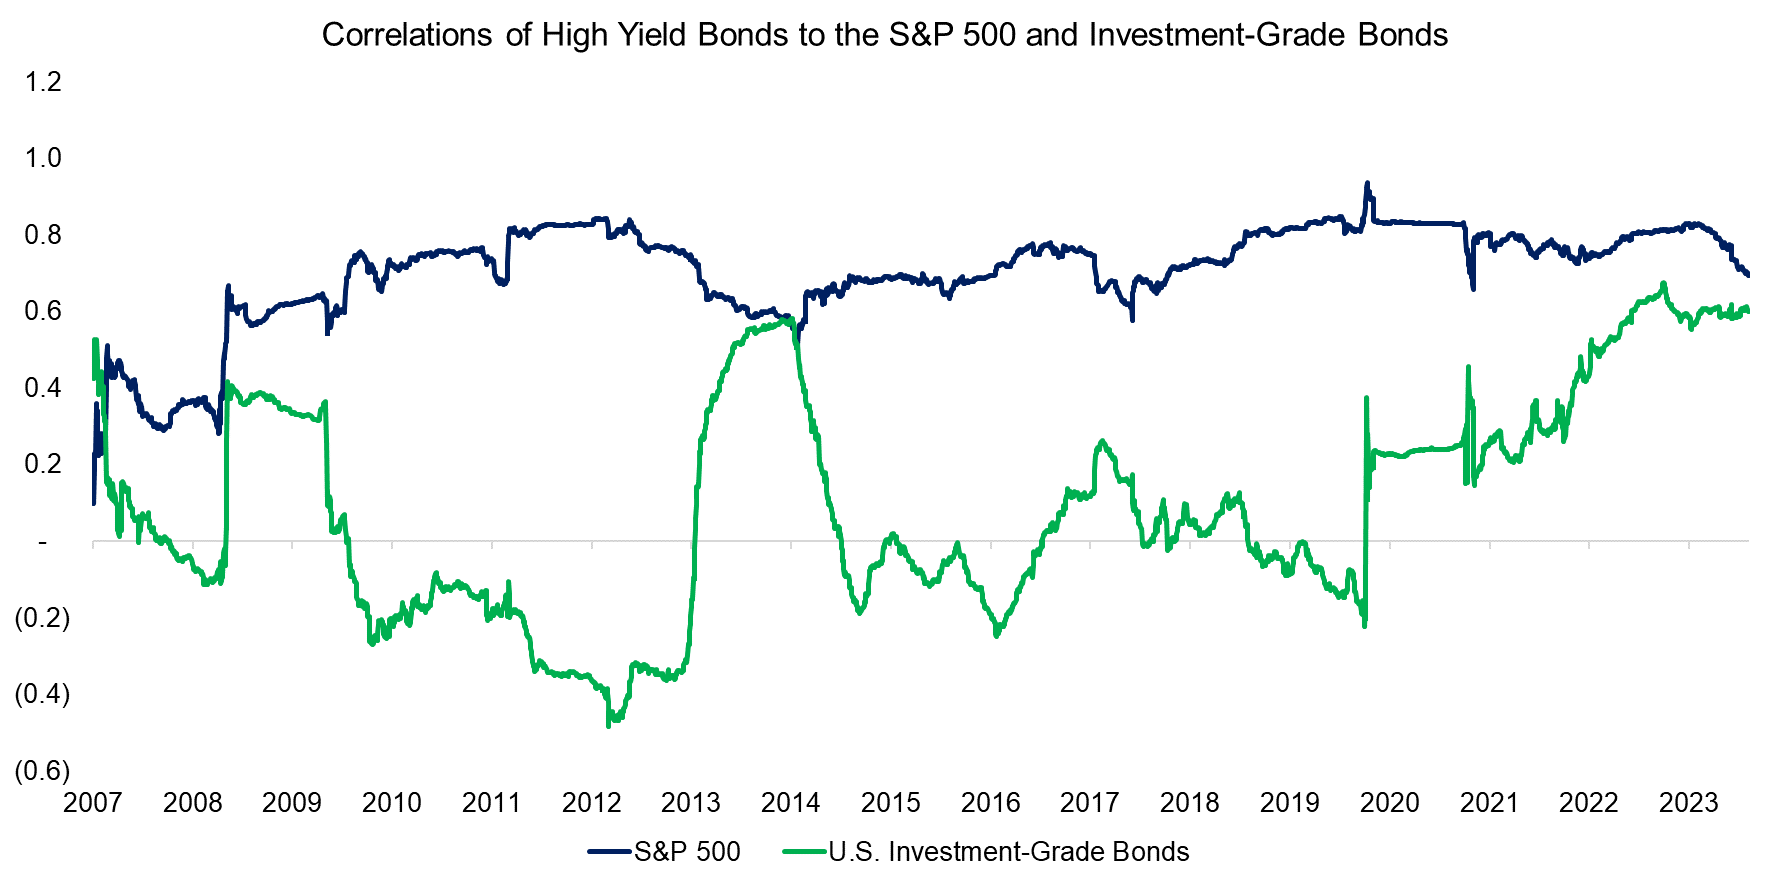
Next, we compute the rolling 12-month correlations of high yield bonds to the S&P 500 and U.S. investment-grade bonds in the period from 2007 to 2023. We observe that the correlation to the stock market was consistently high with an average of 0.7, which implies limited diversification benefits. In contrast, the correlation to the bond market was close to zero on average, but it increased to 0.6 over the last few years, which is concerning.

Source: Finominal
REPLICATING HIGH YIELD BONDS
The R2 of the regression analysis used for computing the factor betas was only 0.67, so it should be interesting to see if high yield bonds can be replicated via a simple combination of the S&P 500 and U.S. investment-grade bonds (read Replicating Popular Investment Strategies with Equities + Cash).
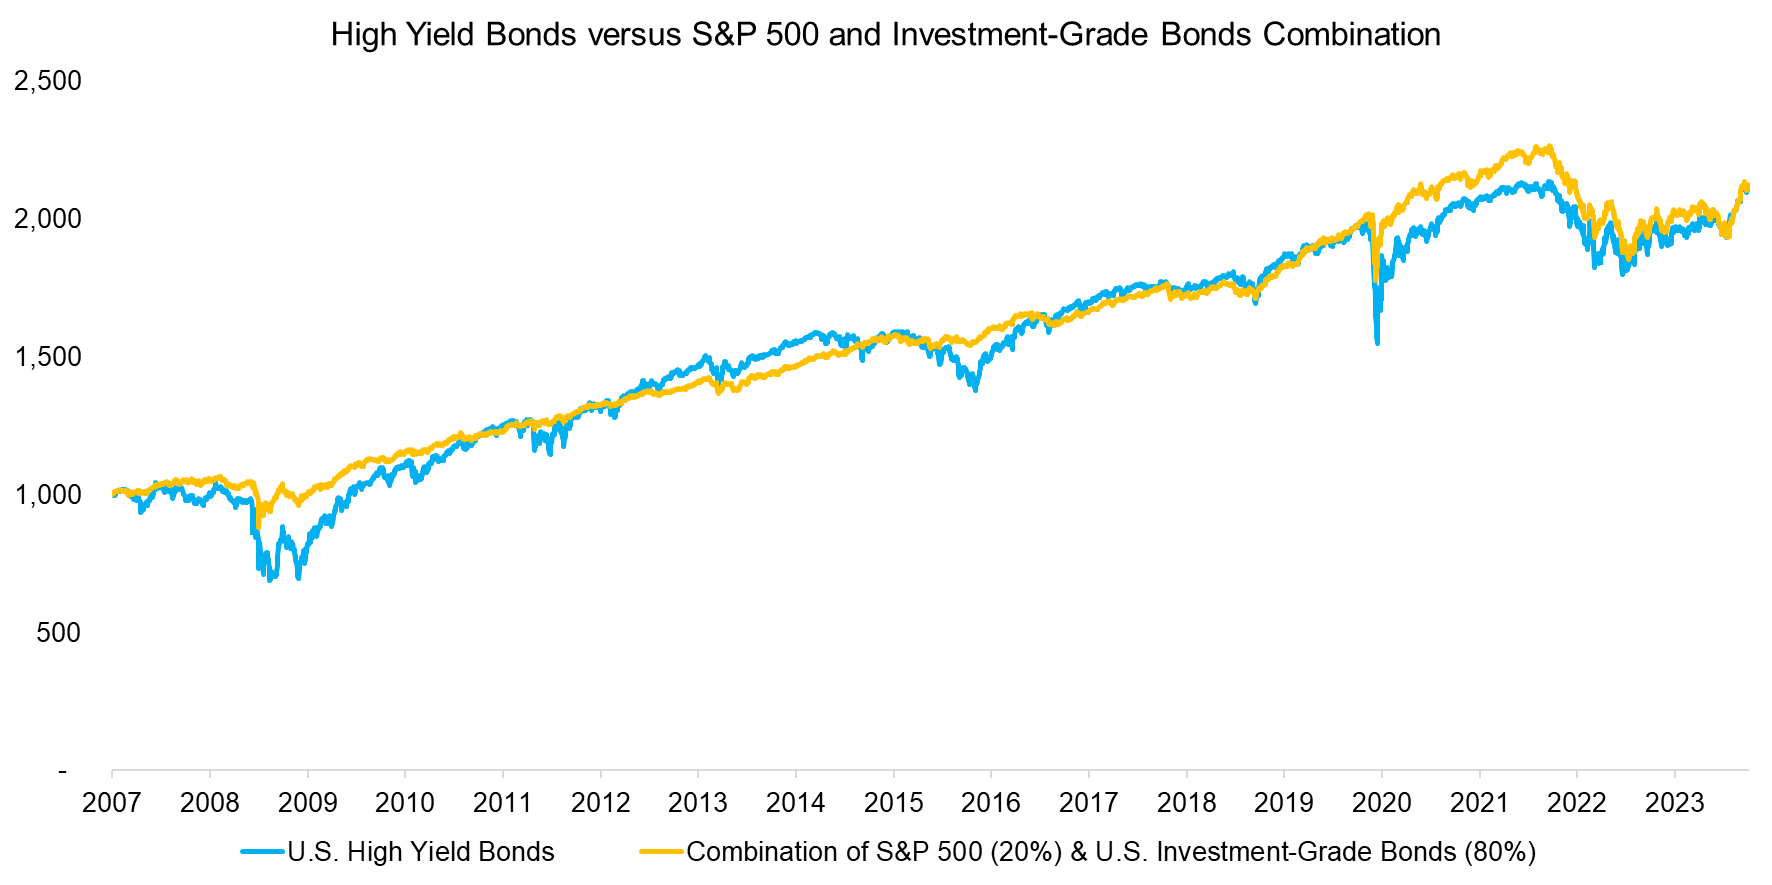
We create such a combination portfolio by targeting the same total return of high yield bonds over the last 15 years, which was 4.6% per annum. We observe that a portfolio with a 20% allocation to stocks and 80% to bonds would have approximately provided performance, although its drawdowns during the global financial crisis in 2009 and COVID-19 crisis in 2020 were much less severe.

Source: Finominal
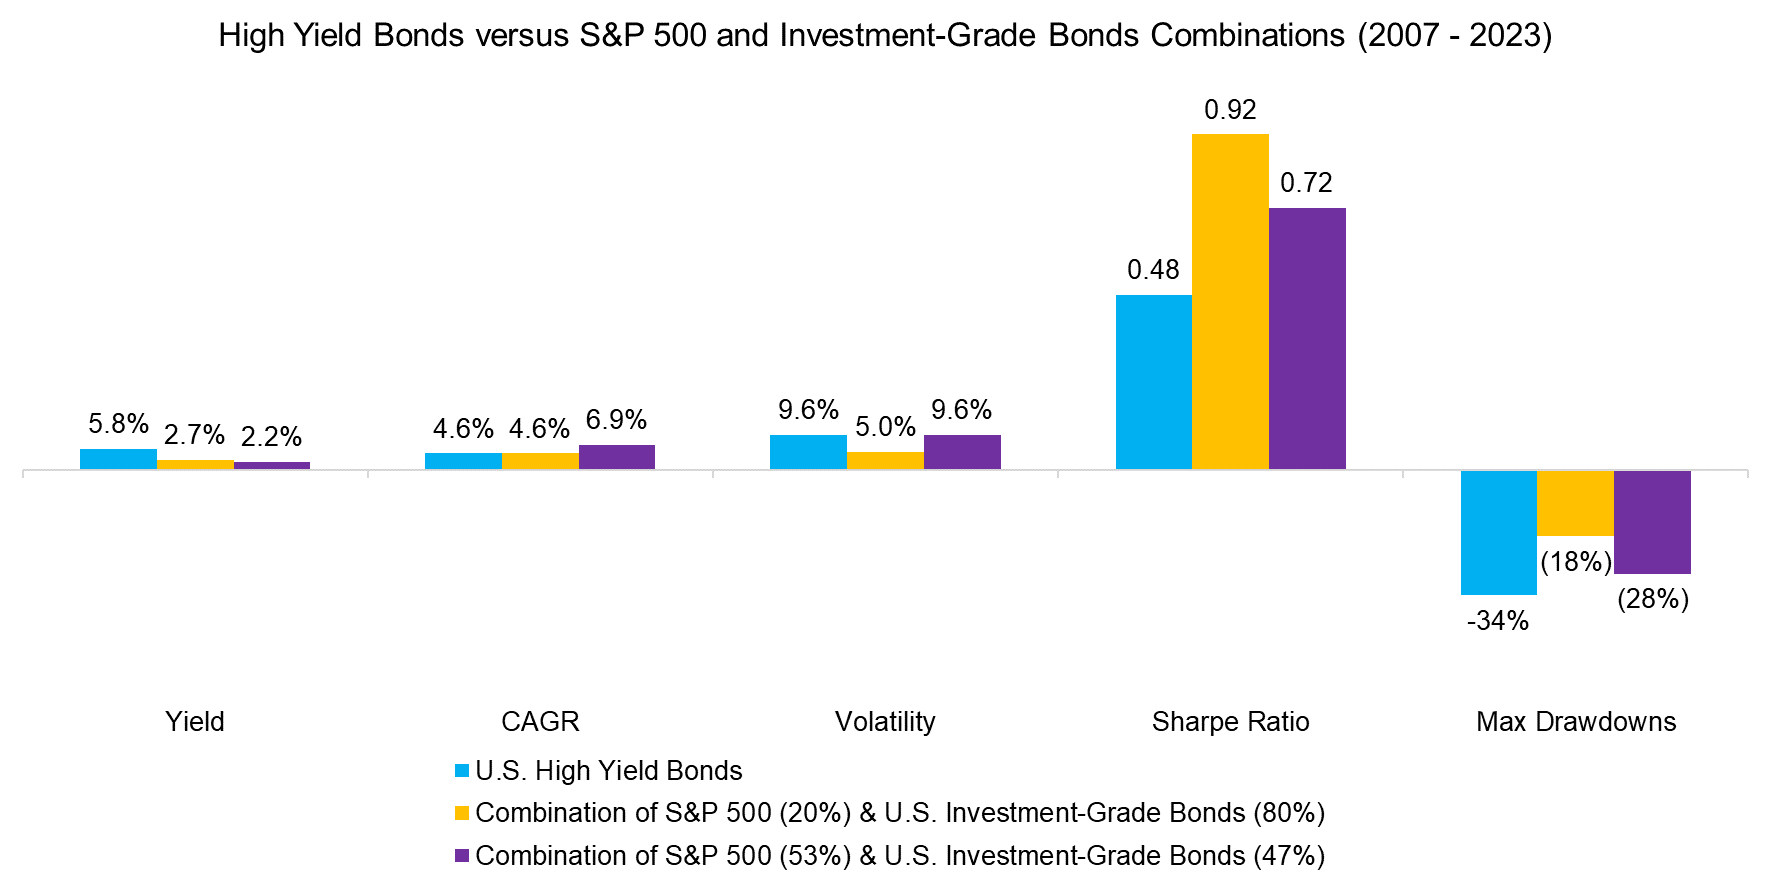
Finally, we compare high yield bonds versus two equity-debt combination portfolios: one that has the same CAGR (4.6%), and another one that has the same volatility (9.6%) as high yield bonds. As expected, high yield bonds feature a higher yield, but also a significantly lower Sharpe ratio and higher maximum drawdown than the two combination portfolios.

Source: Finominal
FURTHER THOUGHTS
Based on this analysis, it seems that high yield bonds can be simply replicated by combining the S&P 500 and U.S. investment-grade bonds. Given that high yield bonds generated a lower risk-adjusted return than such combinations over the last 15 years indicates that the yields offered by issuers were too low for the associated risks.
Unfortunately, this holds for most high yielding instruments like CLOs, convertible bonds, preferreds, and business development companies. Investors continuously seek higher yields while ignoring that they likely lose out on the return of capital.
As we pointed out before, investors can create synthetic dividends by simply selling parts of their portfolio, which does not necessarily lead to a lower total return and is more favorable on a post-tax basis (read Do-It-Yourself High-Dividend Strategies).
RELATED RESEARCH
Do-It-Yourself High-Dividend Strategies
A Crescendo in Private Credit?
CLOs – Diversifier, or another Equity Clone?
Don’t Convert to Convertible Bonds
BDCs: Better Don’t Choose?
Covered Call Strategies Uncovered
Preferential Times for Preferred Income Strategies?
Analyzing Floating Rate ETFs
The Case Against REITs
The Case Against Equity Income Funds
Resist the Siren Call of High Dividend Yields
Building Better High Yield Portfolios
ABOUT THE AUTHOR
Nicolas Rabener is the CEO & Founder of Finominal, which empowers professional investors with data, technology, and research insights to improve their investment outcomes. Previously he created Jackdaw Capital, an award-winning quantitative hedge fund. Before that Nicolas worked at GIC and Citigroup in London and New York. Nicolas holds a Master of Finance from HHL Leipzig Graduate School of Management, is a CAIA charter holder, and enjoys endurance sports (Ironman & 100km Ultramarathon).
Connect with me on LinkedIn or X.

