Absolute versus Relative Momentum Across Asset Classes
Is the trend your friend?
February 2024. Reading Time: 10 Minutes. Author: Nicolas Rabener.
SUMMARY
- Absolute and relative momentum can be used as simple asset allocation frameworks
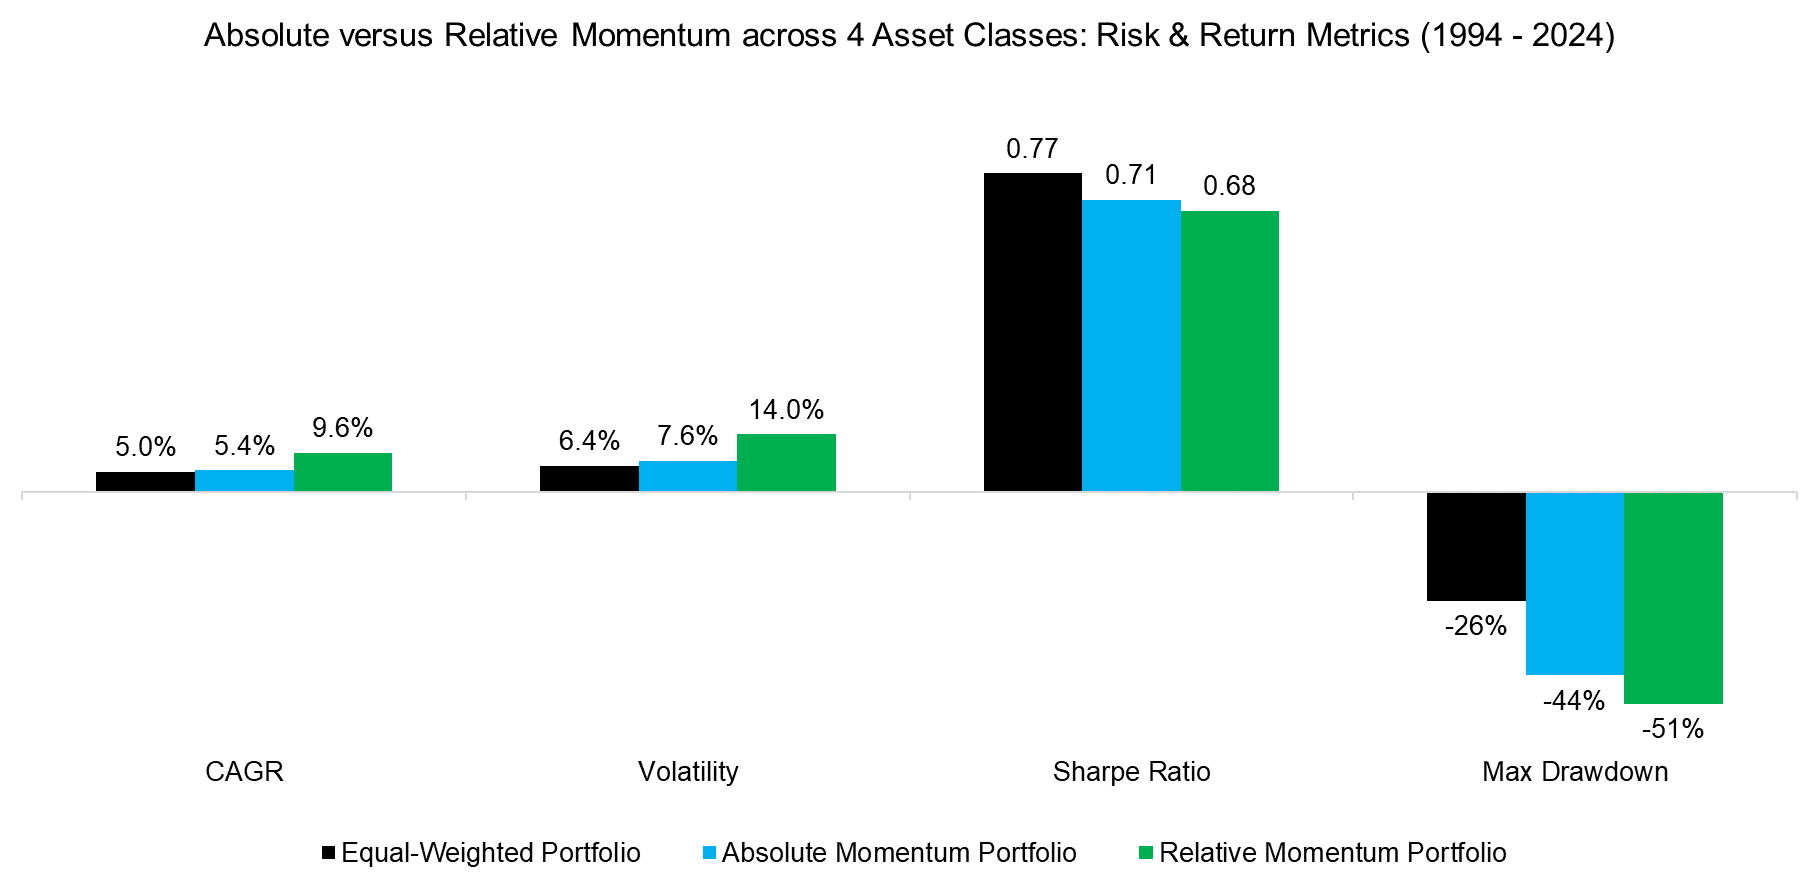
- Both would have generated a higher return than an equal-weighted portfolio across asset classes
- However, risk-adjusted returns were lower and drawdowns higher
INTRODUCTION
Investing is often overwhelming given the enormous number of strategies and asset classes that are available to investors. Deciding on how to allocate to equities is already challenging, eg investors need to decide on U.S. versus international and emerging market exposures, sector versus factor-based allocations, active versus passive funds, and so on.
But how about currencies or commodities? Although there are plenty of experts within those markets who offer advice on what to buy, most of these struggle to predict these markets accurately.
A simple way to reduce the complexity of asset allocation is to use a trend following model. This approach essentially abolishes the need for specialist knowledge as it uses the same buying and selling rules for all assets. There are various ways to implement such a momentum-based framework and trend following funds, which are also called managed futures or CTAs, typically pursue this across as many asset classes as possible and take long as well as short positions (read Creating a CTA from Scratch – II and Replicating a CTA via Factor Exposures).
However, we can also create a simpler version by only going long the four major asset classes, namely equities, bonds, currencies, and commodities. We can measure trends on an absolute basis, where we require positive performance, or a relative basis, where we only select the best-performing asset class.
In this research article, we will contrast absolute versus relative momentum across the major asset classes.
ABSOLUTE VERSUS RELATIVE MOMENTUM
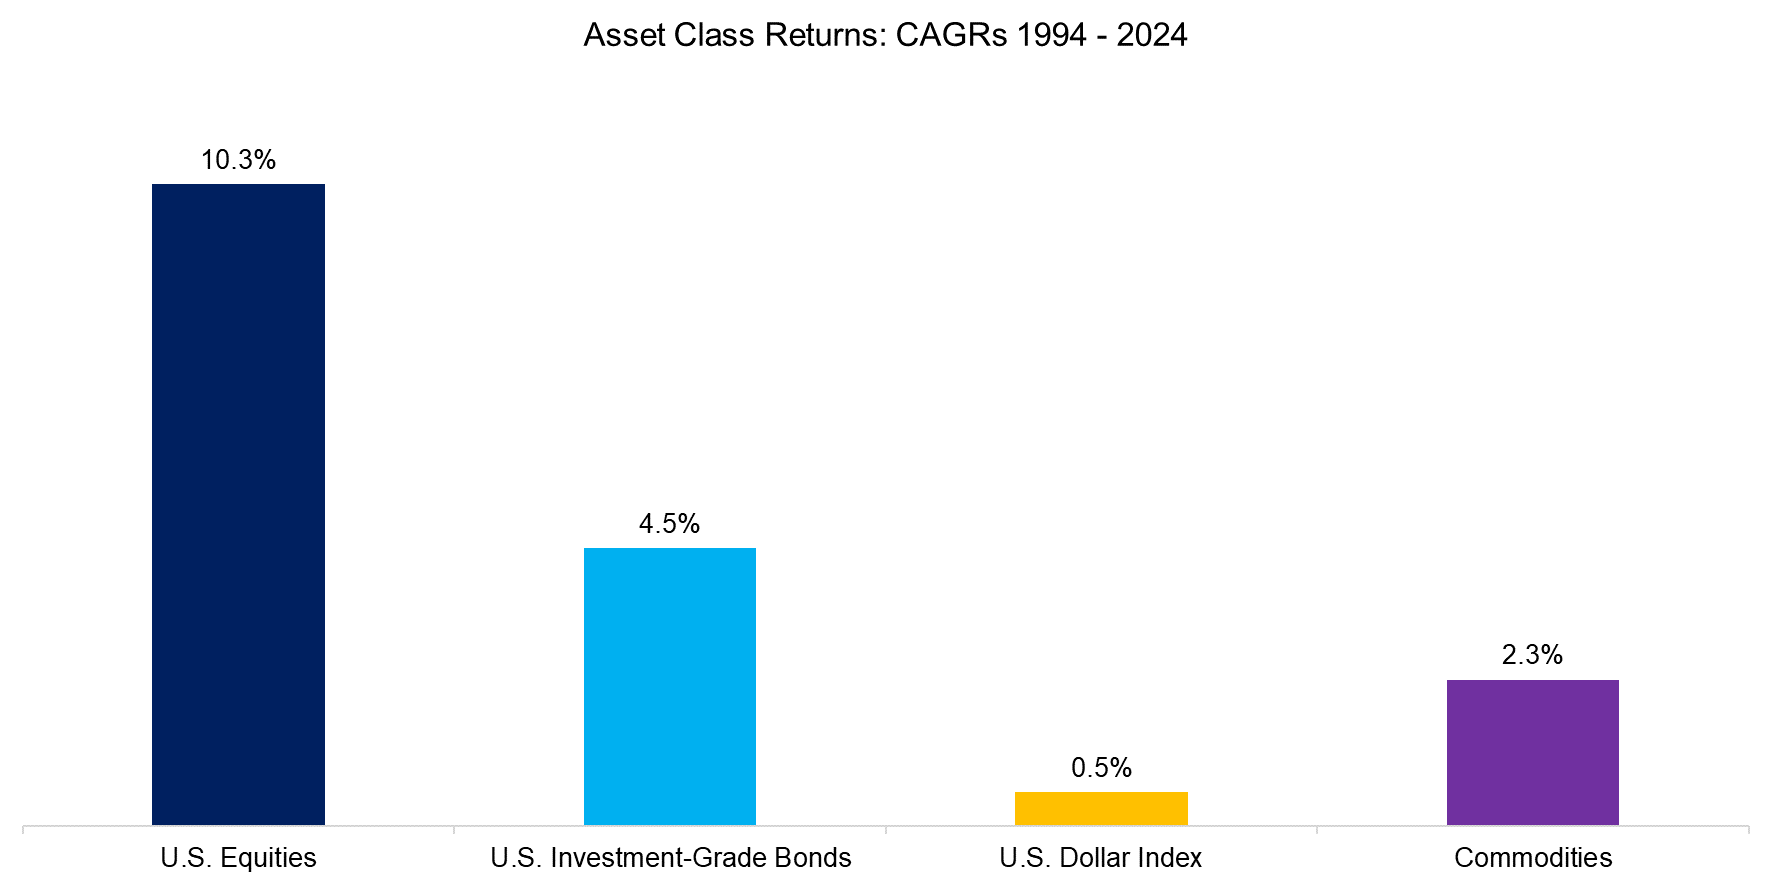
We define absolute momentum as a positive total return over the last 12 months, compared to the best performance over the last 12 months for relative momentum. It is worth highlighting that the annual returns of the four asset classes differed significantly over the last 30 years, with U.S. equities generating an attractive 10.3% CAGR versus a mediocre 0.5% for the U.S. Dollar Index.
Source: Finominal
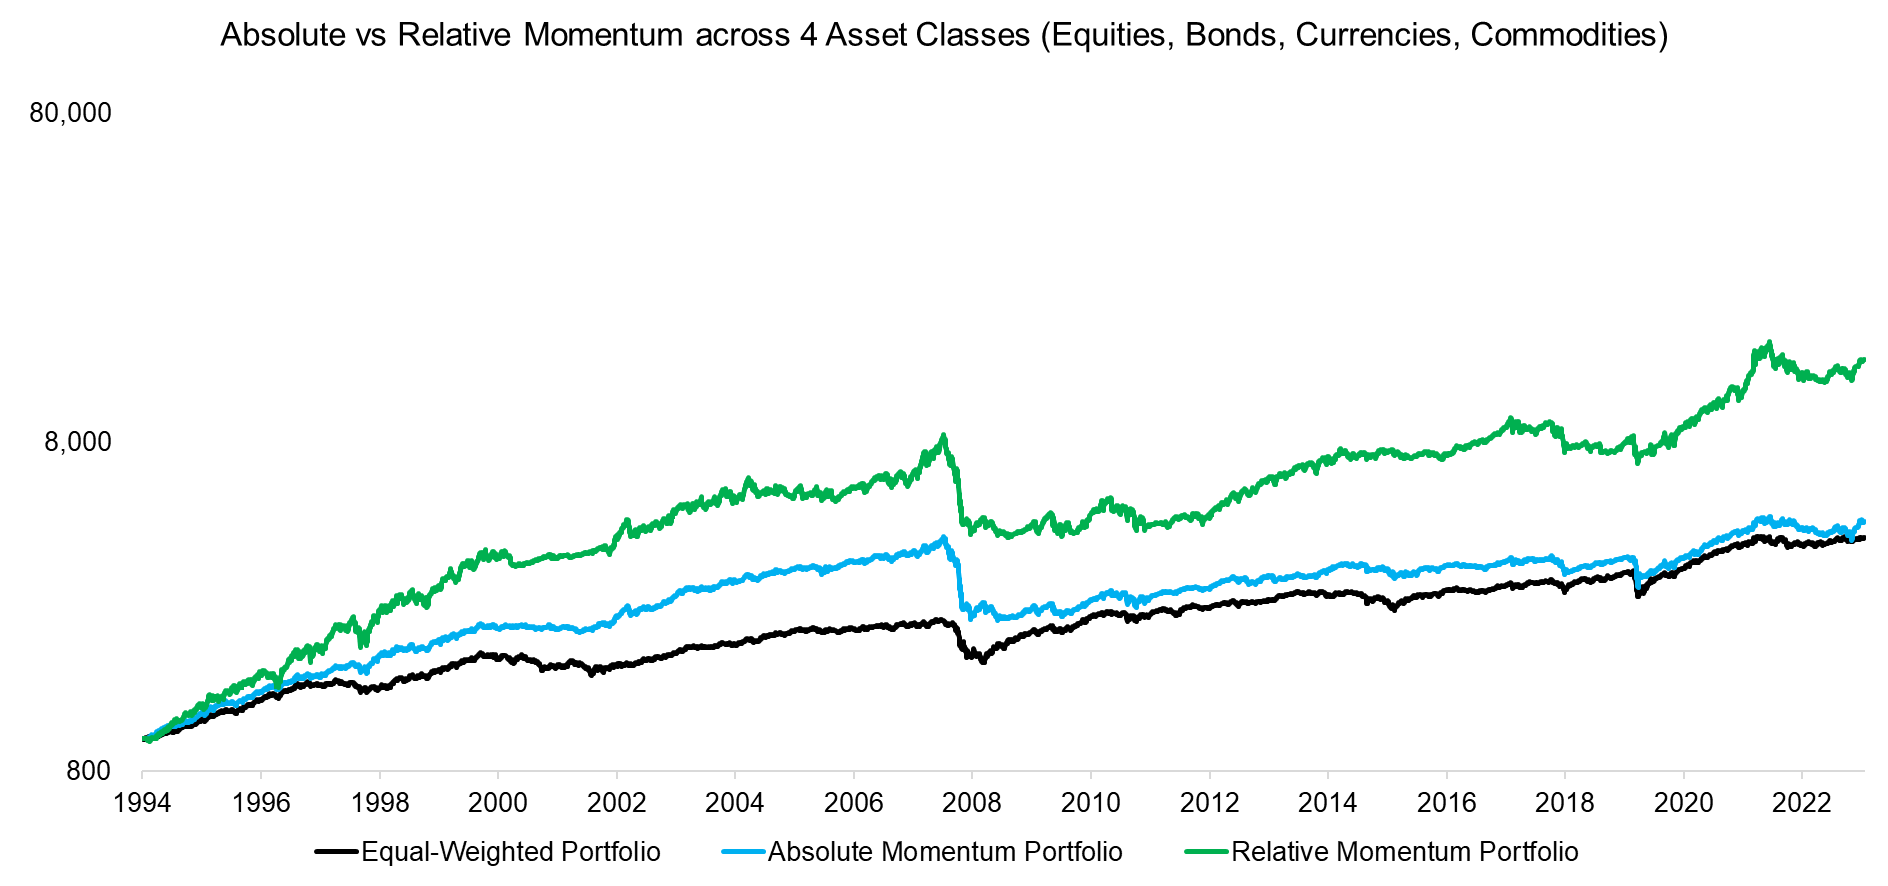
We create absolute and relative momentum portfolios using the 12-month performance of the four asset classes as well as an equal-weighted portfolio, where we rebalance the portfolios monthly. Transaction costs are ignored, but there are only a few transactions per annum and these asset classes can be traded at low costs via futures.
We observe that relative momentum performed best over the period from 1994 to 2024, while the equal-weighted portfolio performed worst. The exposure to equities can clearly be seen in years 2009, when all three portfolios had significant drawdowns (read Trend Following in Equities).
Source: Finominal
ABSOLUTE MOMENTUM: BREAKDOWN BY ASSET CLASSES
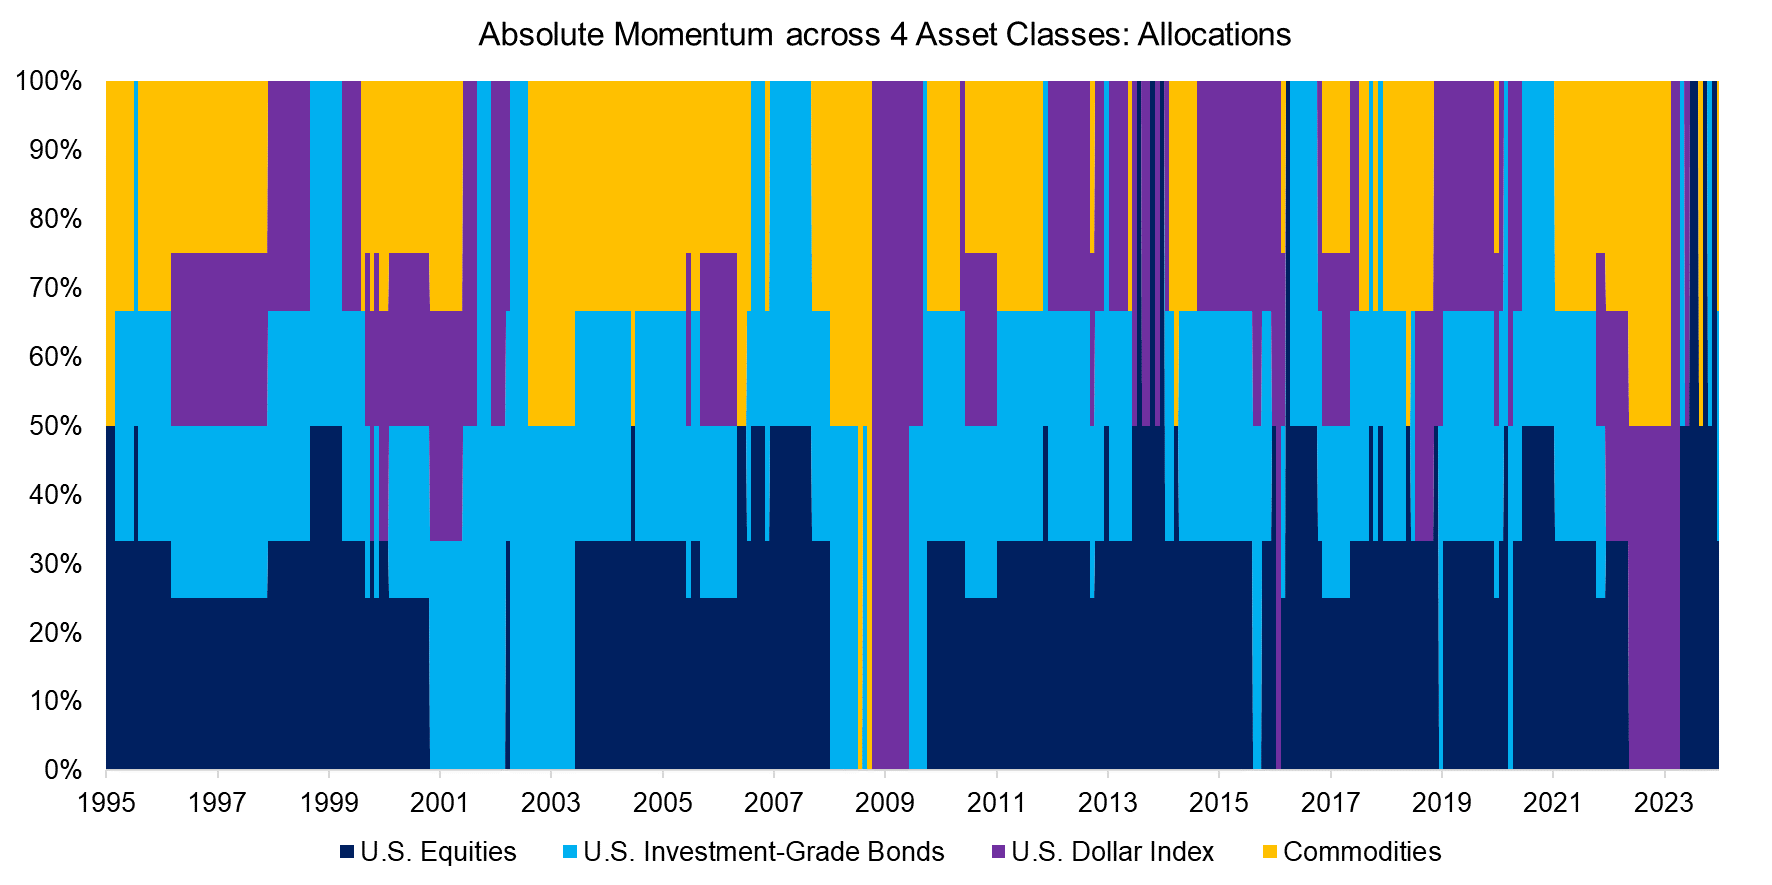
To get a better understanding of the strategies, we review a breakdown by asset classes. The average allocation to equities within absolute momentum was 30% across the 30 years, compared to 31% to bonds, 19% to currencies, and 20% to commodities. Overall, it seems that absolute momentum has led to a diversified portfolio.
Source: Finominal
RELATIVE MOMENTUM: BREAKDOWN BY ASSET CLASSES
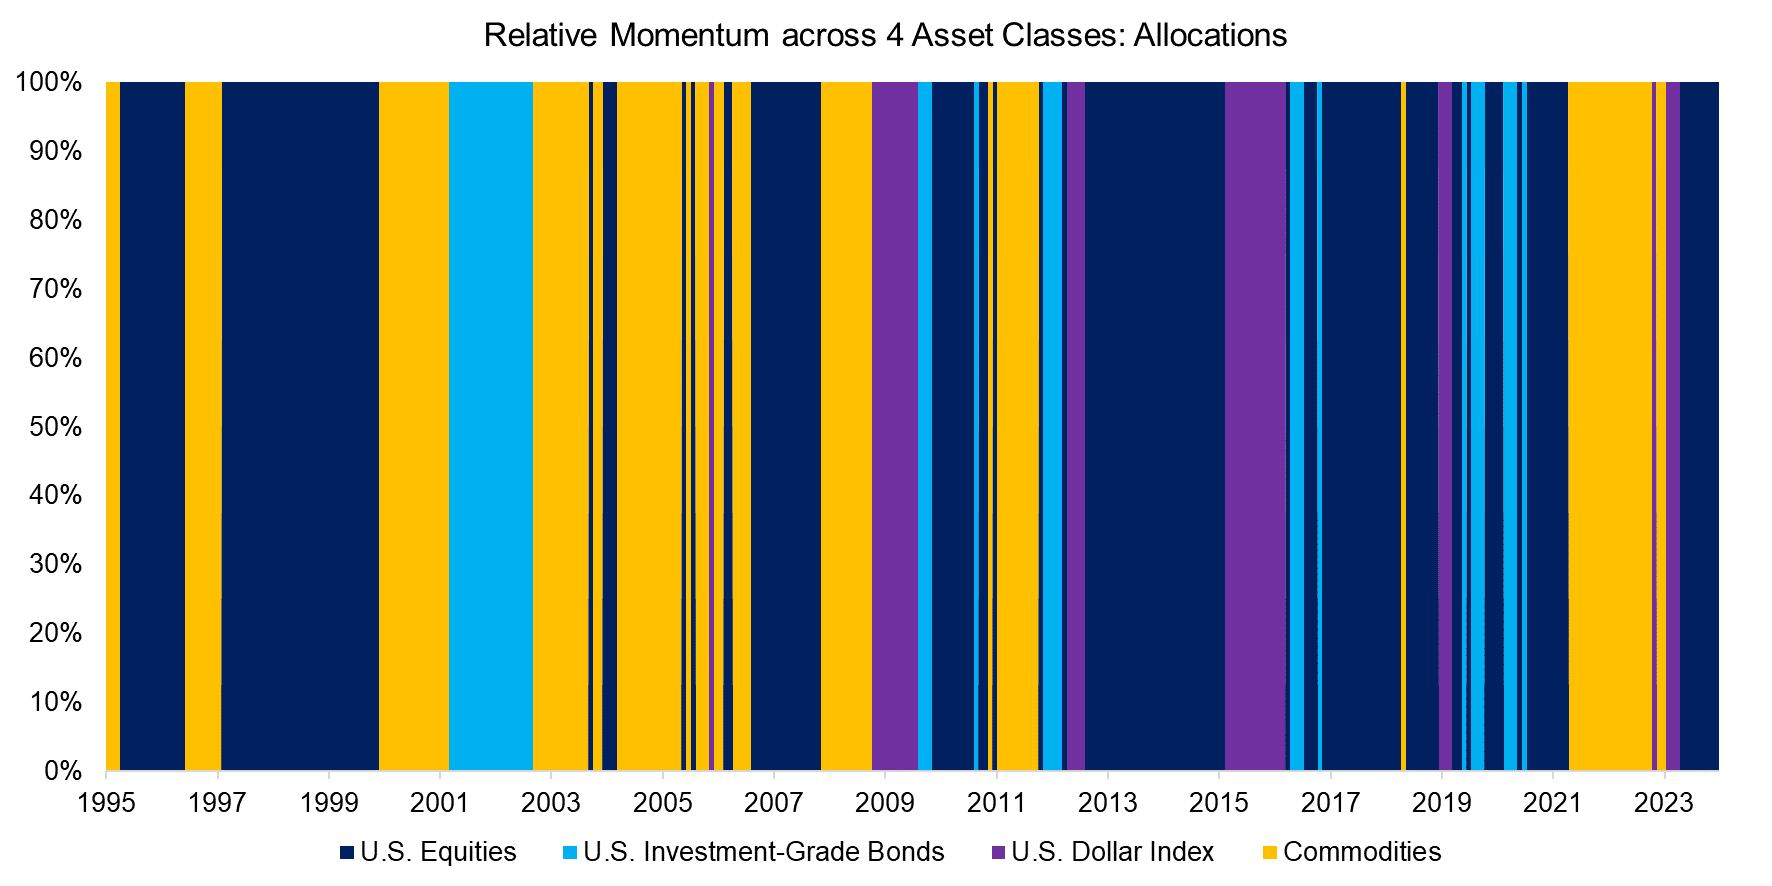
Reviewing the breakdown by assets classes of the relative momentum portfolio highlights that bonds only featured a minor role. Given that the asset class was in a bull market since the 1980s this may be surprising, but the absolute returns of bonds were rarely large in magnitude. In contrast, the CAGR of commodities since 1994 was only 2.4%, but this includes multiple bull markets where the asset class had plenty of double-digit 12-month returns. Naturally returns could be adjusted for their volatility, which would then increase the allocation to bonds over time.
Source: Finominal
RISK VERSUS RETURN METRICS
Finally, we show the risk and returns metrics for the three portfolios, which highlight that relative momentum generated the highest annual return, but also featured the highest volatility and largest maximum drawdown over the last 30 years. Somewhat ironically, the simplest portfolio, ie the equal-weighted one, produced the highest Sharpe ratio.
Source: Finominal
FURTHER THOUGHTS
Although this analysis shows that applying a trend following methodology across these four asset classes did not generate superior risk-adjusted returns compared to a simple equal-weighted portfolio, this may be different going forward. Both equities and fixed income largely represented bull markets since 1994, and stocks and bonds featured low correlations, therefore generating significant diversification benefits.
The forward returns for equities and bonds are likely far less attractive than over the last 30 years given high valuations, lower economic growth due to poor demographics, and record levels of debt (read Aging & Equities: Selling Stocks for the Long-Term). Given this, a momentum-based asset allocation framework is likely to generate better risk-adjusted returns than an equal-weight allocation. As per the mantra of the CTA industry, let the trend be your friend.
RELATED RESEARCH
Trend Following in Bear Markets
Trend Following in Equities
Diversification versus Hedging
Hedging Market Crashes with Factor Exposure
Hedging via Managed Futures Liquid Alts
Replicating a CTA via Factor Exposures
Creating a CTA from Scratch – II
Market Timing with Multiples, Momentum & Volatility
REFERENCED RESEARCH
A Century of Evidence on Trend-Following Investing, AQR, 2017
Two Centuries of Trend Following, Capital Fund Management, 2014
ABOUT THE AUTHOR
Nicolas Rabener is the CEO & Founder of Finominal, which empowers professional investors with data, technology, and research insights to improve their investment outcomes. Previously he created Jackdaw Capital, an award-winning quantitative hedge fund. Before that Nicolas worked at GIC and Citigroup in London and New York. Nicolas holds a Master of Finance from HHL Leipzig Graduate School of Management, is a CAIA charter holder, and enjoys endurance sports (Ironman & 100km Ultramarathon).
Connect with me on LinkedIn or X.

