Value vs Quality: More Correlated than Ever?
Why?
March 2024. Reading Time: 10 Minutes. Author: Nicolas Rabener.
SUMMARY
- P/E and ROE long-short factors have become highly correlated
- During certain periods investors favor expensive and unprofitable stocks
- However, it is difficult explaining the positive correlation outside of bubbles
INTRODUCTION
The older I get, the less I seem to know for certain about investing. The confidence in my knowledge has been steadily eroded over the years and much of the curriculum taught at university has been discarded. CAPM – taxes are real and investors are not rational. WACC – use 10% instead, regardless of the capital structure and industry. Higher risk equates to higher returns – not when considering low-volatility stocks.
It is frustrating to learn that investing is more gray than black and white. I long for a solid framework, but instead am dealing with a house with wandering rooms in an earthquake zone.
Most recently I was surprised to see that the price-to-earnings and return-on-equity factors are highly positively correlated.
C’mon! This can’t be correct, which we will hopefully disprove in this research article.
CORRELATION OF LONG-SHORT VALUE & QUALITY FACTORS
We use long-term data from Jensen, Kelly, and Pedersen (JKP) that is publicly available via the Global Factor Data website. The database is a great resource as it provides the time series for more than 100 factors for 93 countries with different weighting schemes, which is a delight for financial researchers.
We focus on seven value and five quality metrics in the U.S. stock market, where we calculate the correlations of these using daily returns of capped value weighted, long-short indices from 1951 to 2022. We observe that broadly speaking the value metrics are more positively correlated than the quality metrics, which is expected as enterprise value (EV)-to-EBITDA is closer related to price-to-earnings (P/E) than debt-to-equity to earnings volatility (read Quality Factor: How To Define It?).
However, we also observe that P/E features a 0.61 correlation to return-on-equity (ROE), which is counterintuitive. The P/E factor is calculated by buying stocks with cheap P/E and selling stocks with high P/E ratios, while the ROE factor buys highly profitable and shorts lowly or unprofitable stocks. Cheap companies should feature low profitability, and expensive ones high profitability, so how can these two factors be positively correlated?

Source: Global Factor Data, Finominal
PERFORMANCE OF P/E AND ROE FACTORS
We could look at the fundamentals of actual products like Vanguard’s Value Index Fund (VTV) and Growth Index Fund (VUG), which have almost no overlap in terms of portfolios as VTV tracks cheap and VUG growth stocks with large market capitalizations. VTV’s median P/E ratio is 19.8x and features a profit margin of 16%, compared to VUG’s P/E ratio of 36.1x and 23% profit margin.
Based on this, the world seems in order as cheap companies are less profitable than expensive ones.
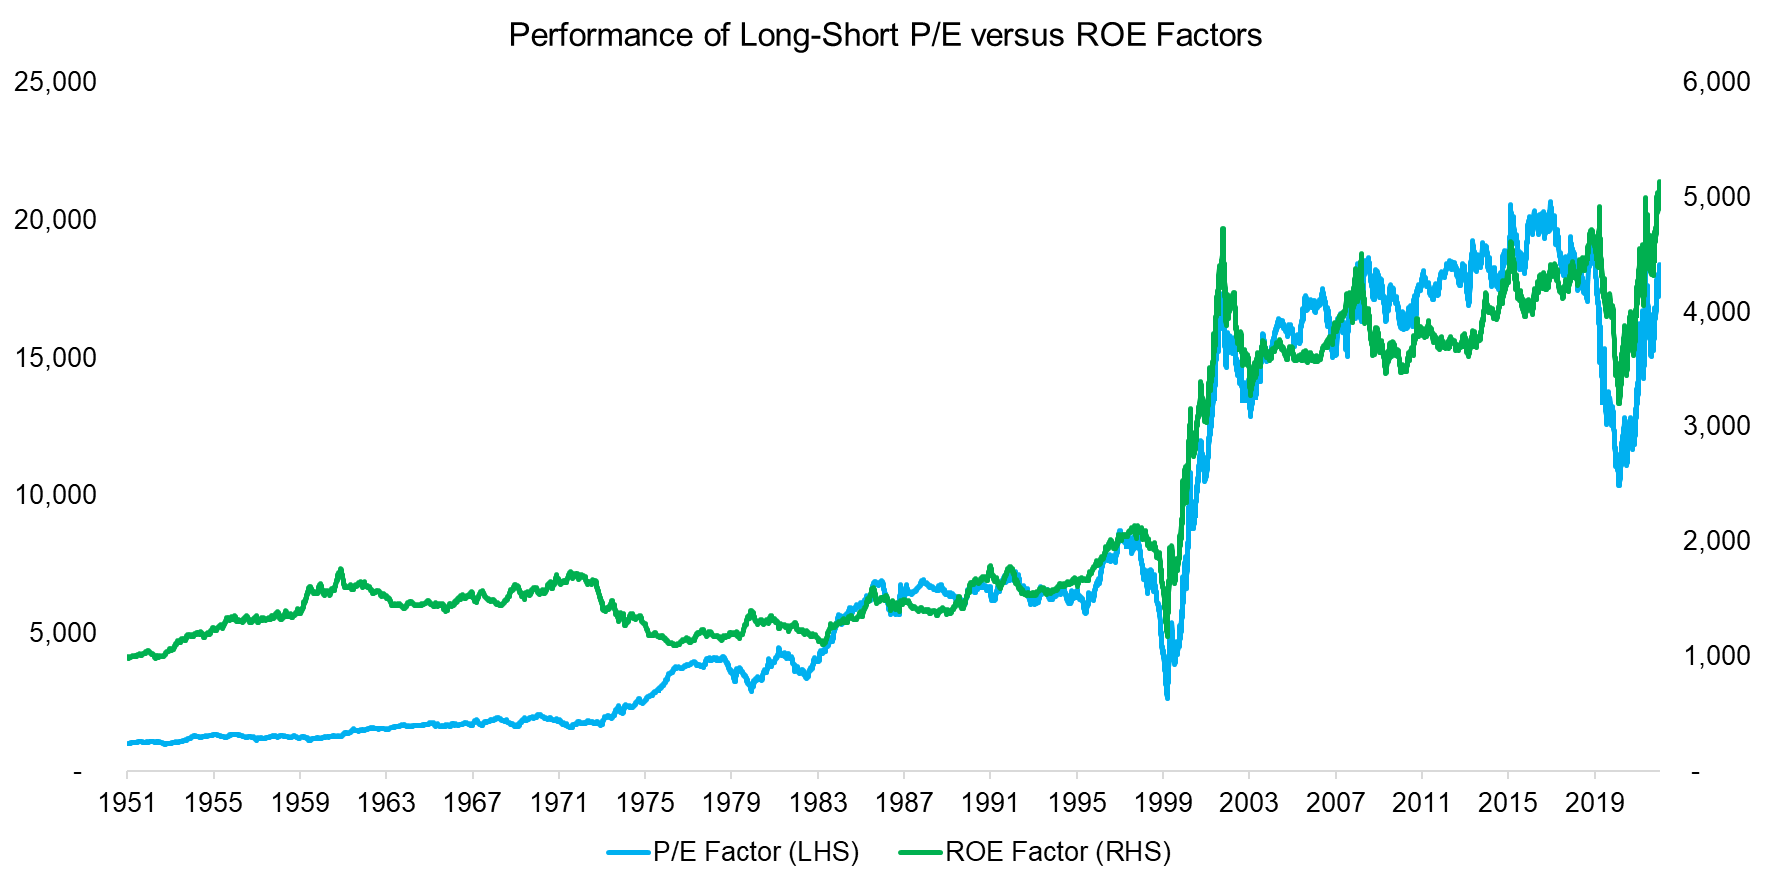
However, plotting the performance of the long-short factors highlights that the P/E and ROE factors were negatively correlated between 1951 and 1991, but positively thereafter, and especially during the tech bubble in 2000 and post-COVID-period in 2021.
Source: Global Factor Data, Finominal
CORRELATION OF LONG-SHORT P/E & ROE FACTORS
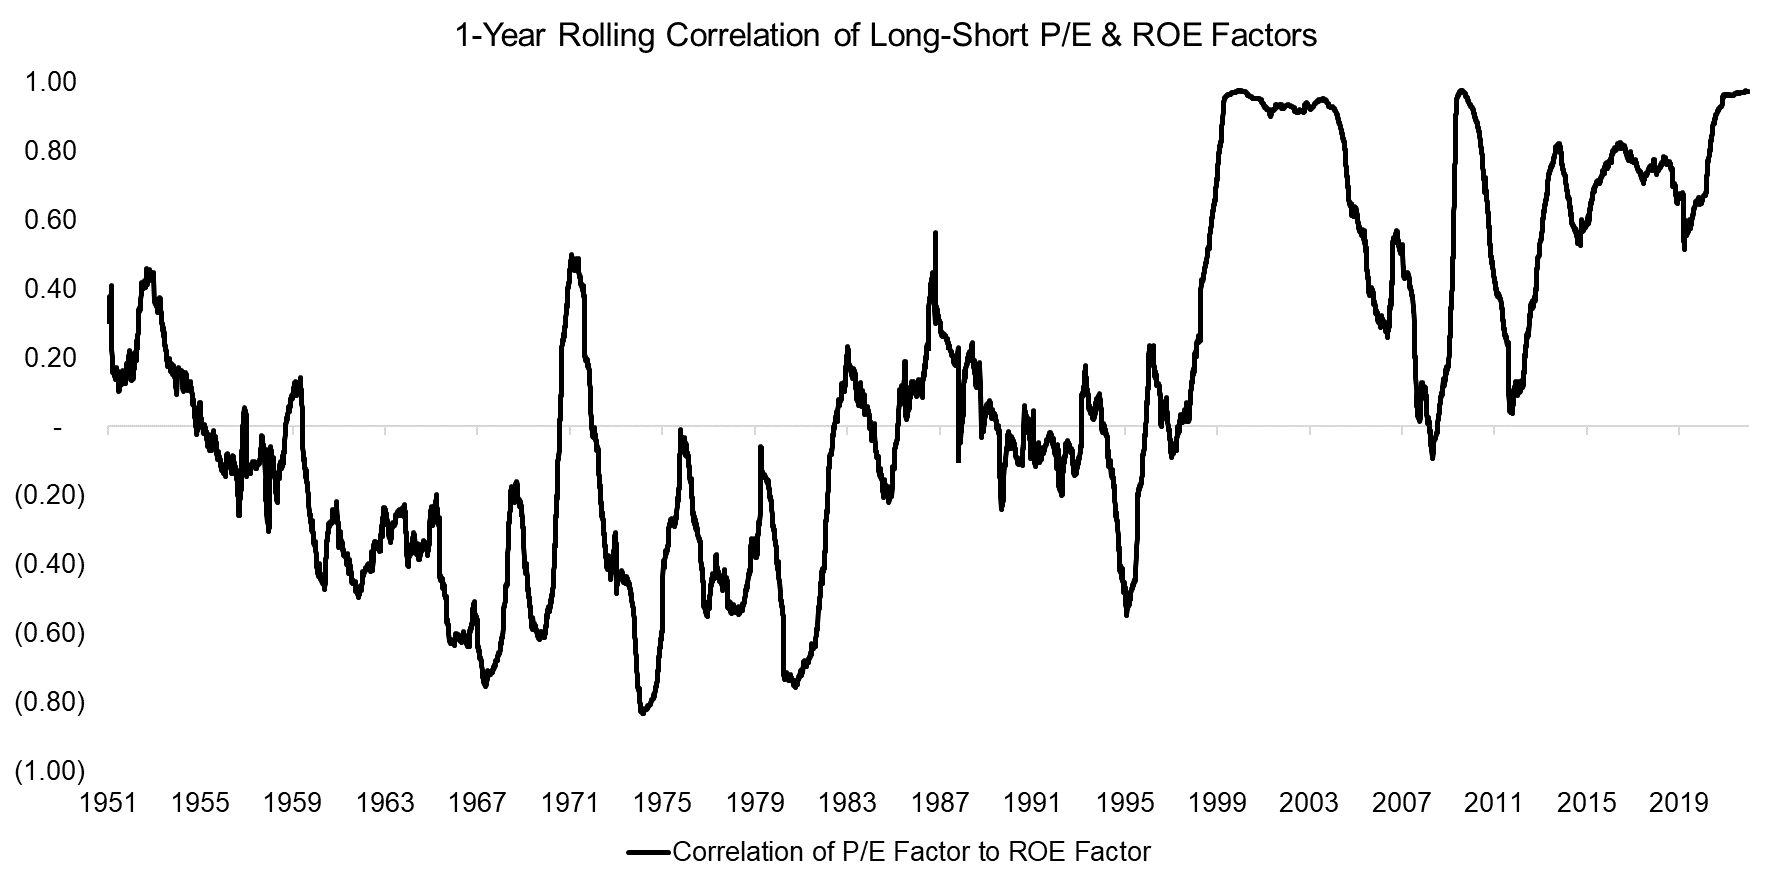
Next, we show the one-year rolling correlation that confirms the relationship of P/E and ROE factors has changed from negative to positive over the 70-year lookback period.
Source: Global Factor Data, Finominal
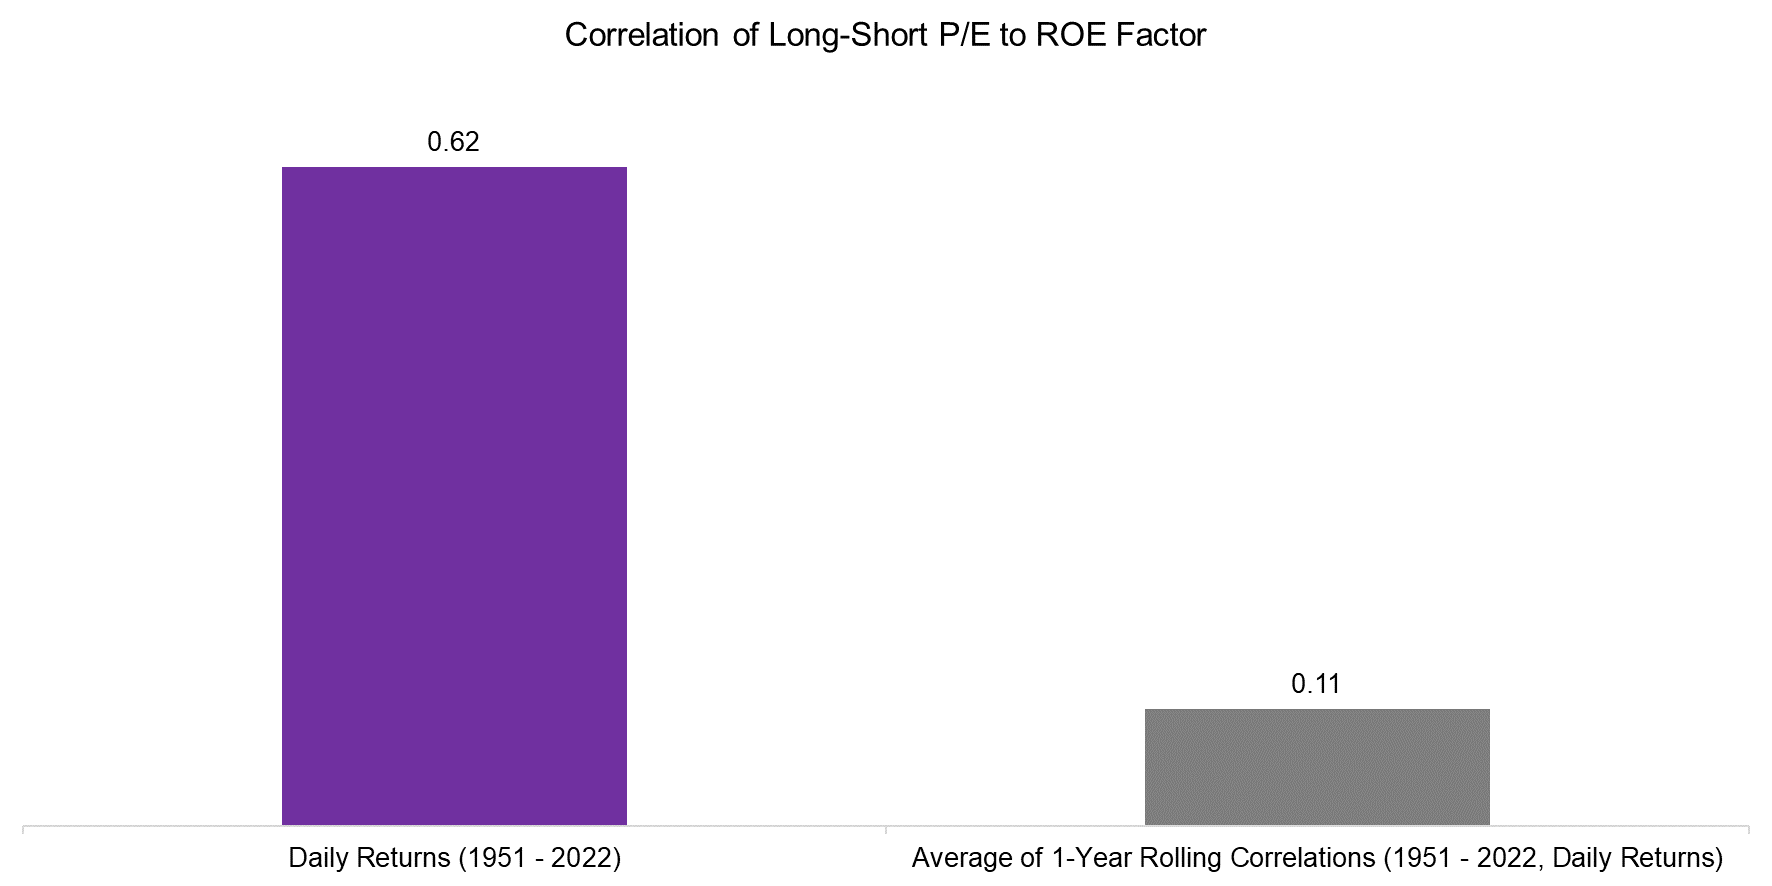
The 1-year rolling correlation chart seems to indicate that the correlation was zero on average given that it was negative and positive for approximately the same amount of decades. Indeed, if we calculate the average correlation across the 1-year rolling correlation we derive 0.11, but this conflicts with the 0.62 if we calculate the correlation across the entire period. In both calculations, the same daily returns for the same period between 1951 and 2022 were used, so how come these correlations are so different?
We can explain this by the correlation computation being impacted by the magnitude of returns, which were much larger when the correlation was positive than negative. Naturally, this highlights the fickle nature of correlations.
Source: Global Factor Data, Finominal
CHANGING THE DATA SET
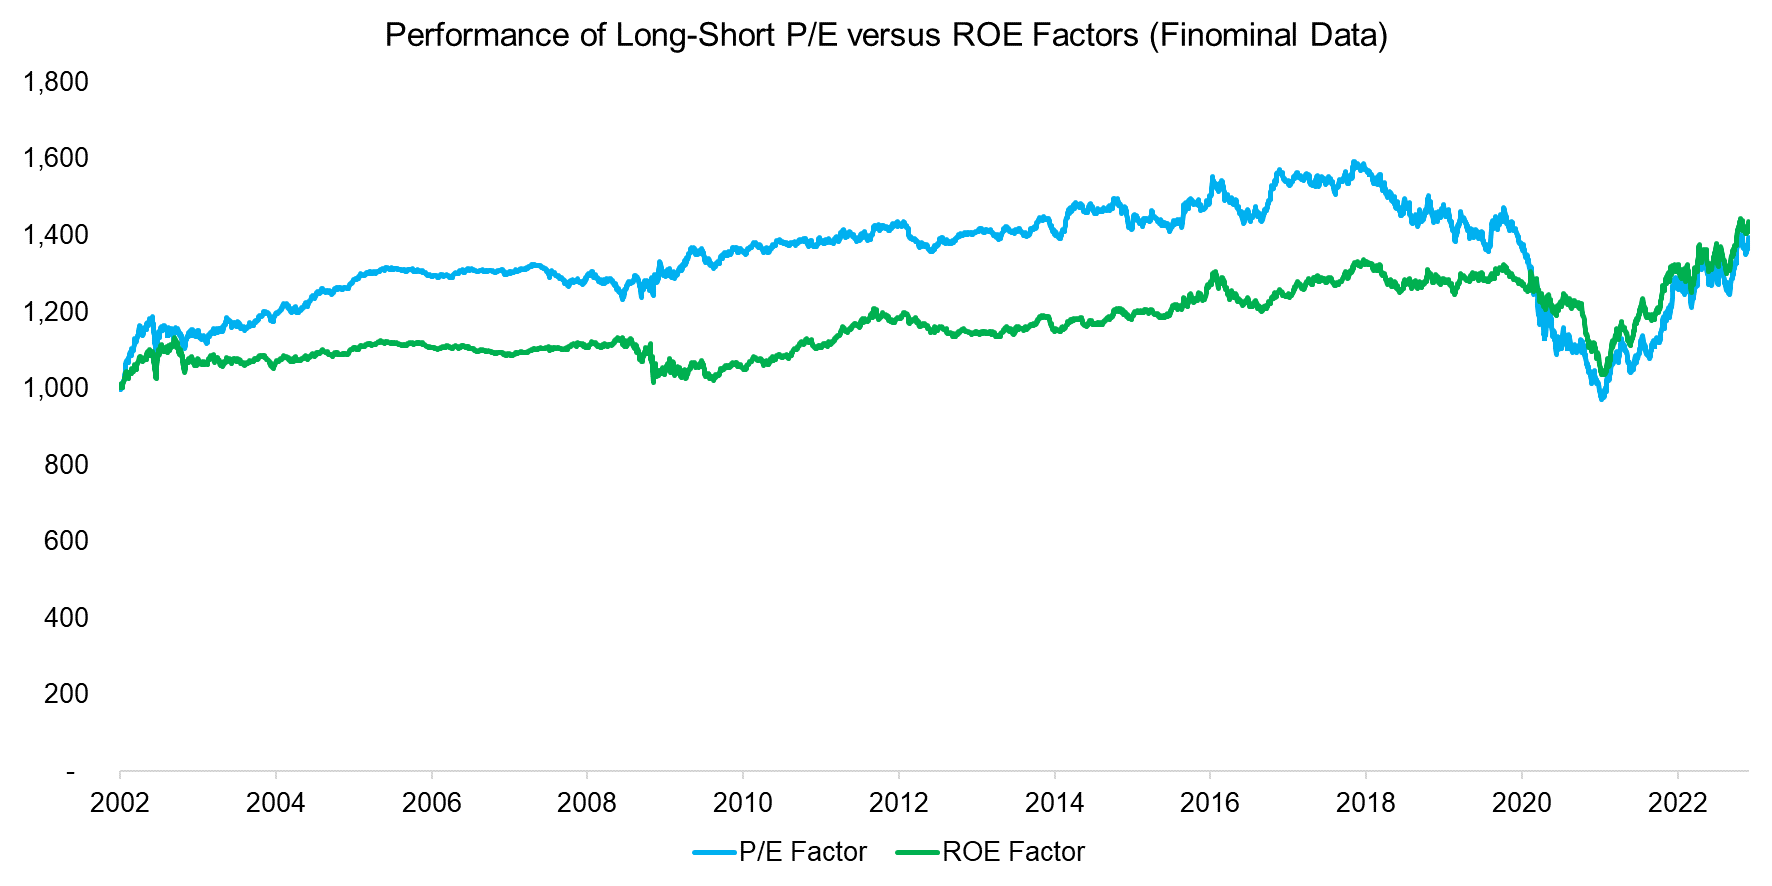
Given that the positive correlation between P/E and ROE factors seems counterintuitive from a fundamental perspective, it might be that the data from Global Factor Data is simply incorrect. However, using our own data sets we recreate the long-short P/E and ROE factors for the period between 2022 and 2023, which also highlights similar trends in performance.
Source: Finominal
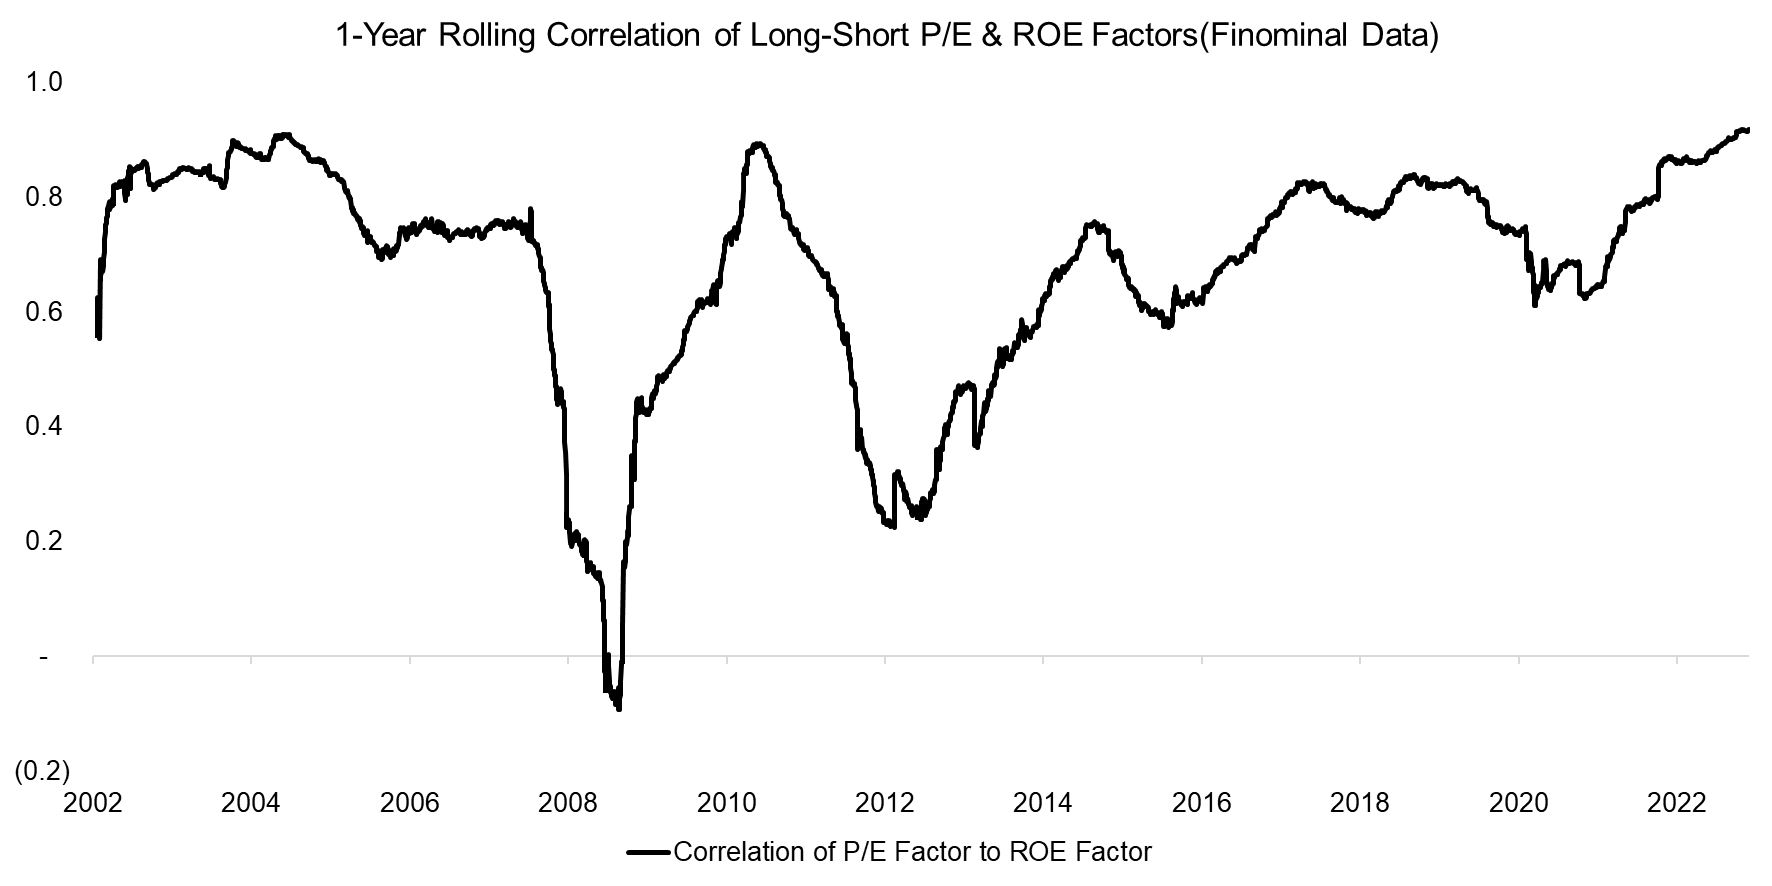
Calculating the 1-year rolling correlations using Finominal’s factors confirms that the P/E and ROE factors were highly correlated in the period between 2002 and 2022. How can we explain this?
It is difficult to come up with one explanation that explains a structural change, and we need to consider that factors are constructed from long and short portfolios, so there are multiple considerations.
However, we can explain positive correlations between cheap and profitable, as well as expensive and unprofitable stocks during certain periods in the last 20 years. There were two significant bubbles in technology stocks, namely in 2000 and 2021, where investors precisely preferred expensive and unprofitable stocks like Peloton over cheap and profitable businesses like Coca-Cola.
Source: Finominal
FURTHER THOUGHTS
Investing is risky as there are no hard laws like in physics and mental frameworks constantly need to be revised. Think U.S. Treasuries are safe investments? Not if you measure their performance in real returns, where government bonds can experience drawdowns that are as large as those of stock markets (read How Much Can You Lose with Bonds?).
Naturally, this is also what makes investing fascinating and a never-ending learning journey.
RELATED RESEARCH
Oh, Quality, Where Art Thou?
Picking Profitable Companies Can Be Unprofitable
Quality Factor: Zero Alpha for Most Investors
Value & Quality Factor Valuations
Beta in Beta-Neutral Factors?
REFERENCED DATA
ABOUT THE AUTHOR
Nicolas Rabener is the CEO & Founder of Finominal, which empowers professional investors with data, technology, and research insights to improve their investment outcomes. Previously he created Jackdaw Capital, an award-winning quantitative hedge fund. Before that Nicolas worked at GIC and Citigroup in London and New York. Nicolas holds a Master of Finance from HHL Leipzig Graduate School of Management, is a CAIA charter holder, and enjoys endurance sports (Ironman & 100km Ultramarathon).
Connect with me on LinkedIn or X.

