Factor Exposure Analysis 109: Linear vs Lasso vs Elastic Net
Finding the optimal regression method for factor exposure analysis
October 2024. Reading Time: 10 Minutes. Author: Abhik Roy, CFA.
SUMMARY
- Different regression techniques can be used to measure factor exposures
- Linear regression provides the best in-sample fit
- However, regularized models like Elastic Net and Lasso provide better out-of-sample fits in general
INTRODUCTION
Since the launch of the first U.S. ETF in 1993, which was the SPDR S&P 500 ETF, the industry has seen massive inflows into these ETFs with about $9 trillion in assets as of May 2024. Investors have a wide range of funds to choose from, some of which focus on equity factors like value or momentum. But this brings another challenge as measuring the exposure to these factors becomes pivotal to evaluating these funds.
One way to measure the exposures is through a regression-based analysis using the fund returns against a set of benchmark indices. But as often with quantitative methods, the choice of technique might lead to varying conclusions so, it becomes essential to explore the options available and understand the trade-offs and complexities with each.
In this research article, we compare regression methods to determine the optimal approach for factor exposure analysis.
IN-SAMPLE FIT
We will focus on three regression methods in this article – linear, Lasso, and Elastic Net. For readers unfamiliar with these methods, linear regression is the simplest form of regression where the objective is to minimize the squared residuals. Lasso regression introduces a regularization parameter that minimizes the absolute value of coefficients, while Elastic Net regression builds on Lasso by adding an additional regularization term which minimizes the square of coefficient values (read Factor Exposure Analysis 101: Linear vs Lasso Regression).
We take the example of iShares Morningstar Value ETF (ILCV) and perform a rolling regression using the daily fund returns and use four asset class indices for equities, bonds, commodities and currency. We also include five long-short factors, namely value, momentum, quality, low volatility, and size, with factor definitions in line with industry standards.
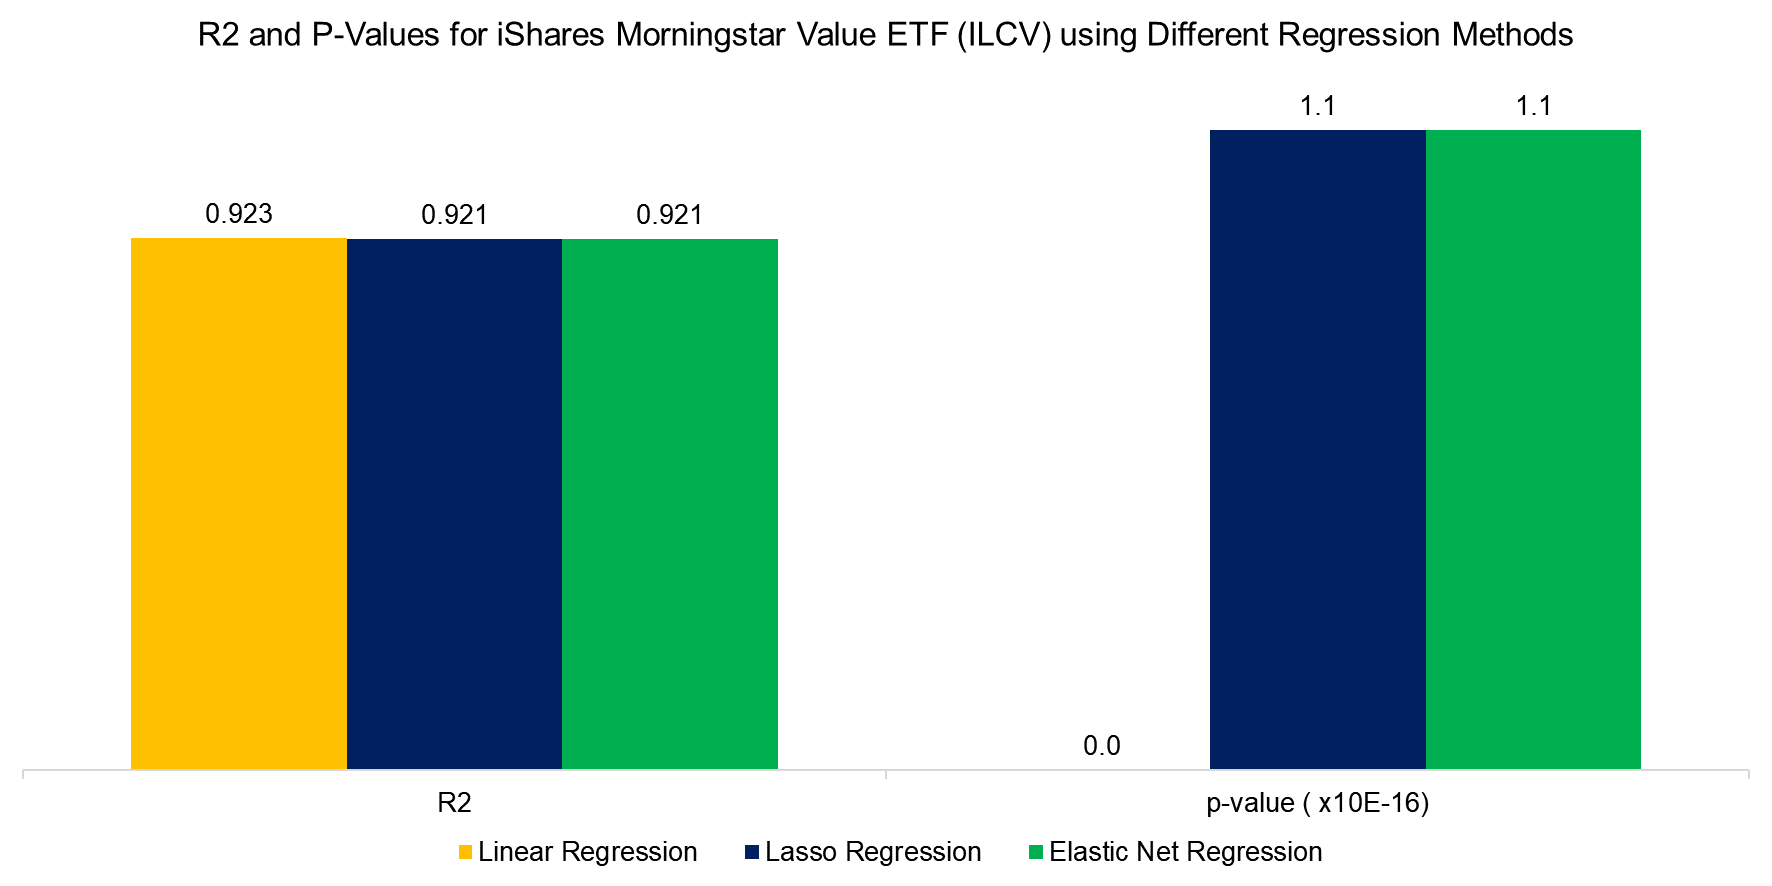
Looking at the R2 and p-values from the regressions, we find a slight decline in the R2 value for Lasso and Elastic Net regression when compared with linear regression, but that is expected as linear regression will provide the best in-sample fit. The p-value also increases for the regularized regression models but as they remain well below 1%, we will consider the betas statistically significant and disregard the p-values for the rest of the analysis.
Source: Finominal
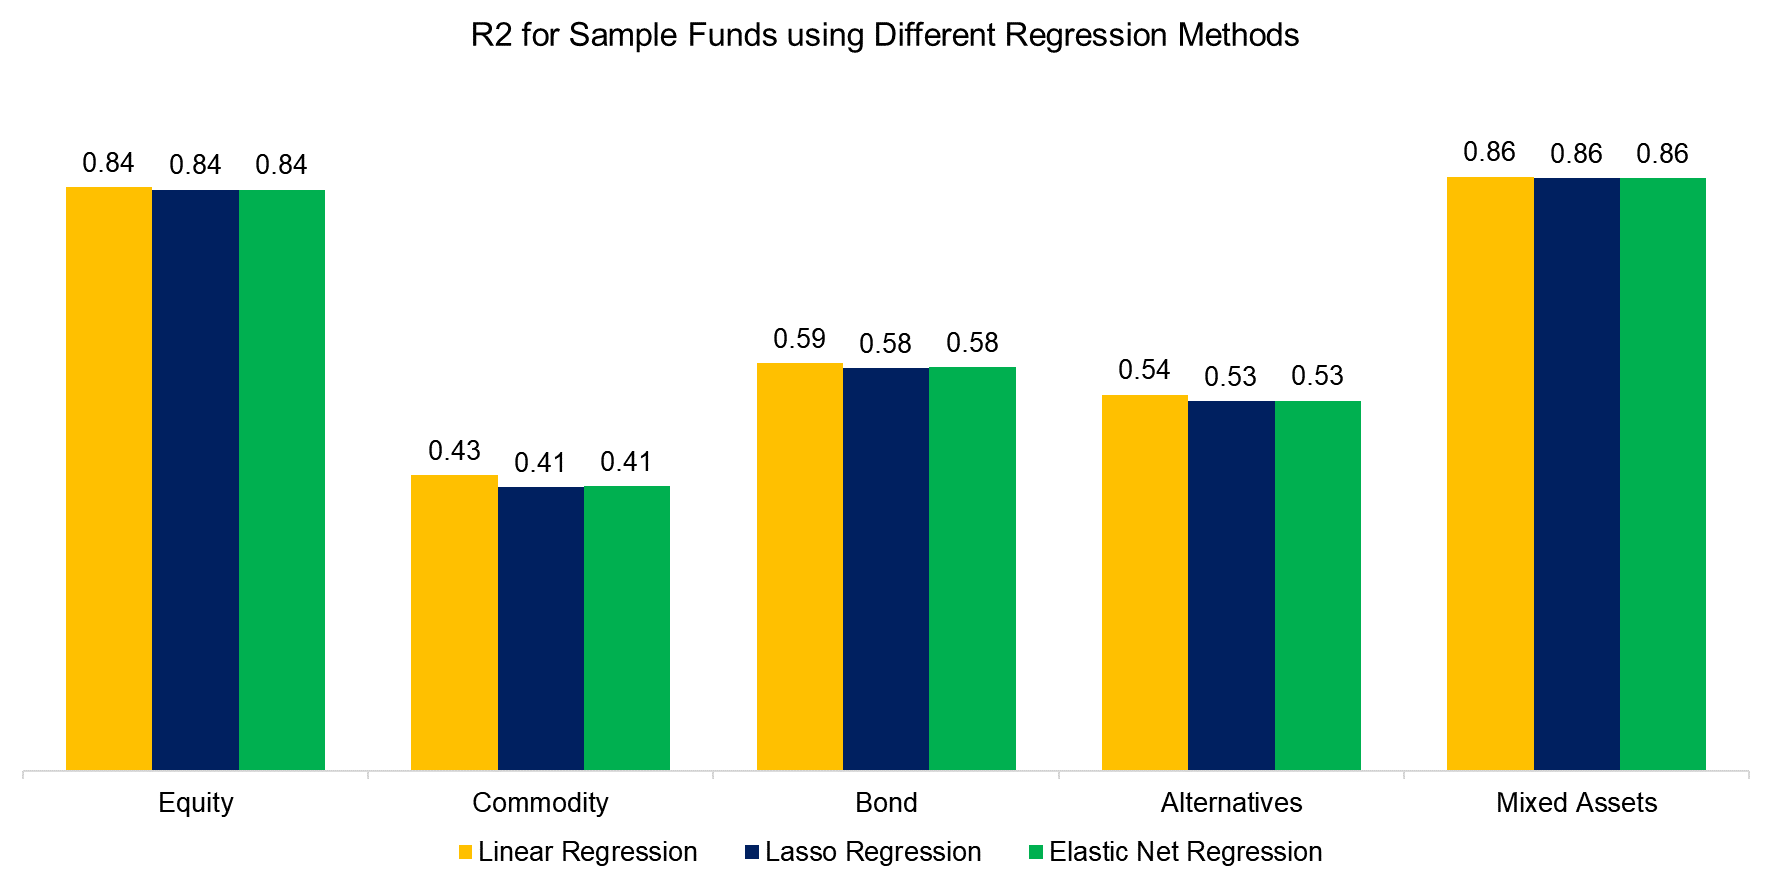
Next, we select a diverse group of 65 ETFs covering segments like mining stocks, high yield bonds, covered calls, etc. We consolidate these funds by asset class categories and calculate the median R2 using the three regression methods. We find the in-sample fits to be much better for equity and mixed assets while less so for commodity and alternatives, but that is to be expected given that we have multiple equity-related independent variables.
Source: Finominal
REPLICATION PORTFOLIOS
Although the in-sample fits are better for linear regression, investors should be more concerned with the out-of-sample performance and model stability. A model that does not work out-of-sample is perhaps not useful as the betas cannot be used moving forward.
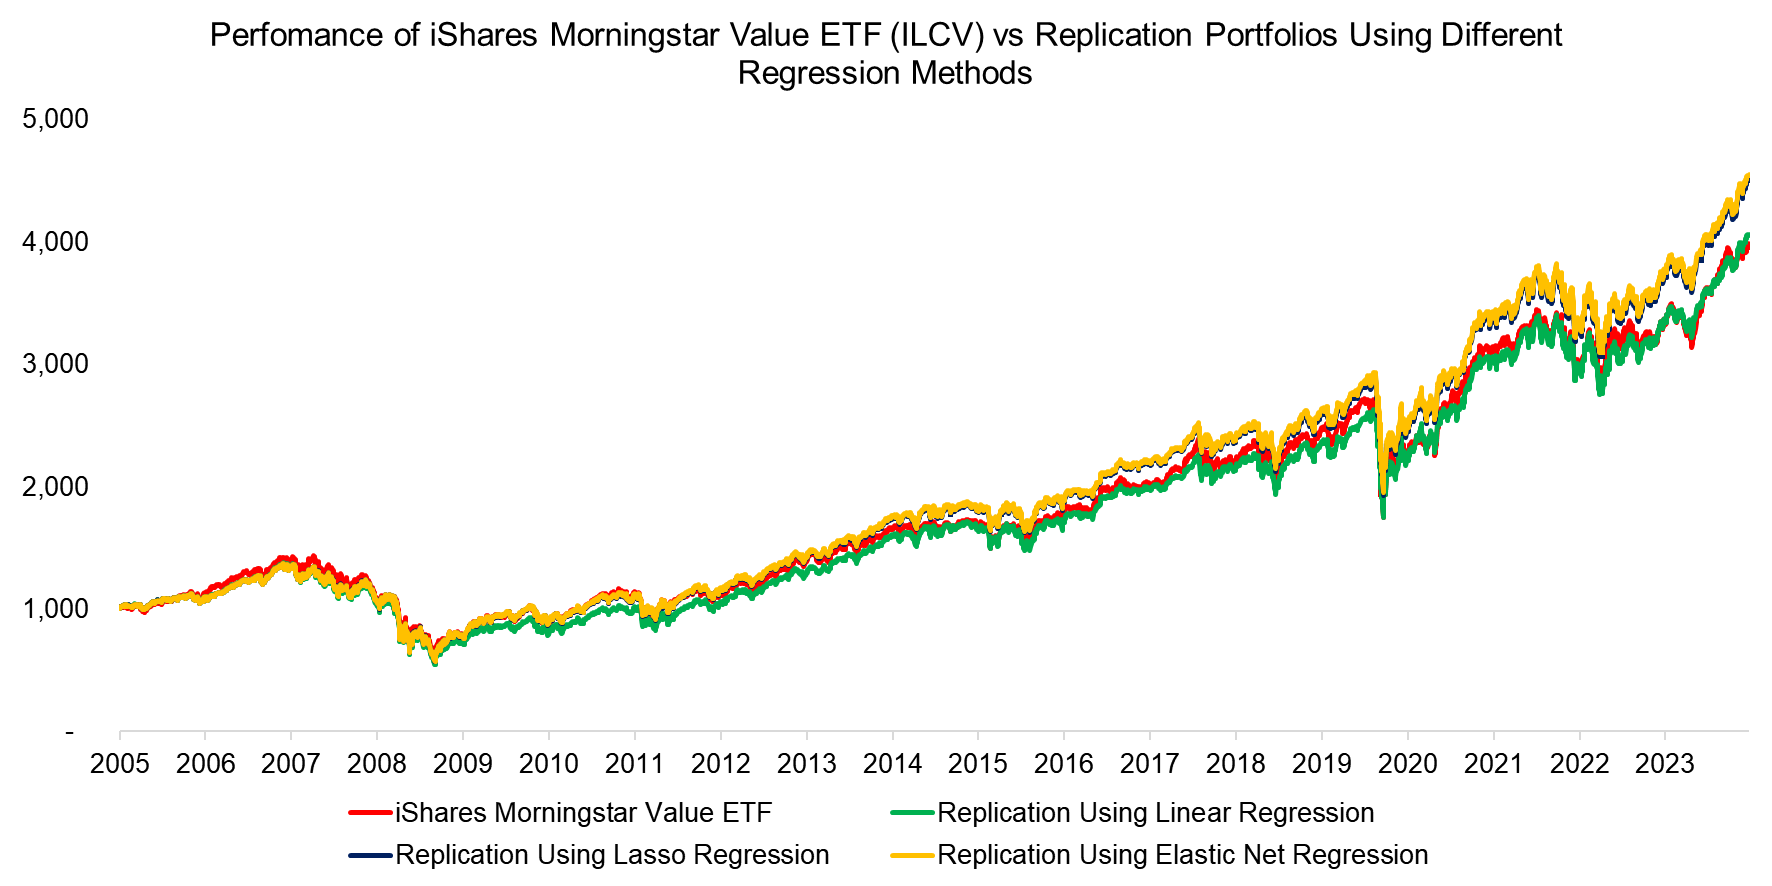
To test this, we return to the ILCV example and try to replicate its performance using the estimated betas (read Replicating a CTA via Factor Exposures). For each regression method, we calculate the rolling one-year betas and extend the performance backward using these as weights with monthly rebalancing.
Comparing the replication portfolios to the original fund performance, we see almost identical performance between these with correlations of more than 0.95 for all methods, which suggests that ILCV can be very closely replicated using standard indices.
Source: Finominal
CORRELATION AND TRACKING ERROR TO REPLICATION PORTFOLIOS
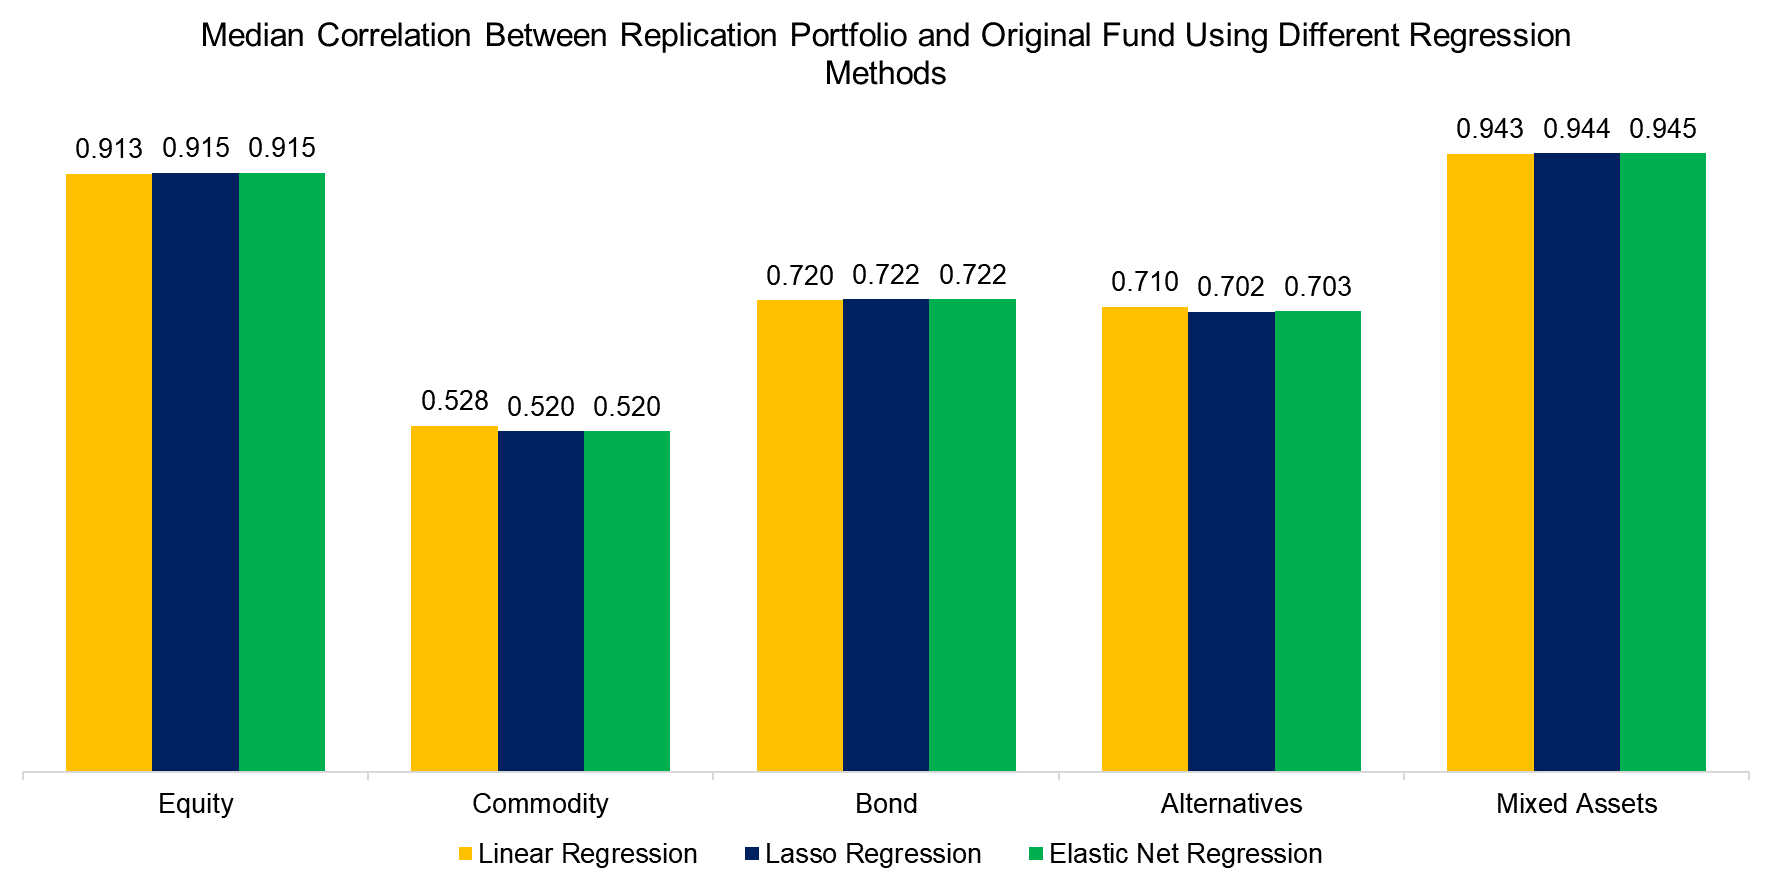
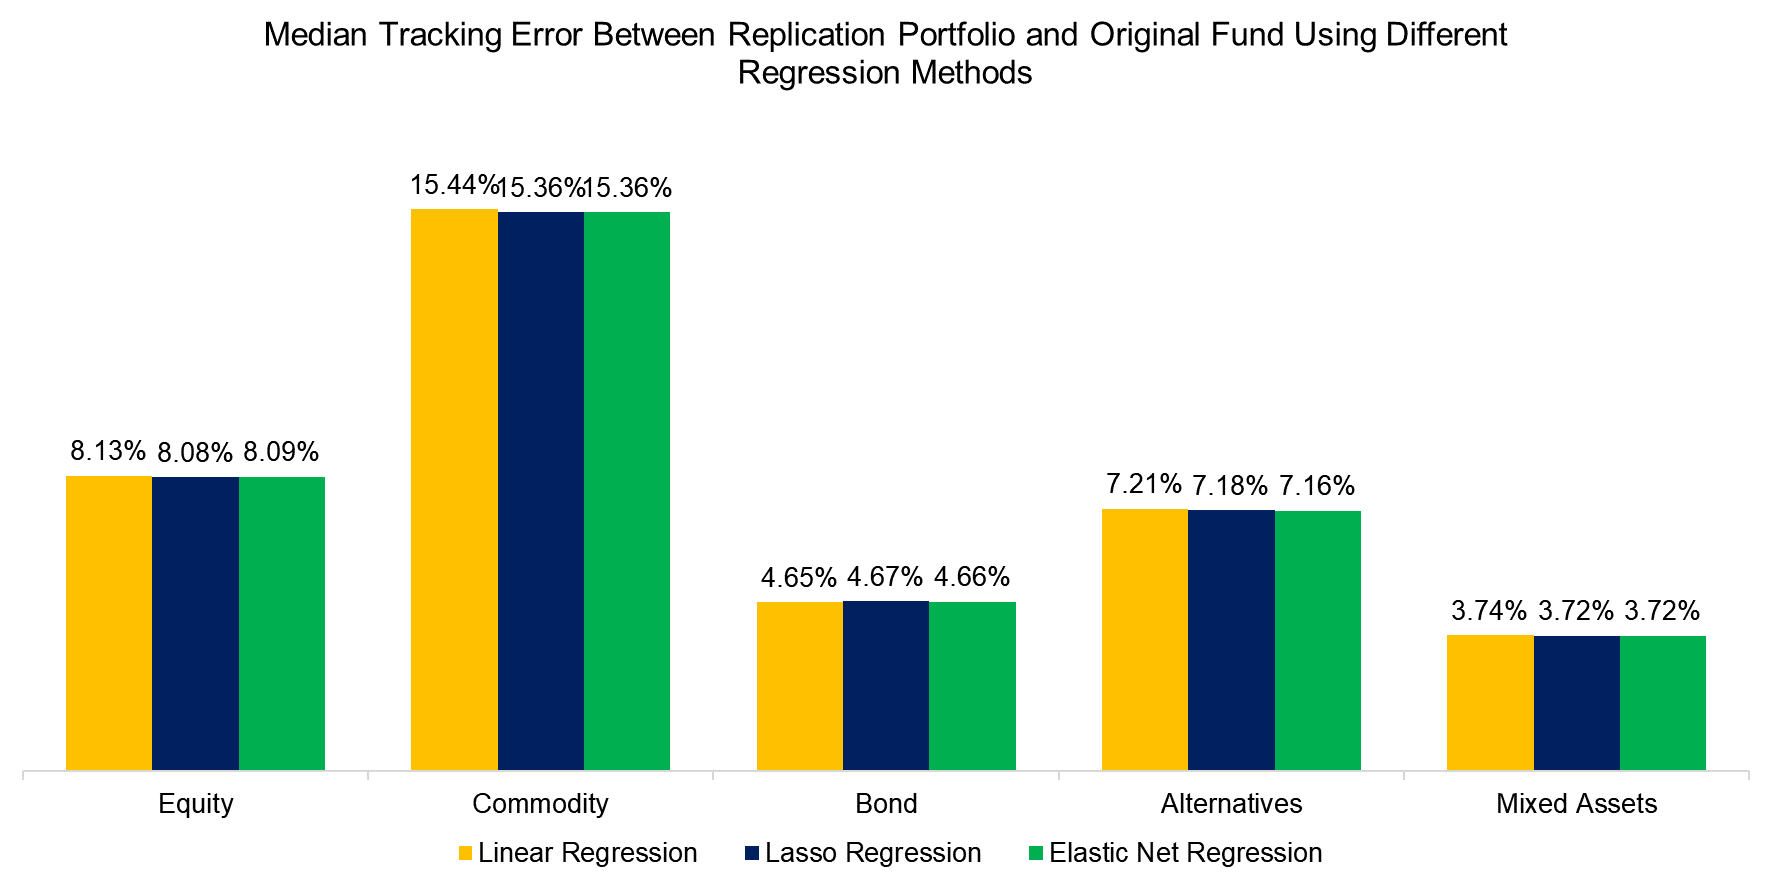
We create similar replication portfolios for all 65 funds, and to assess how well the portfolios mimic the original funds, we calculate the correlation and tracking error between the portfolios and the actual funds. Aggregating the median correlation and tracking errors across asset classes, we find that Elastic Net provides a higher correlation in general while if we consider tracking error, a closer fit is observed using Lasso regression, although with a small margin in both cases.
Source: Finominal
Source: Finominal
OPTIMAL REGRESSION METHOD
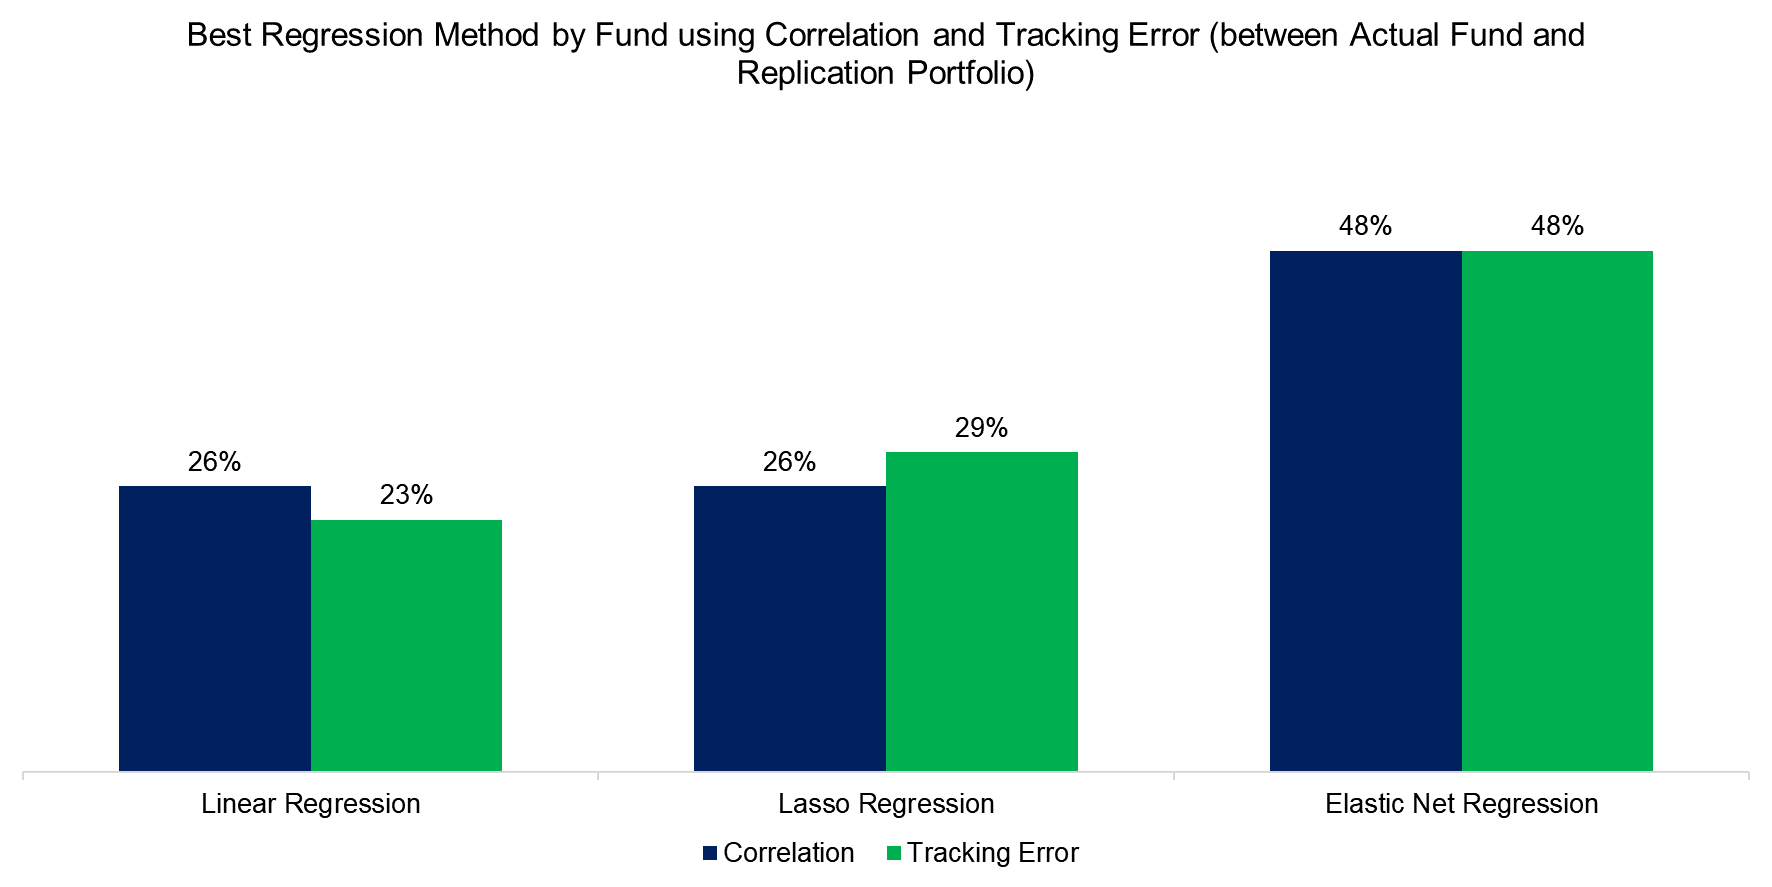
Recognizing that the optimal regression method can vary with asset classes, we now evaluate each fund individually by calculating the correlation and tracking error of the replication portfolio, selecting the best regression method for each based on the highest correlation and lowest tracking error.
We observe that for 26% of the funds linear regression provides the best out-of-sample fit using correlation, compared to 26% and 48% for Lasso and Elastic Net regression. The result is similar if we use tracking error as the measure which indicates that Elastic Net generally offers a better fit than Lasso or linear regression. However, the improvement in these metrics is relatively small across methods.
Source: Finominal
FURTHER THOUGHTS
Fund managers used to showcase their skills by flaunting outperformance numbers, but as investors grew savvier, they realized much of this outperformance came from exposure to traditional factors like value and momentum and so alpha – the true measure of skill, became a more relevant measure, while beta quantified the exposure to these factors.
Unfortunately, more sophisticated statistical tools are required to measure these and each come with their own set of limitations. From the results, although we found more complex models like Elastic Net and Lasso performed better than simple linear regression in most cases, the improvement in metrics were quite minimal and investors can perhaps stick to the simpler approach. So as Albert Einstein said, “Complexity is not a goal. The point is to find a simple way to understand reality.”
RELATED RESEARCH
Replicating Famous Hedge Funds
Factor Exposure Analysis 108: Fixed Income Factors II
Factor Exposure Analysis 107: Fixed Income Factors
Factor Exposure Analysis 106: Macro Variables
Factor Exposure Analysis 105: Sectors versus Factors
Factor Exposure Analysis 104: Fixed Income ETFs
Factor Exposure Analysis 103: Exploring Residualization
Factor Exposure Analysis 102: More or Less Independent Variables?
Factor Exposure Analysis 101: Linear vs Lasso Regression
Factor Exposure Analysis 100: Holdings vs Regression-Based
Time Machines for Investors
ABOUT THE AUTHOR
Abhik Roy, CFA is a Quantitative Researcher at Finominal, which empowers professional investors with data, technology, and research insights to improve their investment outcomes. Abhik holds a Masters in Economics and Bachelors in Engineering from BITS Pilani. Previously he worked at Kristal.AI, a Singapore based fintech firm as a Quantitative Analyst.
Connect with me on LinkedIn.

