What´s Better than the S&P 500?
A review of core equity funds
October 2024. Reading Time: 10 Minutes. Author: Nicolas Rabener.
SUMMARY
- Only 23.7% of U.S. core equity funds have generated a higher Sharpe ratio than the S&P 500
- Some of these are cheaper, others represent bets on factors like quality
- Some have long track records that may indicate manager skill
INTRODUCTION
The SPIVA U.S. Scorecard Year-End 2023 highlights that 88% of large-cap U.S. active mutual funds have underperformed the S&P 500 in the 15 years ending December 2023, which is a depressing fact for active fund managers. Worse, there is also no consistency in returns, i.e. the 12% of funds that have outperformed are not likely to do so again.
Furthermore, if investors want a fund that outperforms the S&P 500, they can simply buy a leveraged ETF, which outperforms the market per its design. Given this, perhaps investors should focus on risk-adjusted returns rather than outperformance (read Outperformance via Leverage).
In this research article, we will evaluate core equity funds that generated higher Sharpe ratios than the S&P 500, where we use the SPDR S&P 500 ETF Trust (SPY) as the investible index.
UNIVERSE OF CORE EQUITY FUNDS
We consider all U.S. ETFs and mutual funds focused on domestic equities as the investible universe, which represents approximately 4,500 funds. We compute the correlation of each of these funds to the S&P 500 since their launch dates and require track records of at least five years.
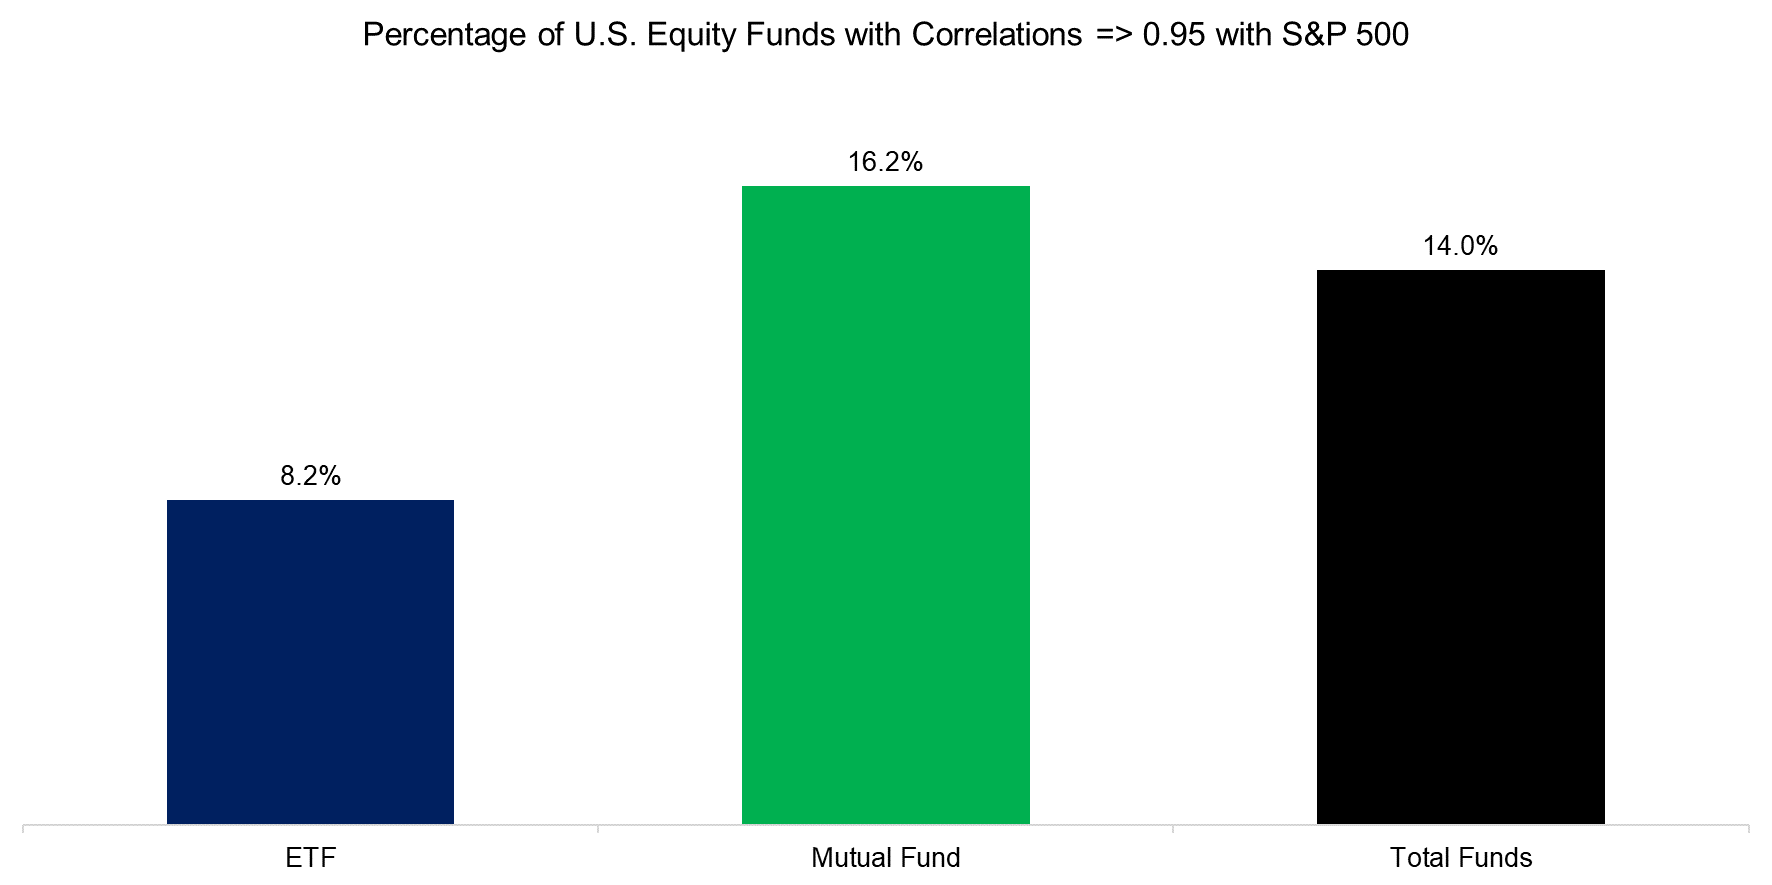
We define a U.S. core equity fund if its correlation to the S&P 500 is equal to or larger than 0.95, which 98 ETFs (8.2% of all ETFs) and 527 mutual funds (16.2%) have accomplished.

Source: Finominal
HIGH SHARPE RATIO CORE EQUITY FUNDS
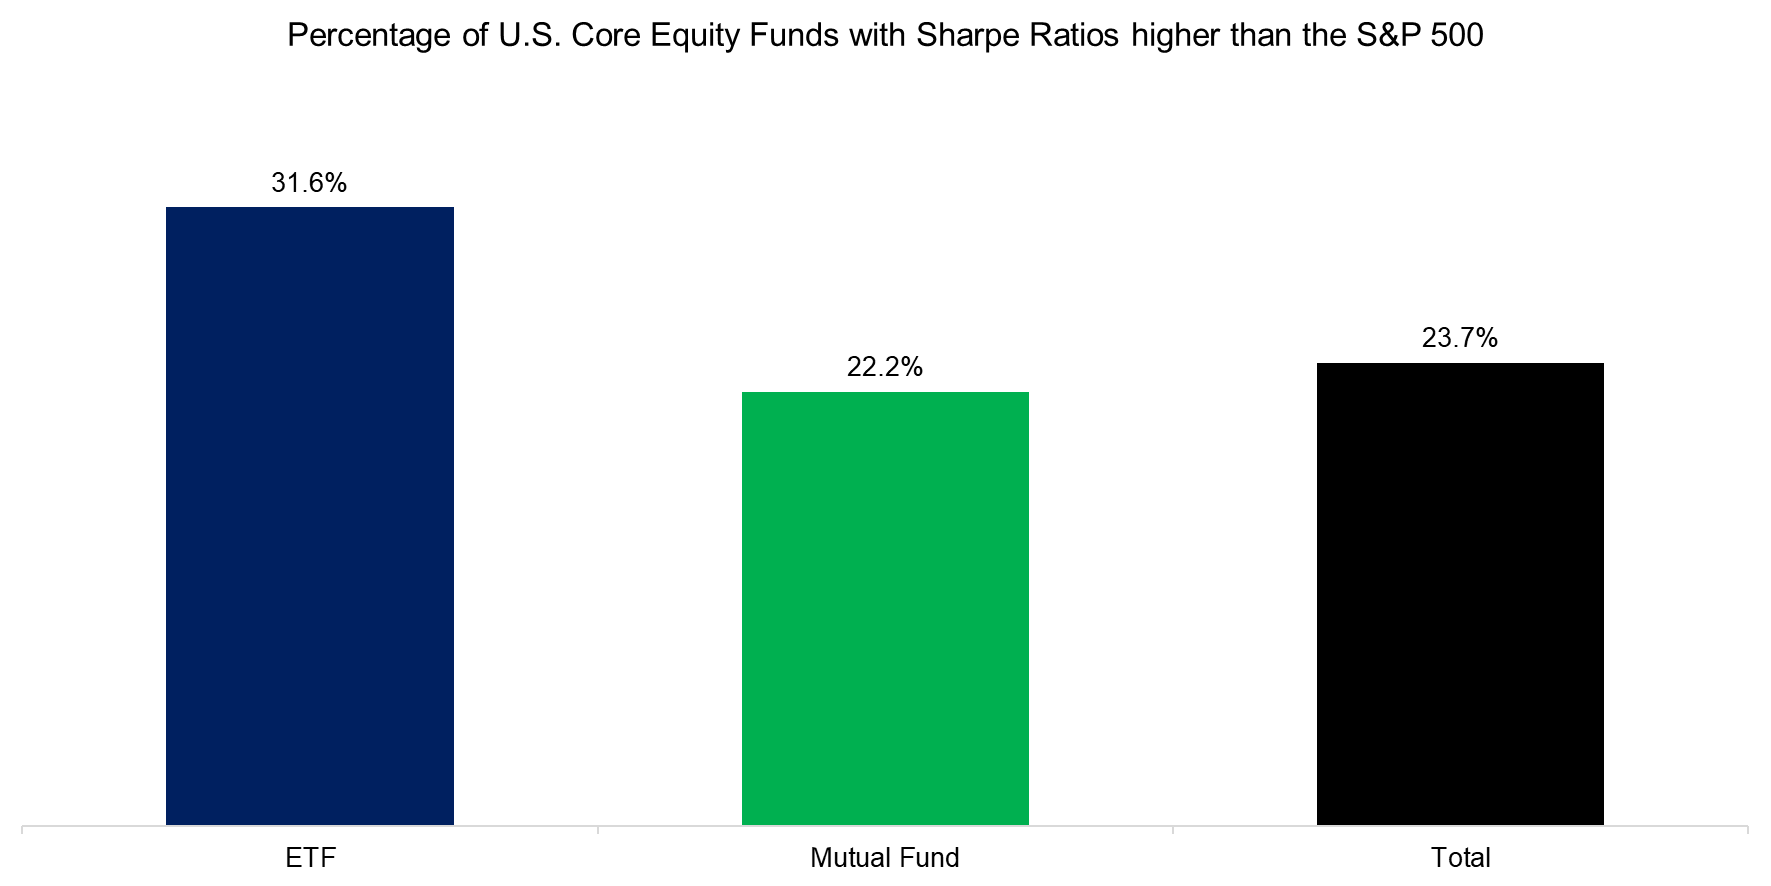
Next, we compute the Sharpe ratios of the 625 core equity funds since their inception and identify the ones that have generated a higher Sharpe ratio than the S&P 500, which results in a universe of 148 funds (23.7%). It is worth highlighting that more ETFs (31.6%) than mutual funds (22.2%) have produced higher risk-adjusted returns than the S&P 500, which can likely be attributed to lower fees.

Source: Finominal
We used the SPDR S&P 500 ETF Trust (SPY) as the investable version of the S&P 500, which charges 0.09% per annum. SPY is the largest ETF with close to $600 billion of assets under management, but it is expensive given that it was launched in 1993 when ETF fees were significantly higher.
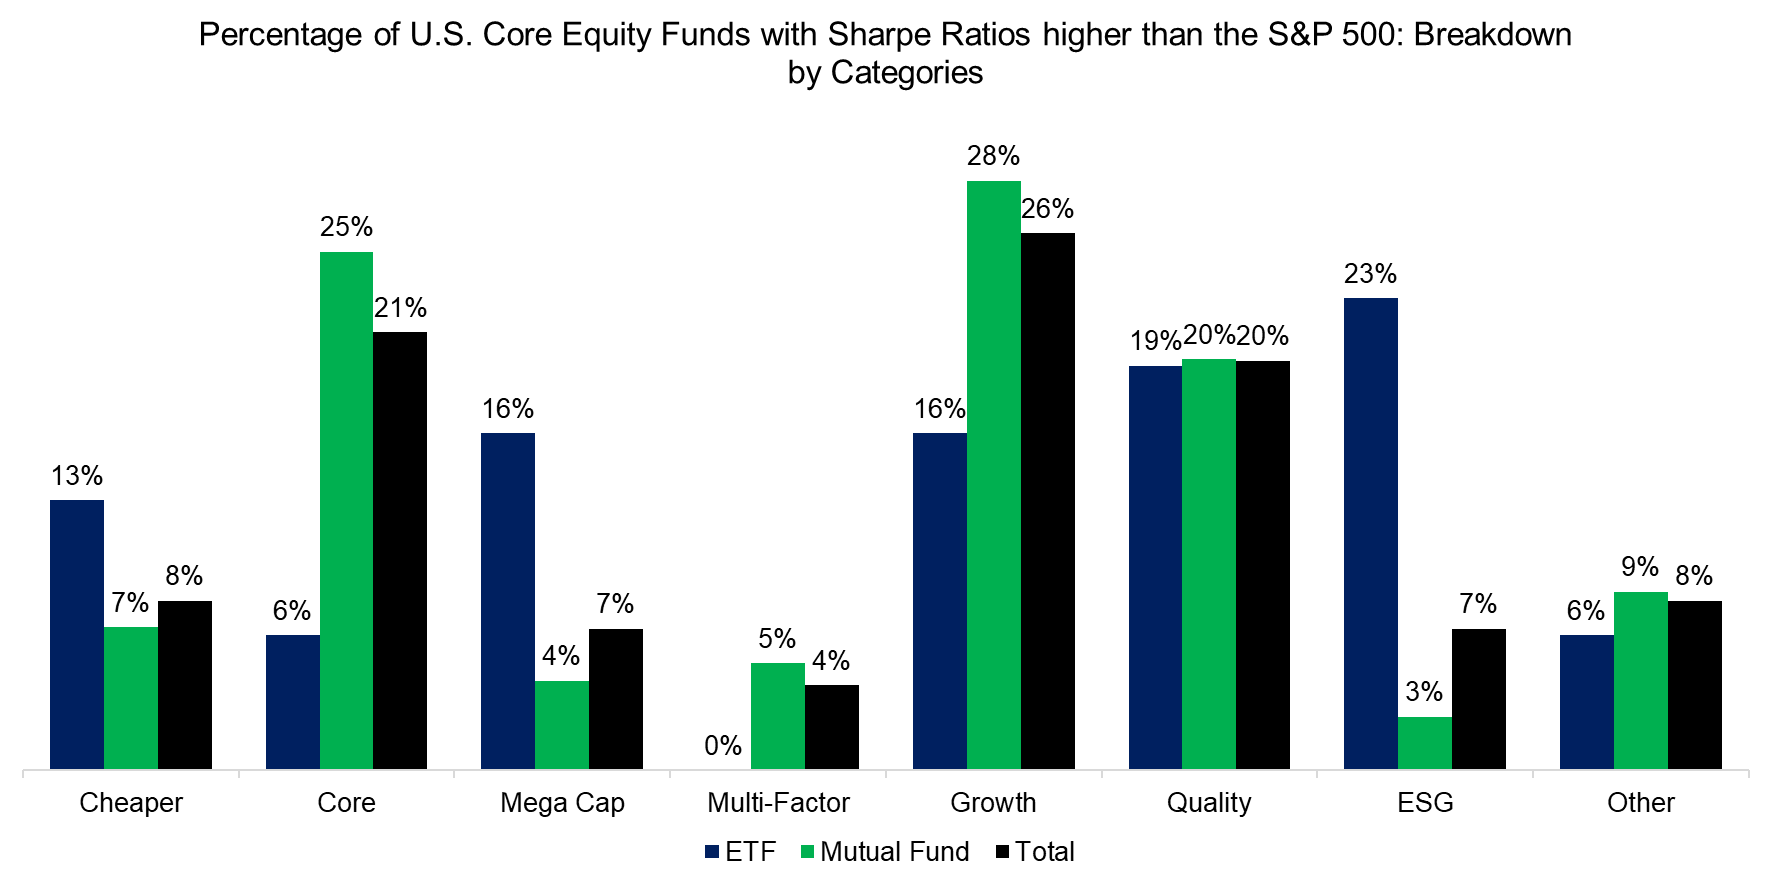
Intuitively, any newer, cheaper ETF tracking the S&P 500, e.g. SoFi Select 500 ETF (SFY) that charges 0.0%, should have generated a higher Sharpe ratio than SPY given lower fees.
Although this is true, there are plenty of other U.S. core equity fund types that have generated higher Sharpe ratios than the S&P 500. The three largest types that have accomplished this are ones that are labeled as “core equity” funds (same or higher fees than SPY), growth and quality-focused products.

Source: Finominal
TOP 20 U.S. CORE EQUITY FUNDS WITH THE HIGHEST SHARPE RATIOS
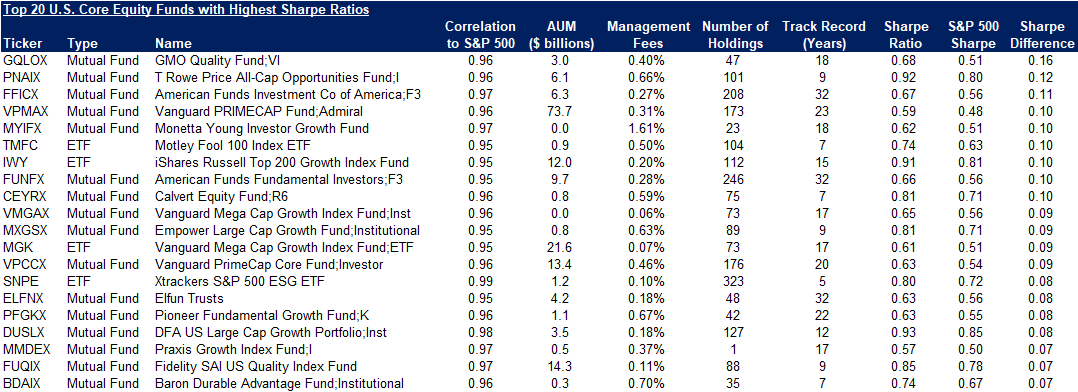
Finally, we review the list of the top 20 U.S. core equity funds with the highest Sharpe ratios, which is a diverse list of funds offering exposure to growth, quality, ESG, and mega-cap stocks. All of these funds hold more concentrated portfolios than the S&P 500.
It is worth highlighting that some of these funds are exceptionally expensive, e.g. the Monetta Young Investor Growth Fund (MYIFX) has a 1.61% management fee. Only two out of the top 20 funds are cheaper than SPY.

Source: Finominal
FURTHER THOUGHTS
Investors might consider GMO´s Quality Fund (GQLOX) or American Funds` Investment Co of America (FFICX) as good alternatives to the S&P 500 given higher Sharpe ratios. However, this analysis can be criticized for representing a study of survivorship bias as we simply selected the best funds looking back, which does not mean that will generate higher risk-adjusted returns going forward.
We already know that there is no consistency in performance from SPIVA and our research (read Chasing Mutual Fund Performance), but perhaps this is different for Sharpe ratios than for returns. GQLOX has an 18-year and FFICX a 32-year track record, so at what point do we acknowledge that a manager is skilled rather than lucky?
RELATED RESEARCH
Outperformance via Leverage
Alpha Generation: Equity Generalists vs Sector Specialists
Higher Volatility, Higher Alpha?
Outperformance Ain’t Alpha
Less Efficient Markets = Higher Alpha?
Chasing Mutual Fund Performance
ABOUT THE AUTHOR
Nicolas Rabener is the CEO & Founder of Finominal, which empowers professional investors with data, technology, and research insights to improve their investment outcomes. Previously he created Jackdaw Capital, an award-winning quantitative hedge fund. Before that Nicolas worked at GIC and Citigroup in London and New York. Nicolas holds a Master of Finance from HHL Leipzig Graduate School of Management, is a CAIA charter holder, and enjoys endurance sports (Ironman & 100km Ultramarathon).
Connect with me on LinkedIn or X.

