Improving Smart Beta Attribution Analysis
Differentiating between factor exposures versus factor returns
December 2024. Reading Time: 10 Minutes. Author: Nicolas Rabener.
SUMMARY
- Return contribution analysis helps understand the different return drivers and measure alpha
- However, the contributions depend on the betas to factors and factor returns
- Managers can control betas, but not factor returns
INTRODUCTION
If you think value-focused funds have performed poorly over the last decade, then you better not look at small-cap funds.
The size factor in the U.S. stock market has shown a negative excess return since 1981 when Rolf W. Banz published his influential paper on small caps outperforming large caps. The underperformance is not restricted to the U.S. as only three out of 21 stock markets globally have shown positive excess returns for the size factor since 1990 (read The Illusion of the Small-Cap Premium).
Investors often lambast factor-focused mutual funds or smart beta ETFs when underperforming, but ignore that a fund has zero impact on the underlying factor performance and can only dial up or down the exposure to the factor.
In this article, we will explore ways to enhance contribution analysis for factor-focused funds.
FACTOR EXPOSURES
In this article, we use Alpha Architect`s U.S. Quantitative Value ETF (QVAL) as a case study. The ETF was launched in 2014, is actively managed, and holds a concentrated portfolio of 50 equal-weighted U.S. stocks sorted on quality and valuation metrics. The fund aims to provide high exposure to the value factor, albeit with a quality overlay to avoid value traps.
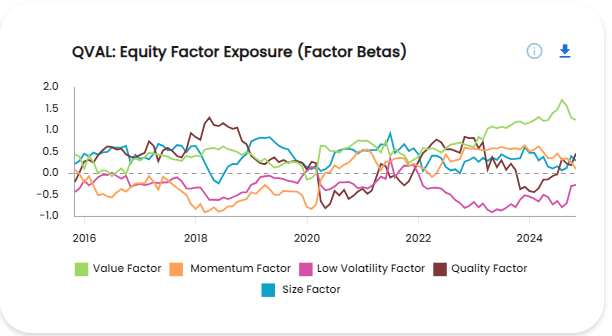
A returns-based factor exposure analysis highlights consistently positive exposure to the value factor as expected. One of the issues with measuring factor exposures is that it depends on the factor definitions, e.g. Alpha Architect uses EV/EBIT for selecting cheap stocks while we use a combination of price-to-earnings and price-to-book. Although the value factor shows the same large trends in performance regardless of the valuation metric, the factor indices are different, and this can occasionally lead to low or even negative betas (read Value Factor – Comparing Valuation Metrics).
Furthermore, we observe consistently positive exposure to the size, negative exposure to the low volatility, and time-varying exposures to the momentum and quality factors. These exposures can be considered unintended exposures and could be reduced via optimization, albeit with consequences (read Factor Optimization).

Source: Finominal
RETURN CONTRIBUTION ANALYSIS
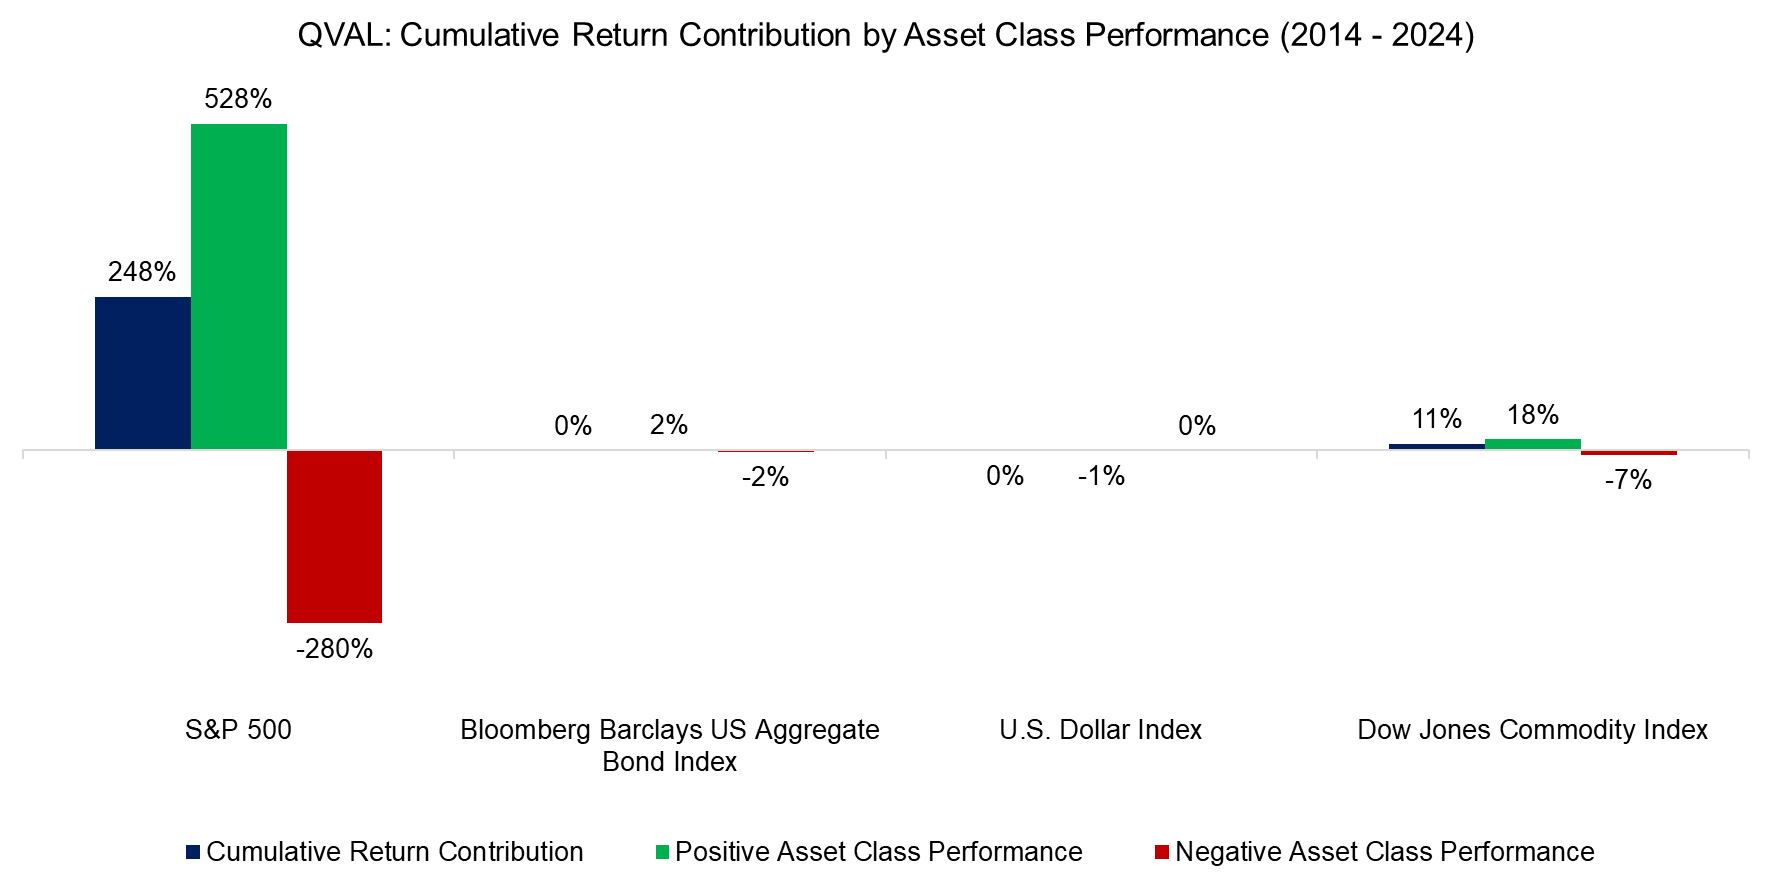
Next, we review the cumulative return contribution of QVAL, which shows that the U.S. stock market has been the largest return contribution since the funds’ inception, which is expected given that it represents a long-only fund with factor tilts.
We also observe that the cumulative return contribution from commodities has been positive, which we can likely explain by exposure to energy stocks when these were cheap, and the alpha was negative, which we can attribute to the different factor metrics and equal-weighting. Neither seems to have generated benefits over the last decade.

Source: Finominal
FACTOR RETURN CONTRIBUTION ANALYSIS
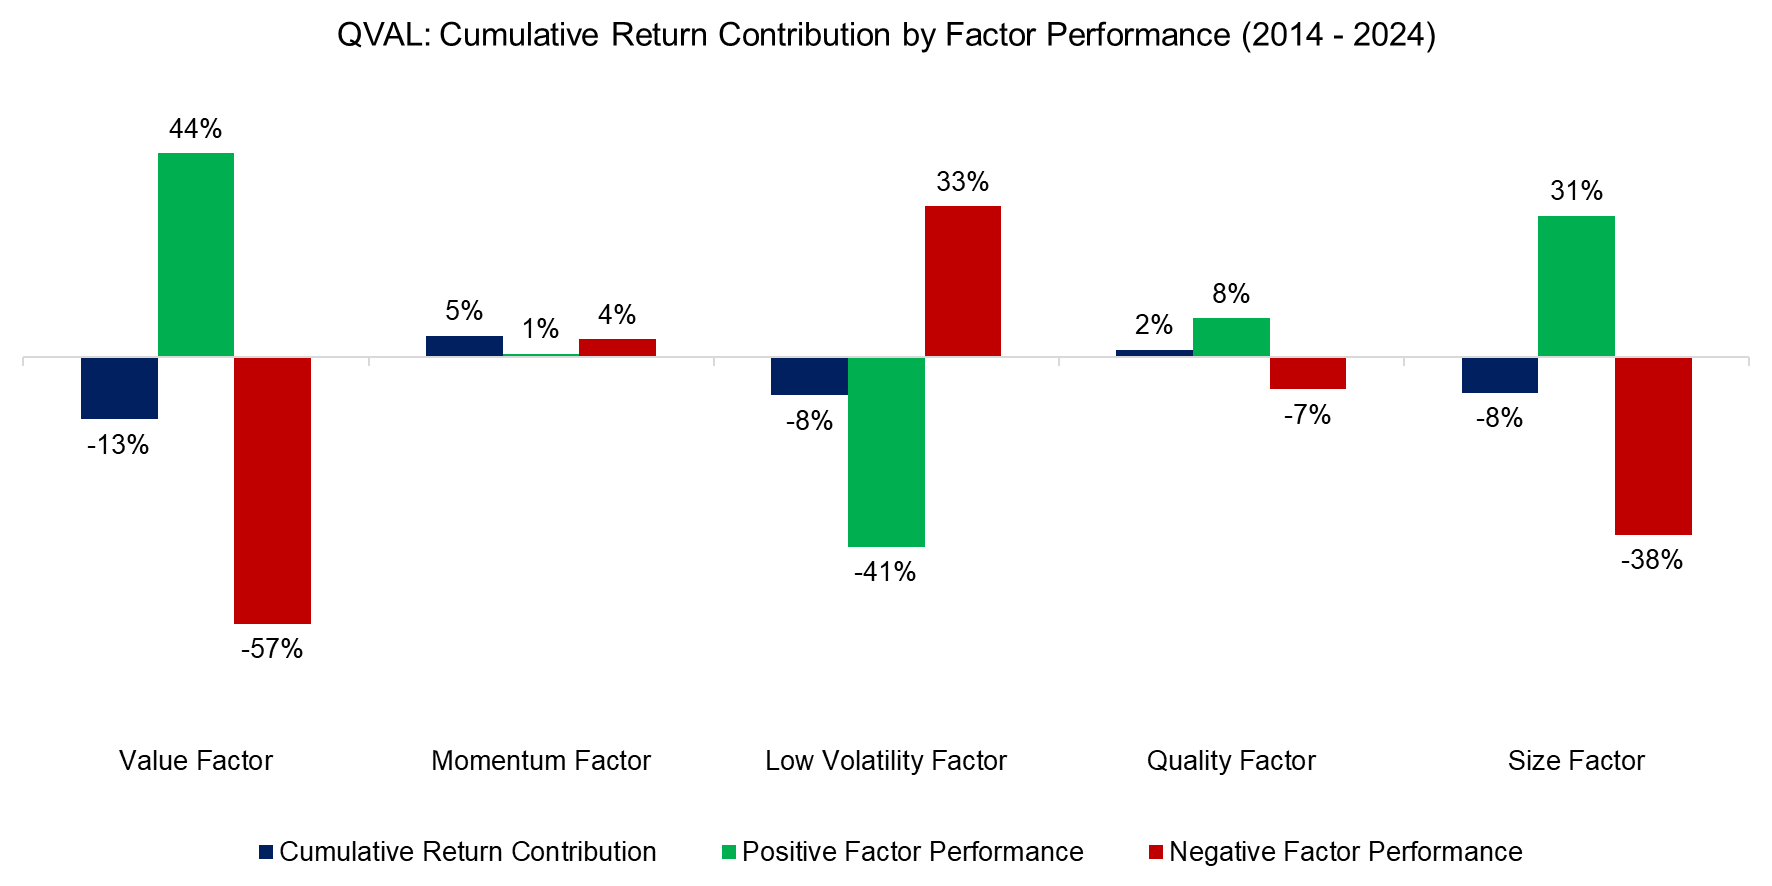
The cumulative return from equity factors has also been negative since 2014, which requires further investigation. The analysis highlights that the key negative return contributor was the value factor. Given that QVAL had a consistently positive beta to the value factor, this would imply that the excess returns of the value factor were negative throughout this period.
However, the exposure to the momentum factor was negative from 2014 to 2020, and then switched to positive thereafter. In contrast, the cumulative return contribution from momentum has been almost consistently positive despite the change in exposure to it, which can be attributed to the performance of the factor. Logically the factor returns were negative in the first few years (negative beta x negative return = positive return contribution) and then positive thereafter.
Naturally, this highlights the difficulty of reviewing contribution analysis as the contribution is a function of the beta to the factor and the factor returns, which can both be positive or negative. Although most investors will have a sense of how the stock market has performed over the last 12 months, how many will have good data for the performance of the quality or low volatility factor?

Source: Finominal
ENHANCED CONTRIBUTION ANALYSIS
We can differentiate the return contributions by asset class and factor performance. On asset class level, almost all returns can be attributed to the U.S. stock market. The cumulative return contribution from the S&P 500 was 248%, where 528% can be allocated to up and -280% to down days of the market. The contribution from other asset classes was insignificant as expected for an equities product.

Source: Finominal
On equity factor level, we see significant positive and negative return contributions from the value, low volatility, and size factors. Unfortunately, this highlights that the negative performance of the value factor contributed -57% since 2014, which outweighs its positive contribution of 44%.
We also see that the low volatility factor contributed -41% when the performance of the factor was positive, which can be explained by QVAL´s negative exposure to the factor.

Source: Finominal
FURTHER THOUGHTS
As this analysis highlights, unintended factor exposures can have a significant impact on the performance of a fund. Portfolio optimization can be used to reduce such bets, but usually not without consequences, e.g. reduced exposure to the intended factor.
However, none of this will improve fund returns if the performance of the core factor is poor. Factors are as cyclical as stock markets and there is very little, except perhaps diversification, that we can do about that.
RELATED RESEARCH
Factor Investing Is Dead, Long Live Factor Investing!
The Case Against Factor Investing
Smart Beta vs Alpha + Beta
Outperformance Ain’t Alpha
How Painful Can Factor Investing Get?
Smart Beta: Broken by Design?
Combining Smart Beta Funds May Not Be Smart
Factor Exposure Analysis 102: More or Less Independent Variables?
Factor Exposure Analysis 101: Linear vs Lasso Regression
Factor Exposure Analysis 100: Holdings vs Regression-Based
ABOUT THE AUTHOR
Nicolas Rabener is the CEO & Founder of Finominal, which empowers professional investors with data, technology, and research insights to improve their investment outcomes. Previously he created Jackdaw Capital, an award-winning quantitative hedge fund. Before that Nicolas worked at GIC and Citigroup in London and New York. Nicolas holds a Master of Finance from HHL Leipzig Graduate School of Management, is a CAIA charter holder, and enjoys endurance sports (Ironman & 100km Ultramarathon).
Connect with me on LinkedIn or X.

