Factor Olympics 2024
And the winner is…
January 2025. Reading Time: 10 Minutes. Author: Nicolas Rabener.
SUMMARY
- The losers of last year, ie momentum and low volatility, became the winners of this year
- Momentum performed the best, size the worst
- Smart beta products do not provide the same exposures as market-neutral multi-factor funds
INTRODUCTION
We present the performance of five well-known factors on an annual basis for the last 10 years. Specifically, we only present factors where academic research supports the existence of positive excess returns across market cycles and asset classes.
METHODOLOGY
Our factors are created by constructing long-short beta-neutral portfolios of the top and bottom 30% of stocks. Only stocks with a minimum market capitalization of $1 billion are included. Portfolios rebalance monthly and transactions incur 10 basis points of costs.
FACTOR OLYMPICS: GLOBAL EXCESS RETURNS
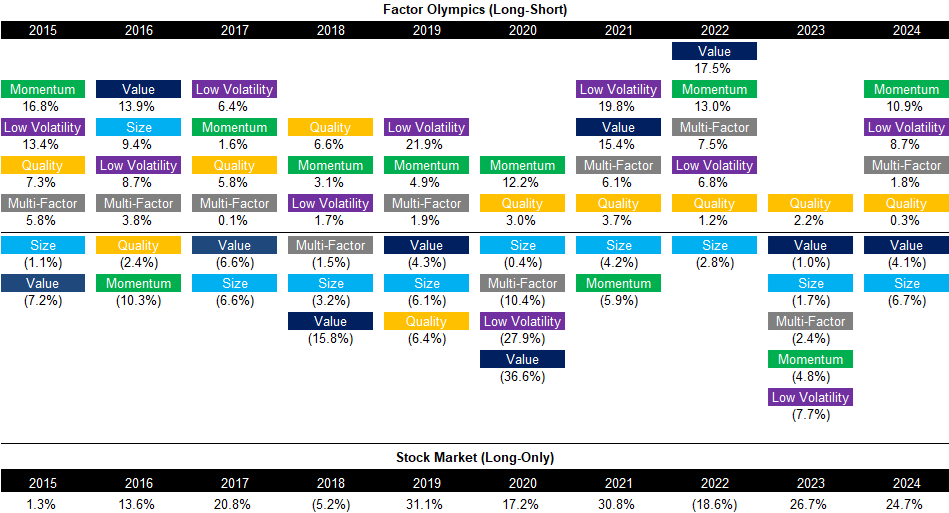
The table below shows the long-short factor performance for the last 10 years ranked top to bottom. The global series is comprised of all developed markets in Asia, Europe, and the US. Aside from displaying the factor performance, the analysis highlights the significant factor rotation in terms of profitability from one year to the next, highlighting the benefits of diversified exposure.
We observe a continuation of last year’s trends in factor performance for the value and size factors, but also a significant rotation of momentum and low volatility going from the worst- to the best-performing factors in 2024. The quality factor, where stocks are selected on return-on-equity and debt-over-equity ratios, has generated its fifth year of positive excess returns.
A theoretical portfolio providing equal-weighted exposure to all five factors would have generated 1.8% before management fees.

Source: Finominal
TRENDS IN GLOBAL FACTOR PERFORMANCE
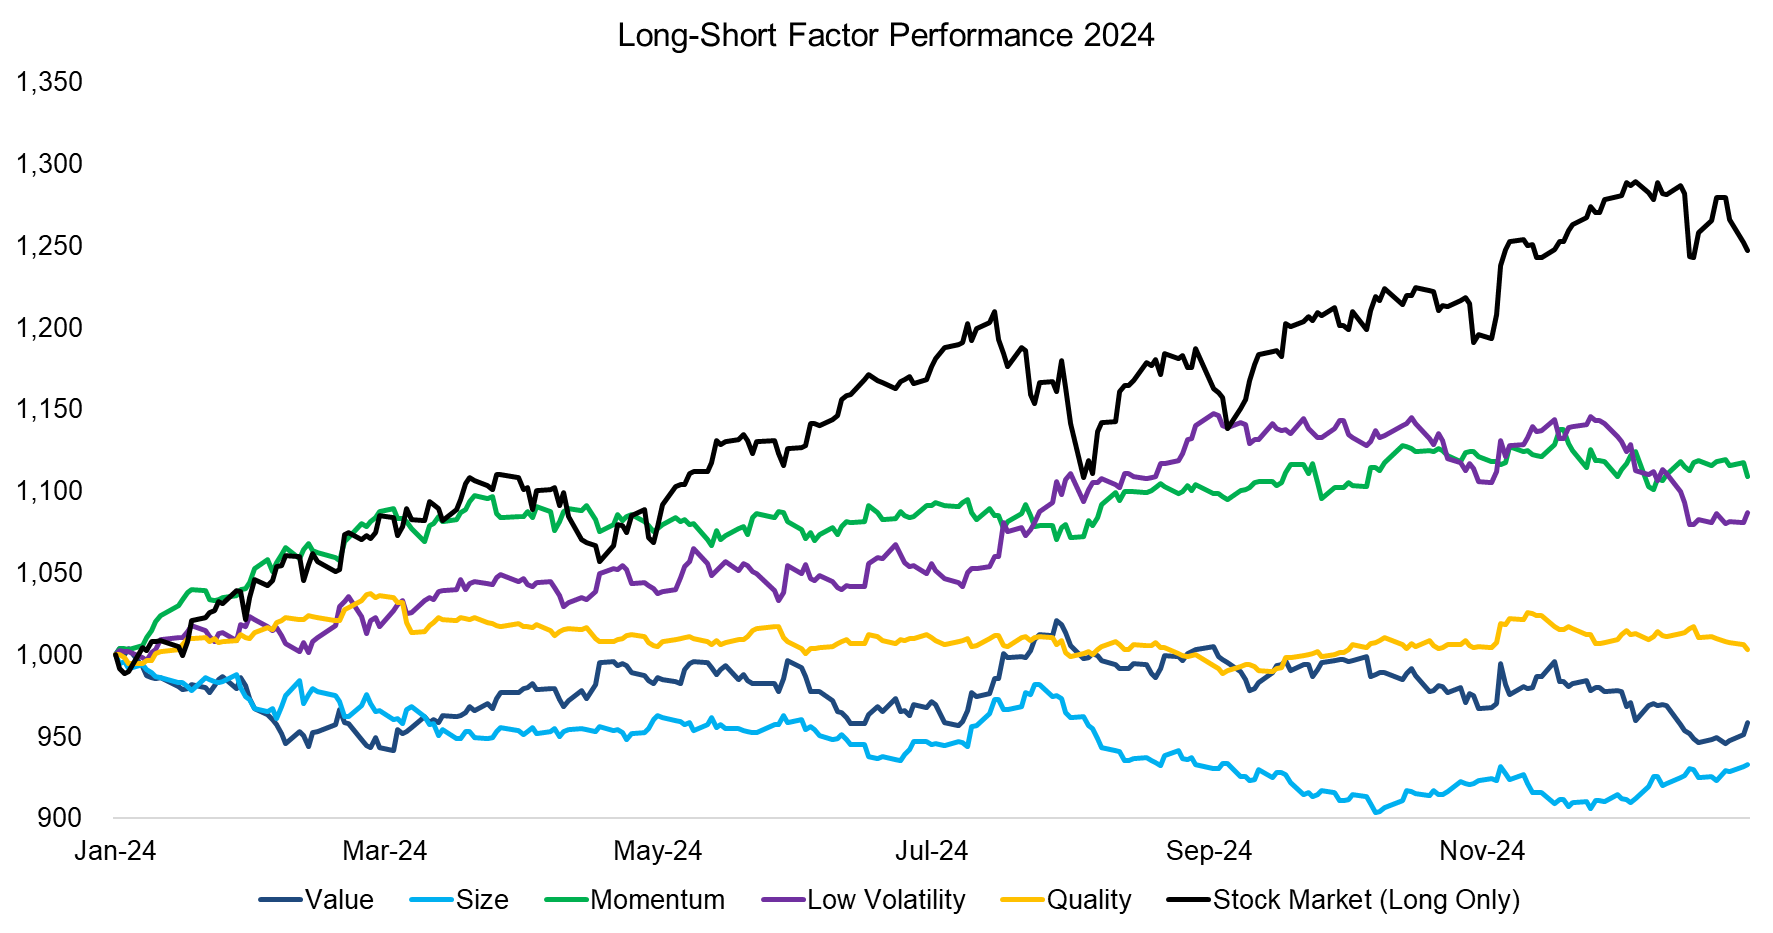
The trends in factor performance remained relatively consistent throughout the year, with the top-performing factors in the first quarter of 2024 emerging as the year’s overall winners, while the weakest factors maintained their underperformance. The quality factor demonstrated the lowest volatility, aligning with its historical behavior.

Source: Finominal
PERFORMANCE OF LONG-SHORT MULTI-FACTOR PRODUCTS
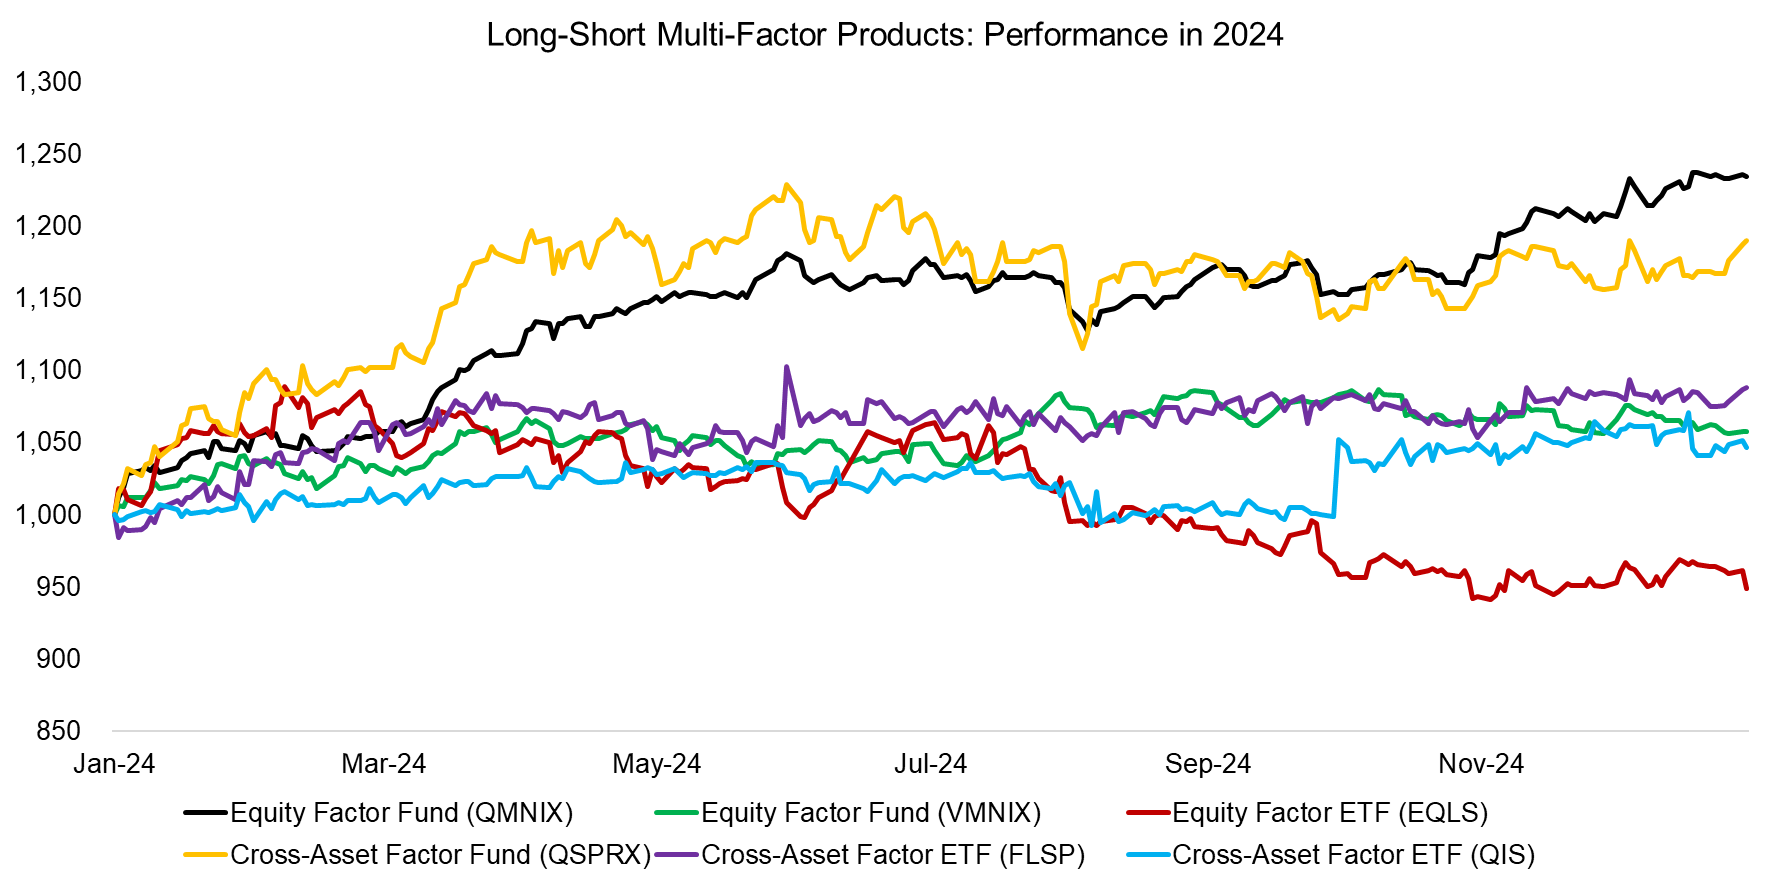
There are only a few liquid alternative mutual funds and ETFs that provide pure exposure to factors in the long-short format as seen in academic research. The last decade has seen many fund liquidations, however, Simplify Asset Management launched two new products in 2023, namely the Simplify Market Neutral Equity Long/Short ETF (EQLS) and Simplify Multi-QIS Alternative ETF (QIS), which provide exposure to equity and cross-asset factors.
We observe that five products generated positive excess returns in 2024, while only EQLS lost money. It is worth highlighting that the best-performing products, i.e. AQR´s QMNIX and QSPRX funds, are also the most expensive ones.

Source: Finominal
SMART BETA EXCESS RETURNS
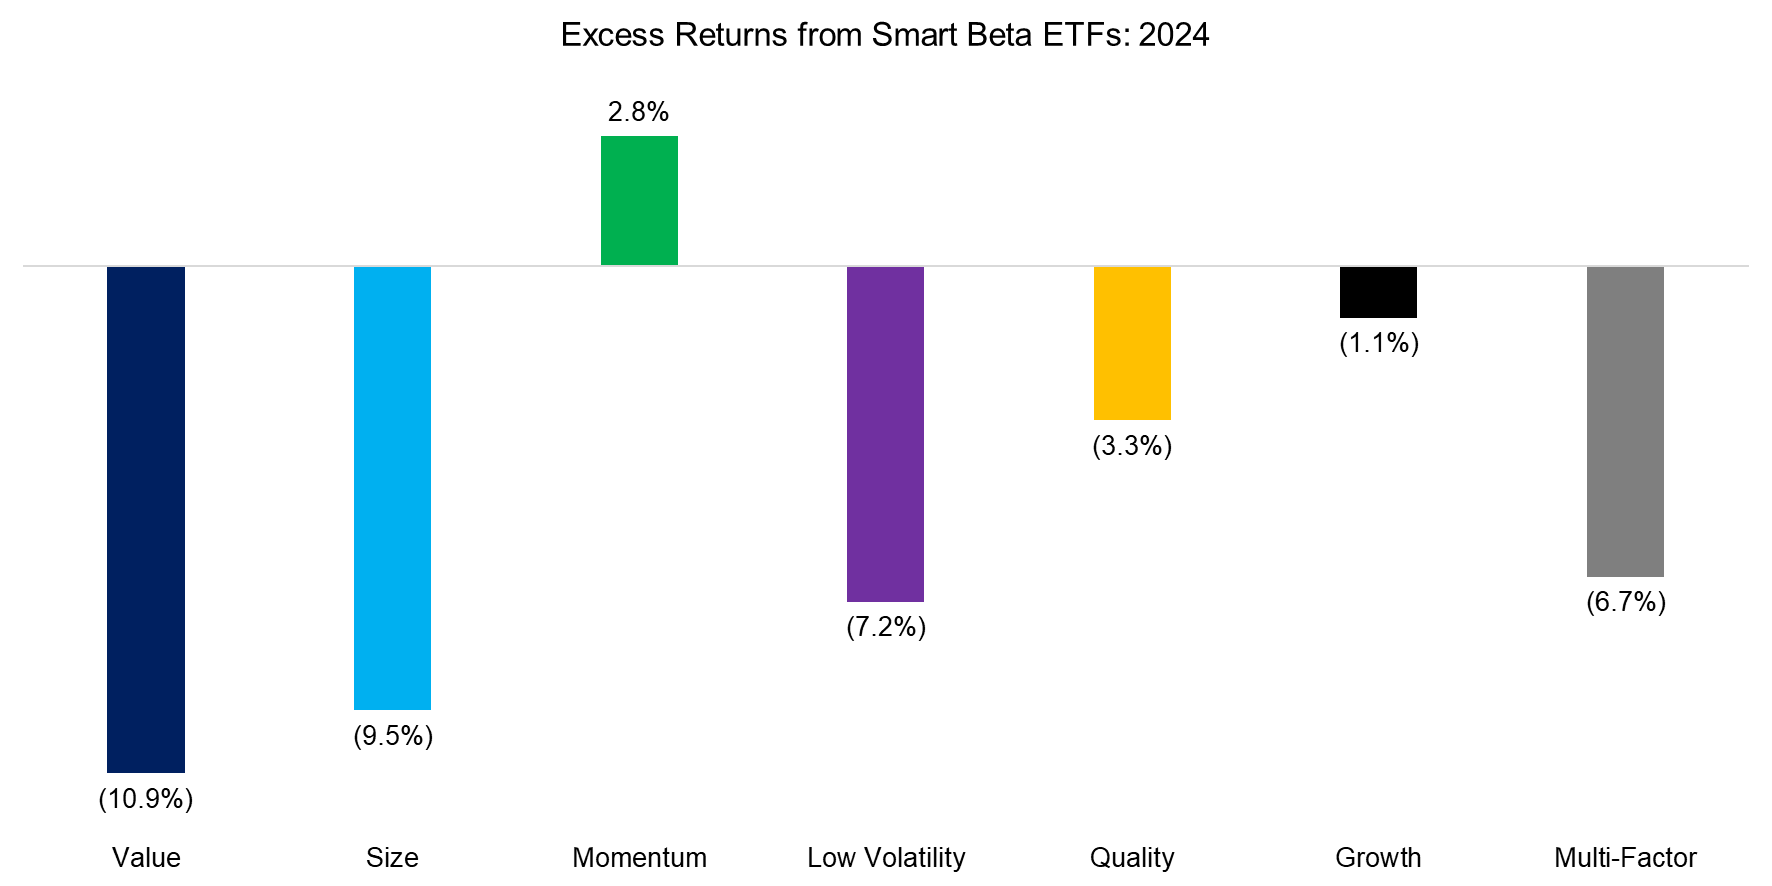
Although investors should allocate to factors constructed as long-short portfolios given that these offer high diversification benefits, most invest via long-only smart beta ETFs (read Smart Beta vs Alpha + Beta). Following the money, we highlight the excess returns generated from investing in smart beta ETFs in the US, which represents a universe of 160+ products and approximately $800 billion of assets under management. We also show the performance of the growth factor, which is popular with investors but is not associated with positive excess returns over time (read What Are Growth Stocks?).
In contrast to previous times, we observe significant differences between the excess returns of smart beta ETFs and theoretical long-short factor returns, e.g. smart beta multi-factor products underperformed but the theoretical multi-factor portfolio (as well as products like QMNIX) generated positive returns (read Market-Neutral versus Smart Beta Factor Investing).

Source: Finominal
FACTOR CORRELATIONS
The 12-months factor correlations have become more extreme again with low volatility and value factors being highly positive correlated, which is remniscient of the tech bubble in 2000. Naturally that bubble imploded, as all do, and cheap and low volatile stocks performed strongly thereafter.

Source: Finominal
FURTHER THOUGHTS
Investors should pay attention to the discrepancy between the positive returns of long-short multi-factor funds and the negative excess returns of multi-factor smart beta ETFs. Intuitively, these provide access to the same risks exposures, e.g. to value, momentum, etc. However, the short portfolio can contribute positive returns but naturally does not feature in long-only factor investing implementations like smart beta ETFs, which can lead to these significant divergences.
RELATED RESEARCH
Market-Neutral versus Smart Beta Factor Investing
Improving Smart Beta Attribution Analysis II
Quality in Small versus Large-Cap Stocks
The Illusion of the Small-Cap Premium
Shorting Lousy Stocks = Lousy Returns?
Higher Volatility, Higher Alpha?
Outperformance Ain’t Alpha
Improving the Odds of Value Investing
The Value Factor’s Pain: Are Intangibles to Blame?
Smart Beta vs Alpha + Beta
How Painful Can Factor Investing Get?
GARP Investing: Golden or Garbage? II
ABOUT THE AUTHOR
Nicolas Rabener is the CEO & Founder of Finominal, which empowers professional investors with data, technology, and research insights to improve their investment outcomes. Previously he created Jackdaw Capital, an award-winning quantitative hedge fund. Before that Nicolas worked at GIC and Citigroup in London and New York. Nicolas holds a Master of Finance from HHL Leipzig Graduate School of Management, is a CAIA charter holder, and enjoys endurance sports (Ironman & 100km Ultramarathon).
Connect with me on LinkedIn or X.

