Equal versus Market Cap-Weighted Stock Market Indices
And the winner is?
January 2025. Reading Time: 10 Minutes. Author: Nicolas Rabener.
SUMMARY
- Equal-weighted stocks outperformed market cap-weighted stocks in 8/10 decades
- They were also more volatile, but generated a higher Sharpe ratio
- May appeal to investors concerned about the concentration level of the S&P 500
INTRODUCTION
Weighting stocks by market capitalization is often the most practical approach for large investors, as it minimizes transaction costs. However, it is not the only method available. Investors can also choose to weight stocks based on fundamentals like revenues or profits, use factor-based approaches, or apply equal weighting.
Conceptually, market capitalization weighting resembles a form of momentum investing, as it channels the most capital to the largest and most successful companies. Despite this, the actual exposure to the momentum factor is often modest (read Cap-Weighted Benchmarks: Good Momentum Bets?), and historically, relying on the dominance of market leaders – “the juggernauts” – has been a suboptimal strategy (read The Juggernaut Index).
With the market cap-weighted S&P 500 exhibiting unusually high concentration levels today, some investors are exploring alternative weighting methodologies.
In this research article, we will examine the comparative performance of equal weighting versus market cap weighting in the U.S. stock market.
EQUAL VERSUS MARKET CAP-WEIGHTING IN THE U.S. STOCK MARKET
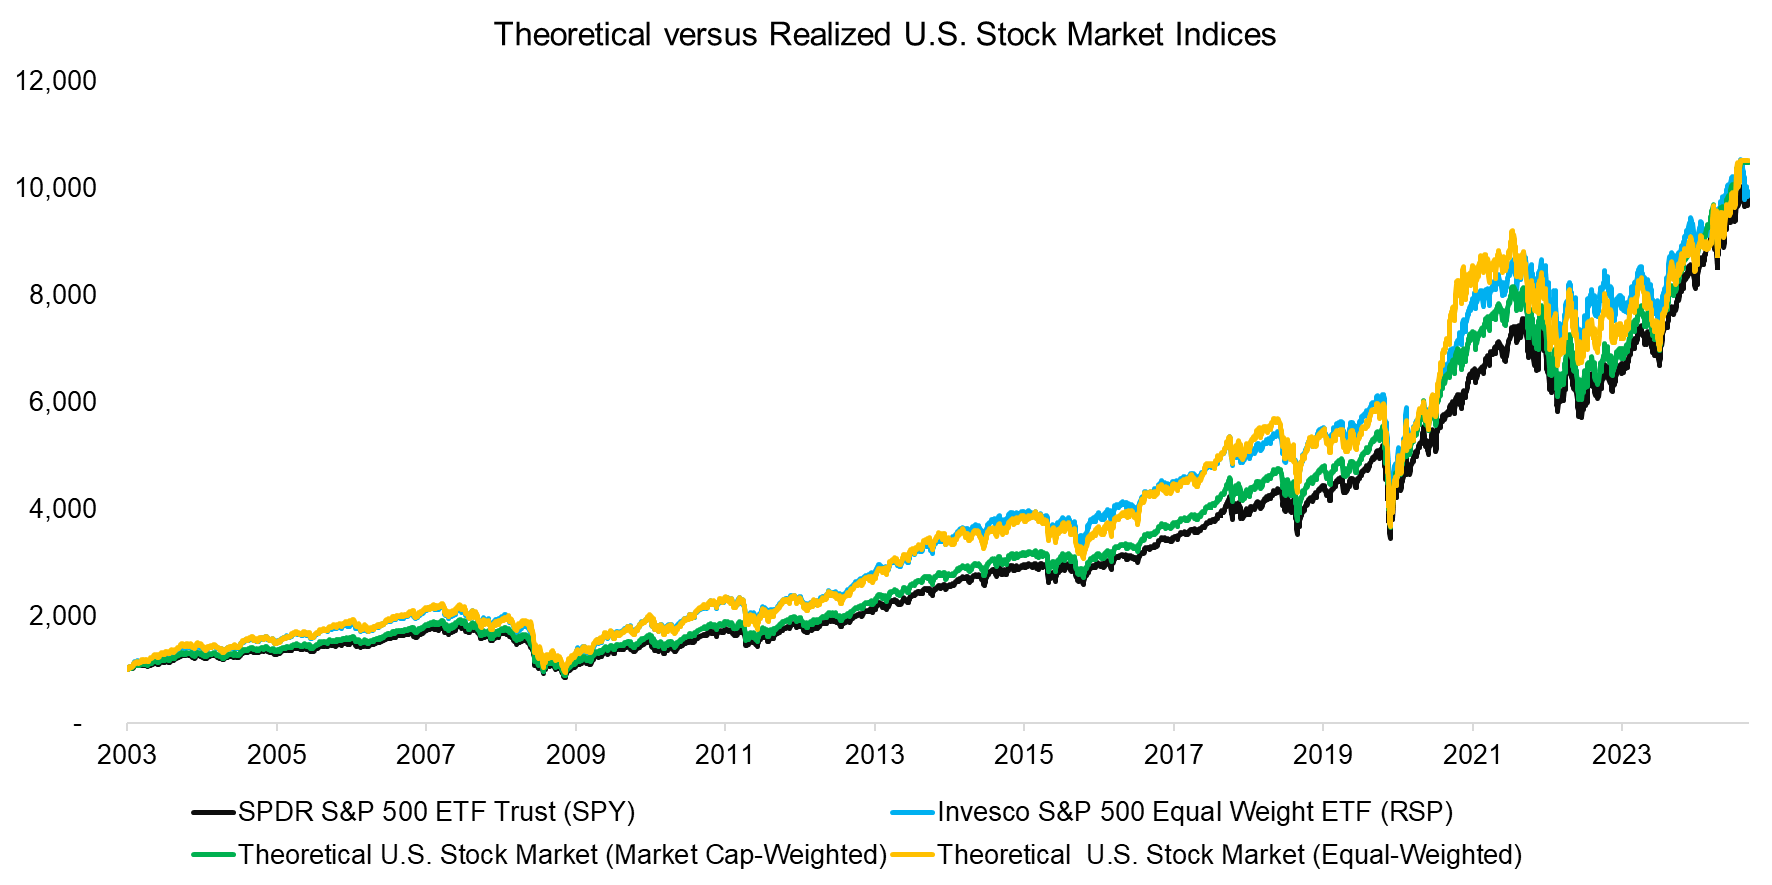
While there are no public sources for equal-weighted U.S. stock market returns, we can construct such an index using data from the Kenneth R. French Data Library. For this analysis, we create theoretical market cap-weighted and equal-weighted U.S. stock market indices and compare their performance to two real-world products with realized returns: the market cap-weighted SPDR S&P 500 ETF Trust (SPY) and the Invesco S&P 500 Equal Weight ETF (RSP).
These theoretical portfolios represent the broader U.S. stock market, whereas the S&P 500 indices focus on large-cap stocks. While this introduces minor differences, the theoretical indices serve as reasonable approximations.
Notably, equal-weighting U.S. stocks has outperformed market cap-weighting in most years over the past two decades.

Source: Kenneth R. French Data Library, Finominal
THE LONG-TERM PERFORMANCE
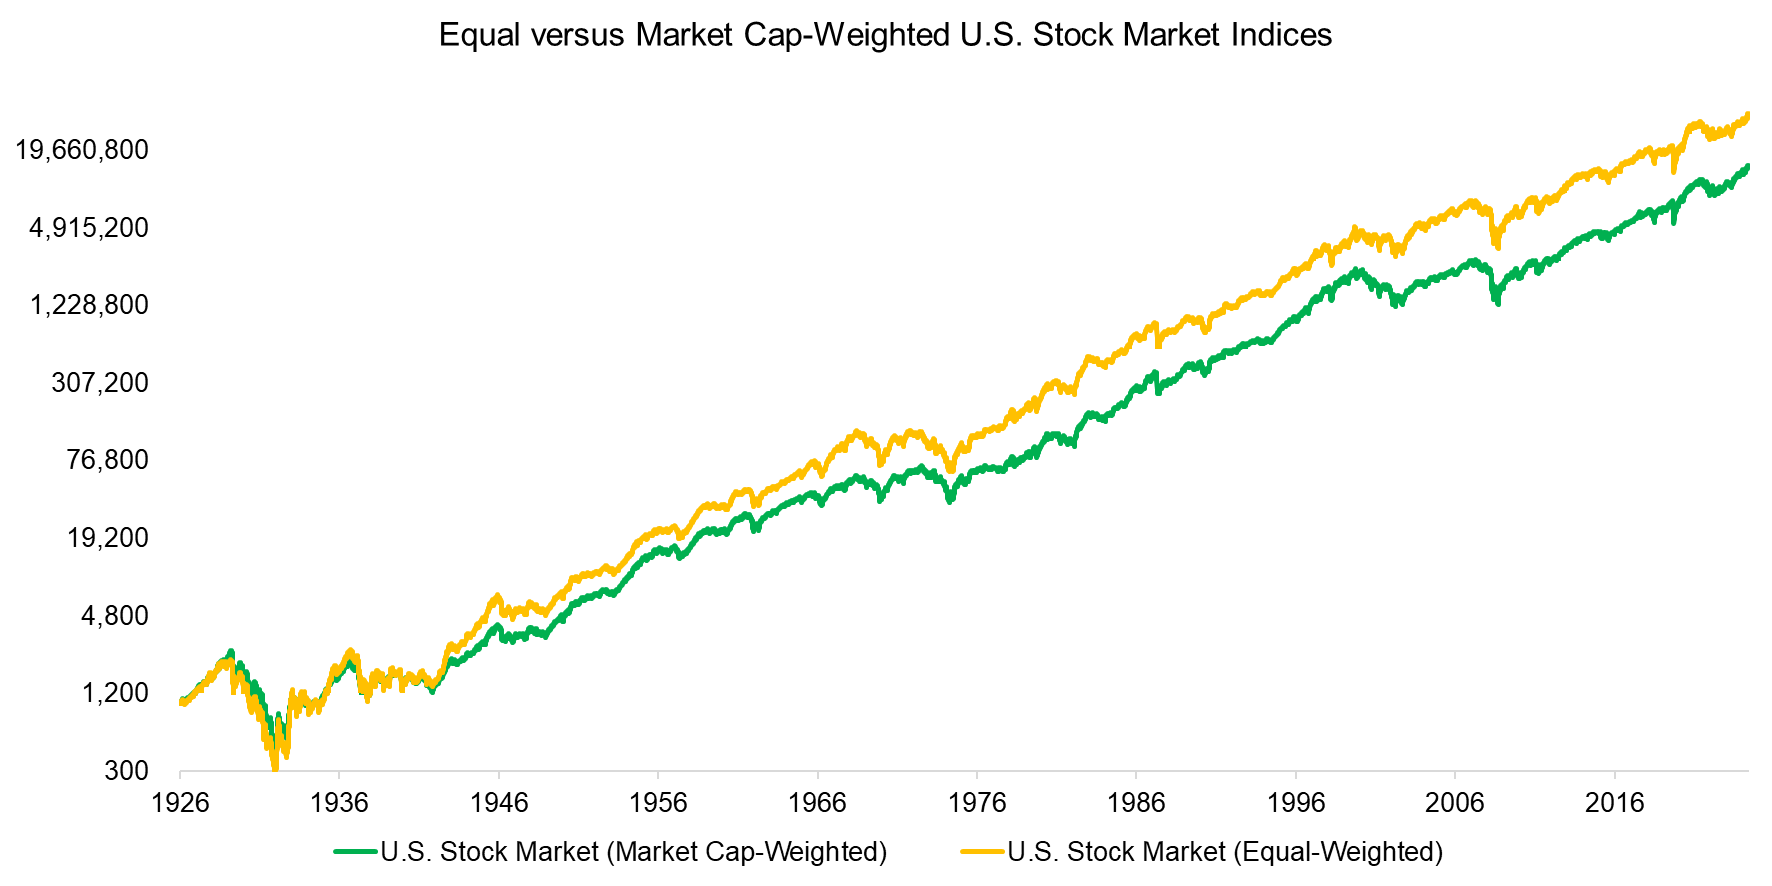
Expanding the analysis to 1926 using the theoretical portfolios reveals that equal-weighting has consistently outperformed market cap-weighting over the past century, with the exception of the decade from 1926 to 1936, during which their performance was similar.

Source: Kenneth R. French Data Library, Finominal
RISK & RETURN METRICS
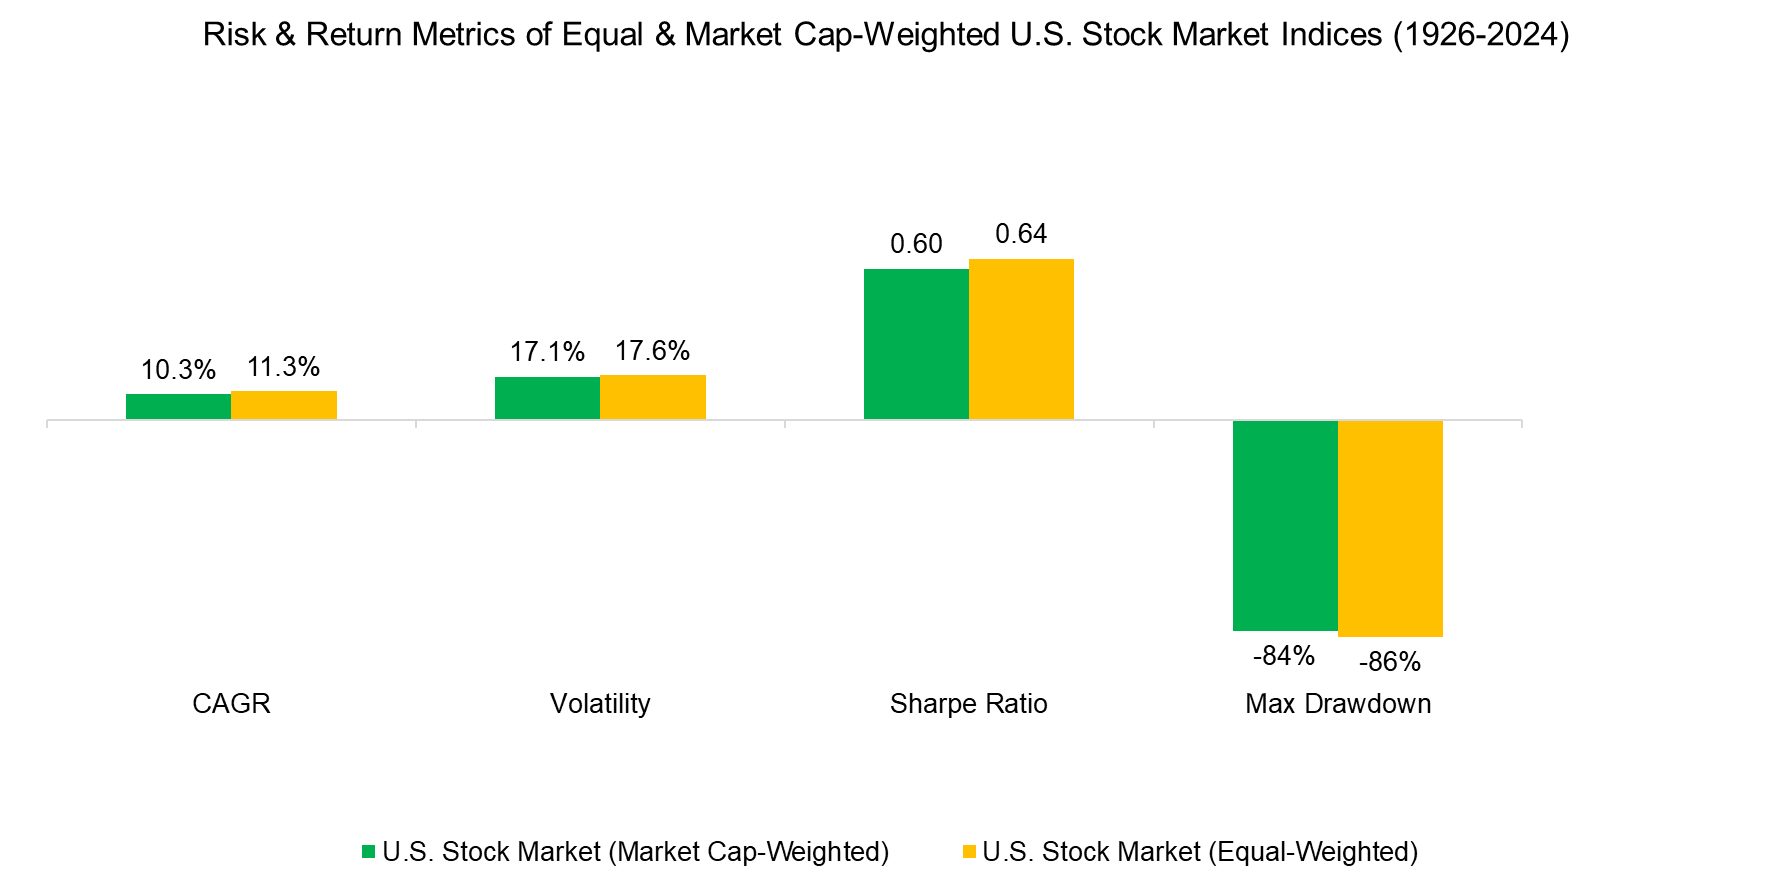
The performance chart of both portfolios over the past century demonstrates the superiority of equal-weighting, though the difference may appear minor due to the use of a logarithmic scale. However, calculating the CAGR from 1926 to 2024 reveals a meaningful annual outperformance of 1.0%.
The equal-weighted portfolio experienced a higher maximum drawdown during the Great Depression of the 1930s and greater volatility overall. Nonetheless, its higher CAGR resulted in a Sharpe ratio of 0.64, compared to 0.60 for the market cap-weighted portfolio.

Source: Kenneth R. French Data Library, Finominal
CAGRS BY DECADE
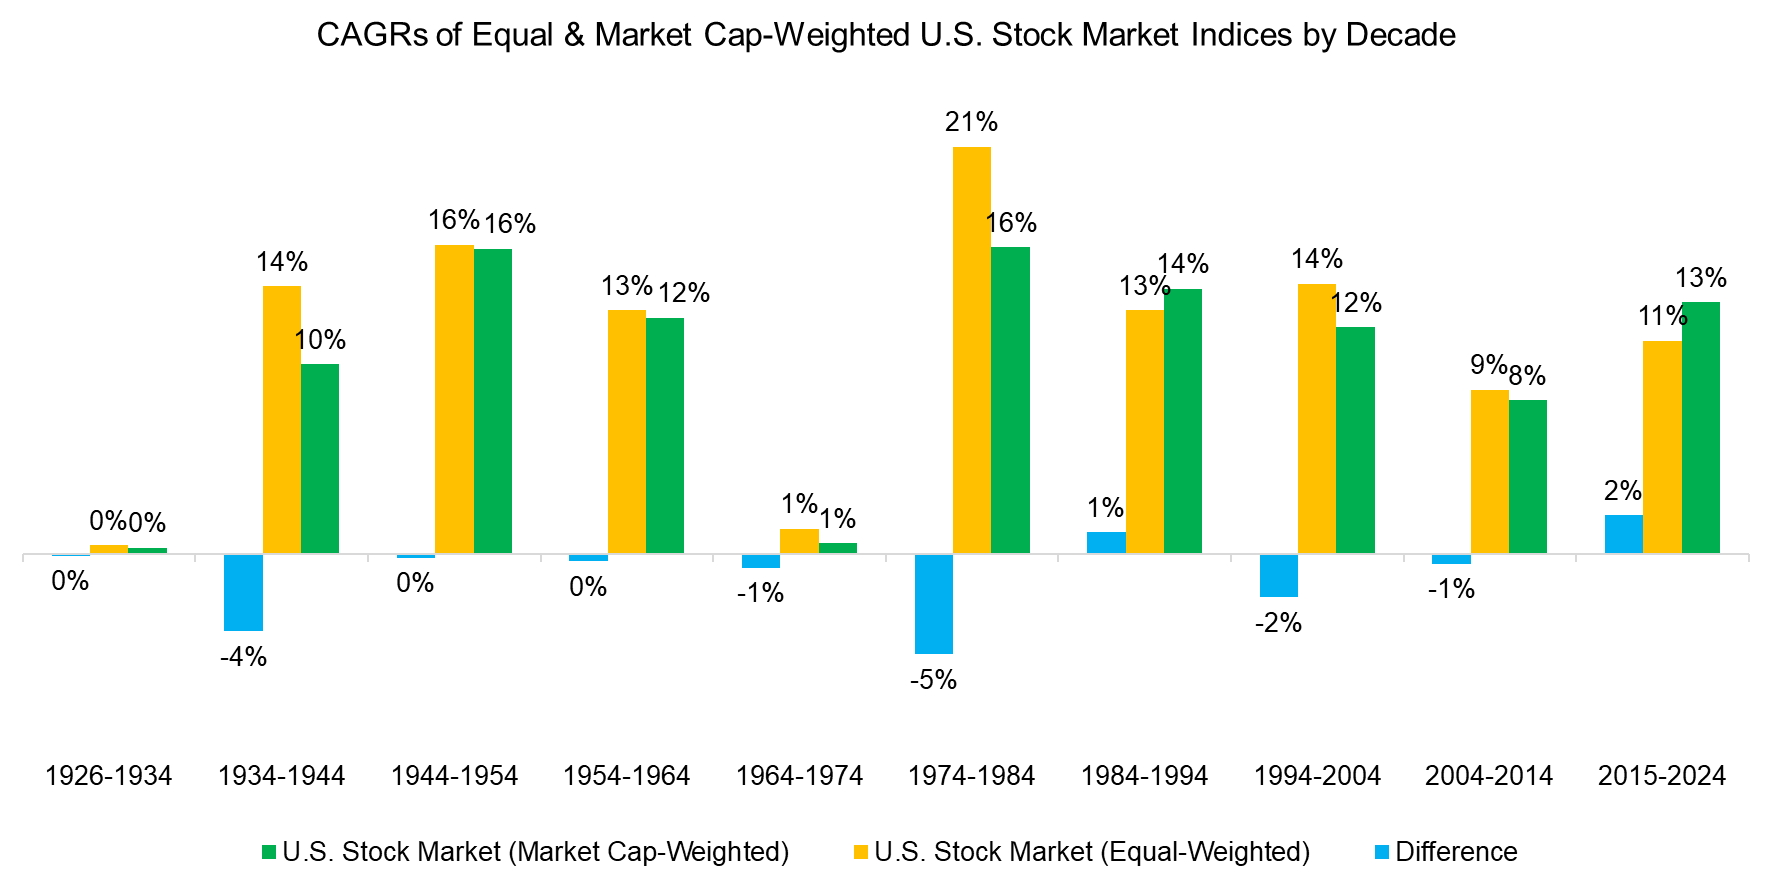
By analyzing the data further and calculating the CAGRs for each decade, we find that the equal-weighted portfolio outperformed the market cap-weighted portfolio in eight out of ten decades. This indicates that the recent outperformance of market cap-weighted indices is an anomaly rather than the norm.

Source: Kenneth R. French Data Library, Finominal
FURTHER THOUGHTS
This analysis presents a compelling case for equal-weighting stocks, but several factors challenge the results. The theoretical portfolios do not account for transaction costs, and equal-weighting necessitates trading in less liquid stocks. As a result, the returns of the equal-weighted portfolio are likely more overstated than those of the market cap-weighted portfolio.
While we can examine the realized returns of RSP versus SPY, the future difference in annual returns is likely to be smaller than the 1% outperformance observed over the past century.
Equal-weighting, which involves trading small-cap stocks, may not be practical for large investors. However, smaller, more agile investors can leverage their size to adopt this approach, viewing equal-weighting as a way to mitigate the high concentration risks currently present in the U.S. stock market.
RELATED RESEARCH
Cap-Weighted Benchmarks: Good Momentum Bets?
Equal vs Market Cap-Weighted Portfolios in Stock Market Crashes
The Juggernaut Index
The Fallacy of Betting on the Best Stock Market
Stock Selection versus Asset Allocation
What´s Better than the S&P 500?
Outperformance via Leverage
ABOUT THE AUTHOR
Nicolas Rabener is the CEO & Founder of Finominal, which empowers professional investors with data, technology, and research insights to improve their investment outcomes. Previously he created Jackdaw Capital, an award-winning quantitative hedge fund. Before that Nicolas worked at GIC and Citigroup in London and New York. Nicolas holds a Master of Finance from HHL Leipzig Graduate School of Management, is a CAIA charter holder, and enjoys endurance sports (Ironman & 100km Ultramarathon).
Connect with me on LinkedIn or X.

