Factor Valuations: Current vs Historical
What’s cheap, what’s expensive?
July 2024. Reading Time: 10 Minutes. Author: Nicolas Rabener.
SUMMARY
- Some factors are trading at historically low valuations
- Cheap stocks are cheap, high momentum and profitable ones are expensive
- However, it also depends which valuation multiple is used
INTRODUCTION
Cliff Asness of AQR Capital Management has been vocal for several years about traditional equity factors – like value – trading at historically cheap levels. More recently, a team at Research Affiliates echoed a similar sentiment, noting that many smart beta strategies appear attractively priced, stating, “we expect nearly every investing style featured here to outperform.”
But how do we determine whether a factor is cheap or expensive?
The standard method is to treat factors like individual stocks. For long-short factor portfolios, we evaluate the valuation spread between the long and short sides, then compare that spread to historical norms (read Cheap vs Expensive Factors). For long-only portfolios, we assess their valuation levels either relative to their own history, other factors, or the broader market.
In this article, we’ll examine how current valuations of factor-based portfolios stack up against their historical averages.
FACTOR VALUATIONS
Our analysis focuses on long-only, factor-based portfolios within the U.S. equity market, which includes currently approximately 2500 stocks. Specifically, we construct nine portfolios by selecting the top 10% of stocks based on different metrics: price-to-book (P/B) ratio, price-to-earnings (P/E) ratio, market capitalization, sales growth, earnings growth, volatility, leverage, momentum, and profitability.
While several valuation metrics exist to assess how cheap a stock or factor is, we use P/B and P/E ratios due to their broad applicability across the market.
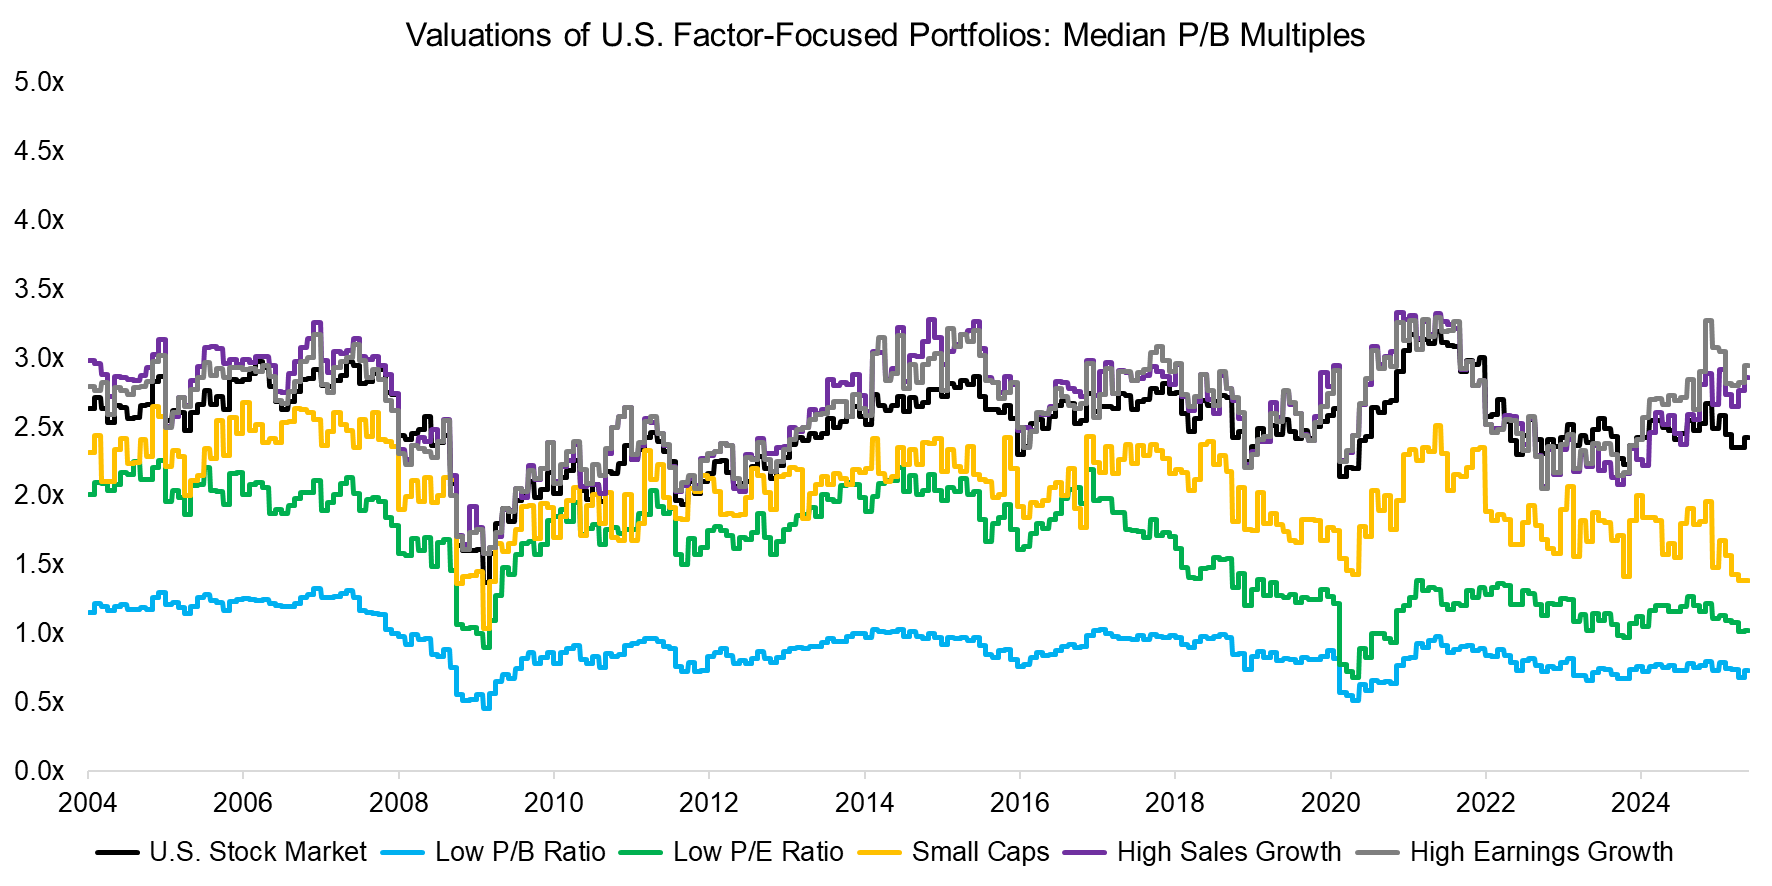
Portfolios based on high sales and earnings growth traded at similar P/B multiples to the overall U.S. stock market and followed similar valuation trends from 2004 to 2025. In contrast, portfolios emphasizing value (low P/B and P/E ratios) and small-cap stocks traded at significantly lower valuations and showed more distinct – and recently diverging – trends.
Source: Finominal
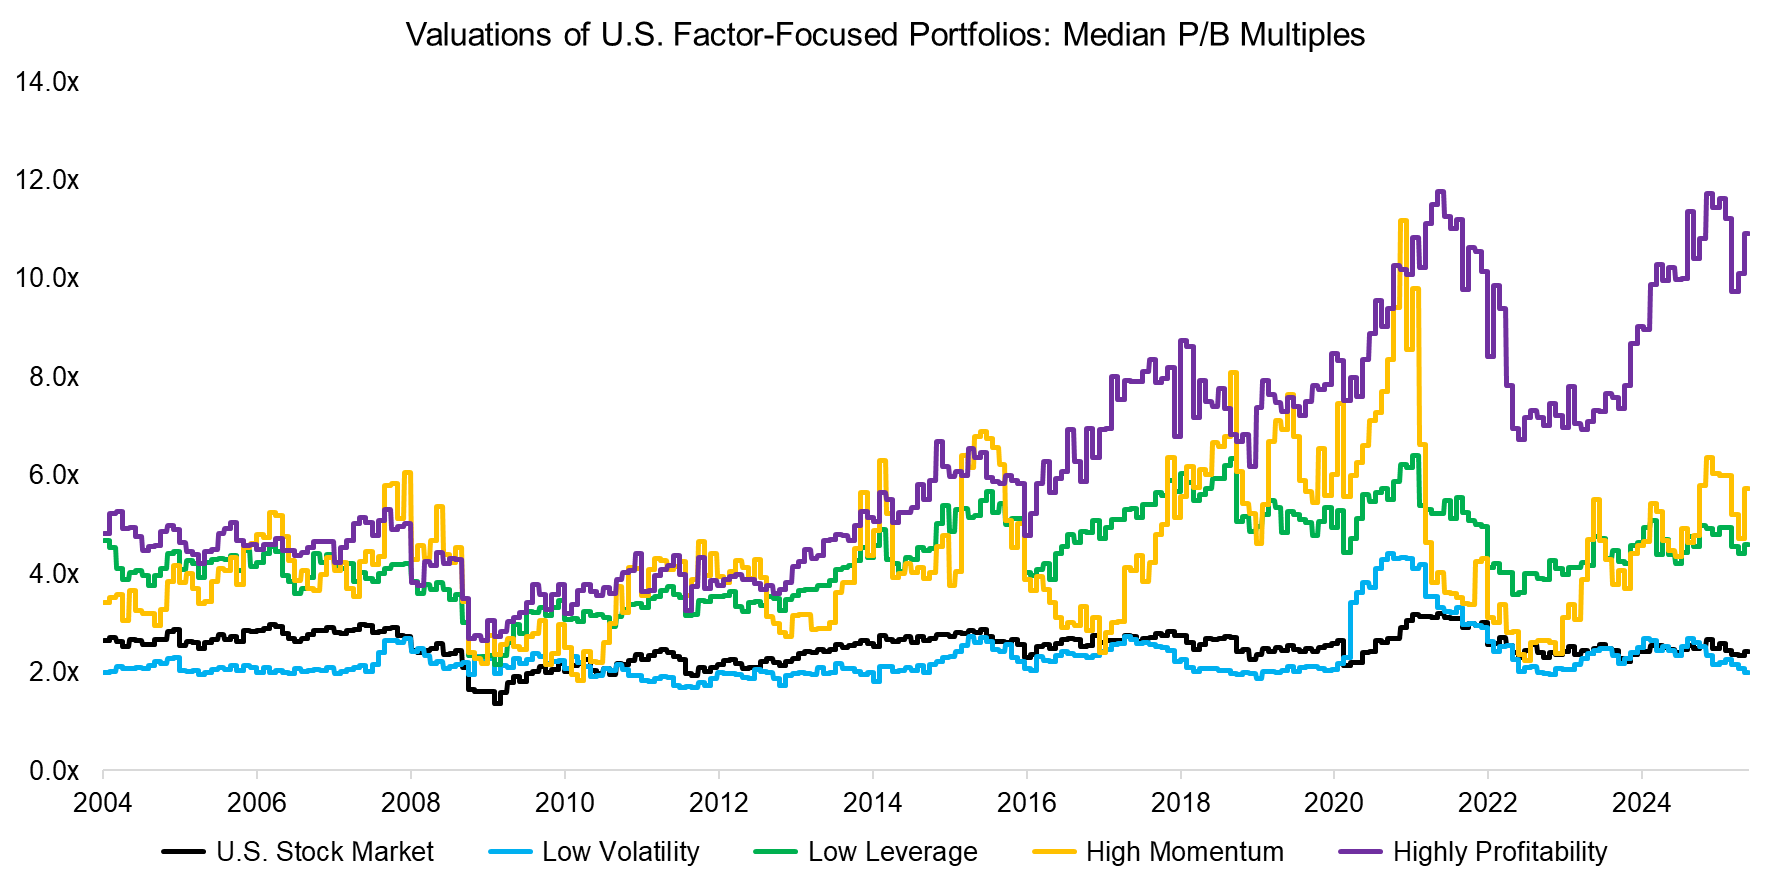
Turning to other factors, stocks with low leverage, high momentum, and high profitability exhibit significantly higher median P/B ratios compared to the overall U.S. stock market. A breakdown of these three portfolios by sector reveals an overweight in technology stocks.
Notably, some of these portfolios – particularly those focused on high profitability – appear to be trading at or near record-high valuation levels.
Source: Finominal
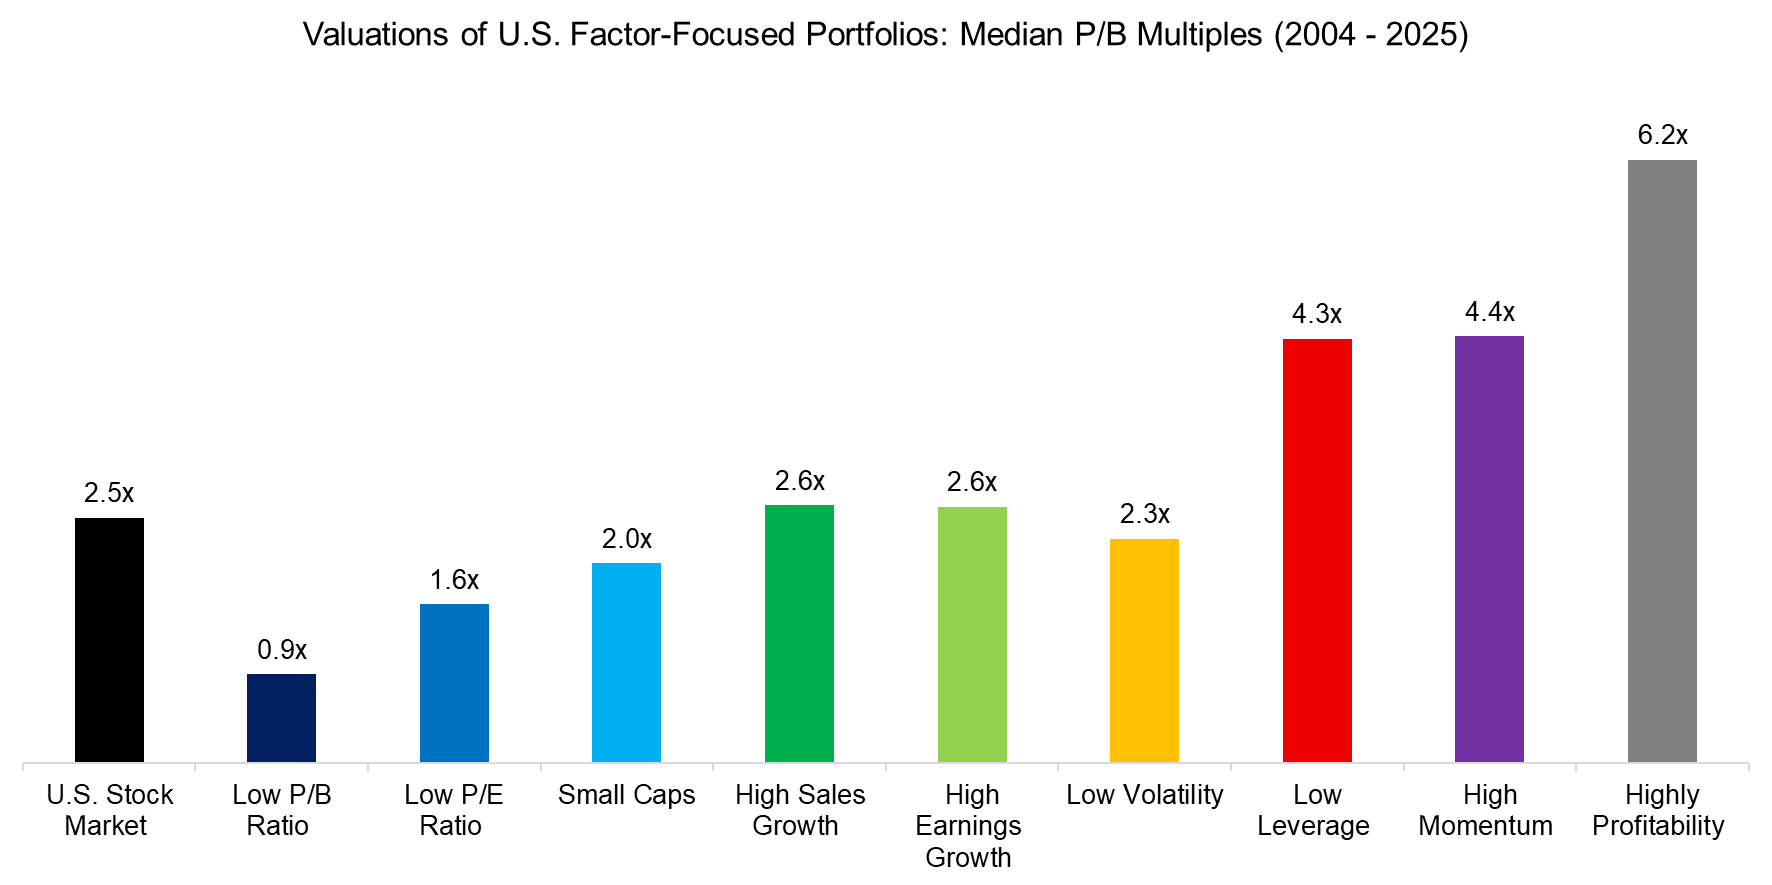
Next, we examine the median P/B ratios across all nine factor-based portfolios, which reveals significant variation in valuations by metric. As expected, the value portfolio (based on low P/B) has the lowest median ratio at 0.9x, compared to 2.5x for the overall U.S. stock market and 6.2x for the high profitability portfolio.
Source: Finominal
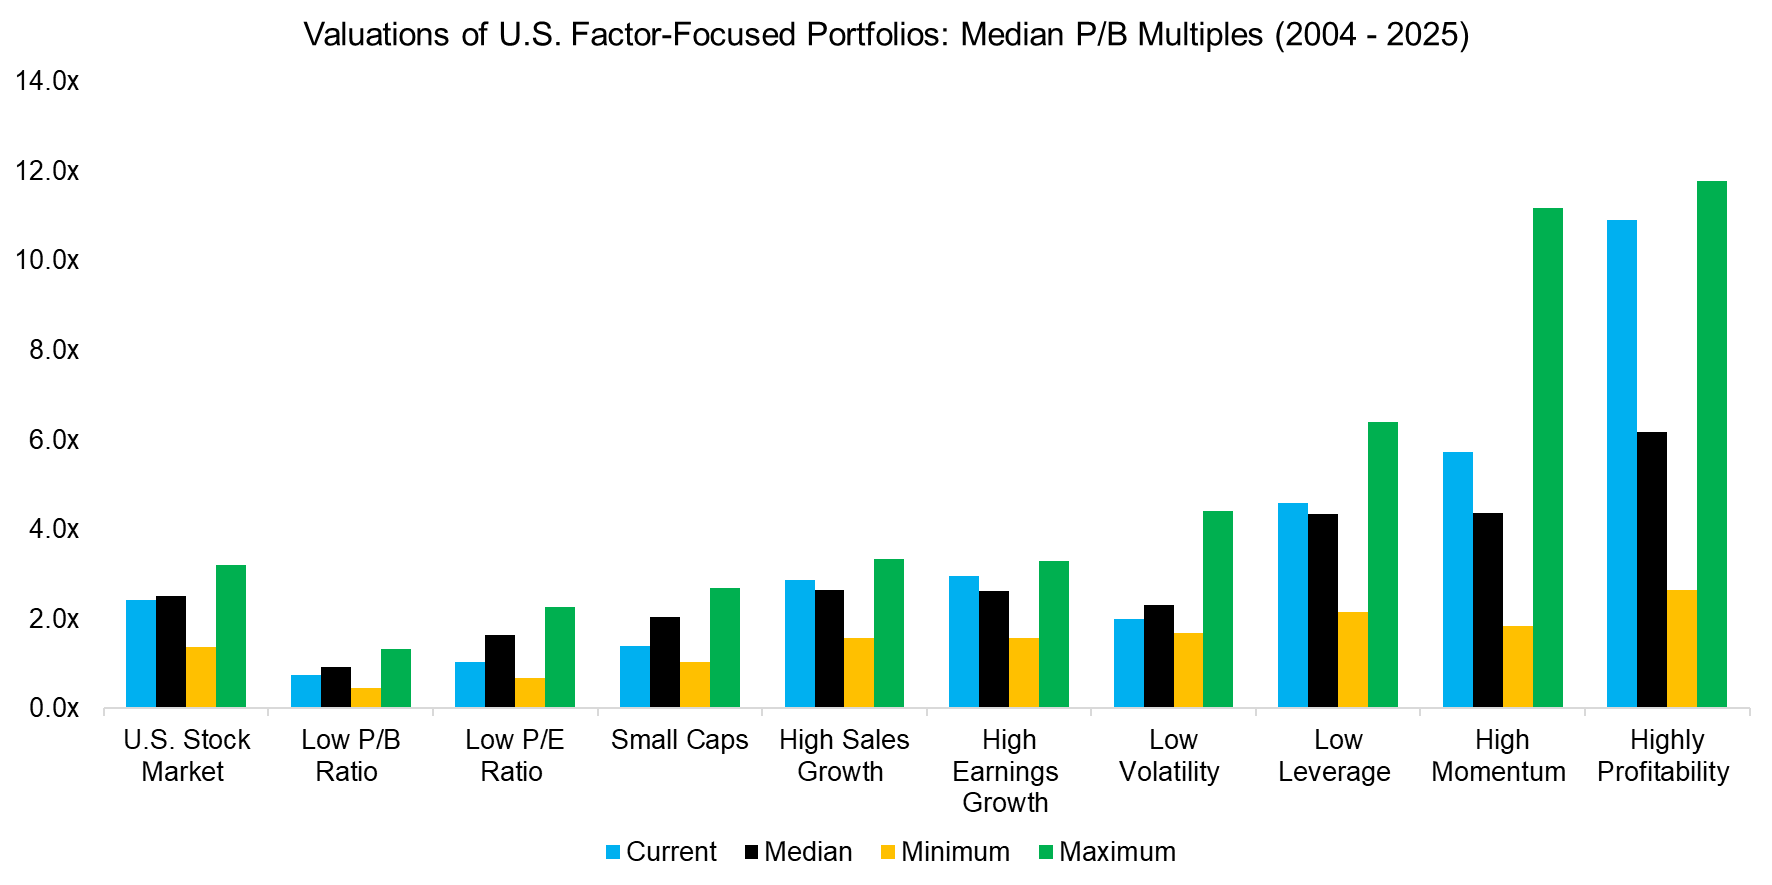
Comparing current valuations to historical medians, as well as to their historical minimums and maximums, reveals a wide divergence across factors. Value and small-cap stocks are trading below their historical valuation levels, indicating relative cheapness. In contrast, growth, low volatility, and low leverage stocks are priced in line with their historical norms. Meanwhile, high momentum and high profitability stocks are trading at elevated valuations, well above their historical averages.
Source: Finominal
P/E VERSUS P/B MULTIPLES
Shifting the lens to P/E ratios, a different picture emerges. Unlike the P/B-based analysis, none of the nine portfolios currently appear undervalued on a P/E basis; most are trading near or above their historical averages. In particular, portfolios focused on low P/E ratios, strong sales and earnings growth, and high profitability are all trading at elevated valuation levels.
The P/E multiples for the U.S. stock market may seem low, but this can be explained by using the median across a universe of approximately 2500 stocks and not a weighted average that gives more weights to the large and expensive stocks like Microsoft or Amazon.
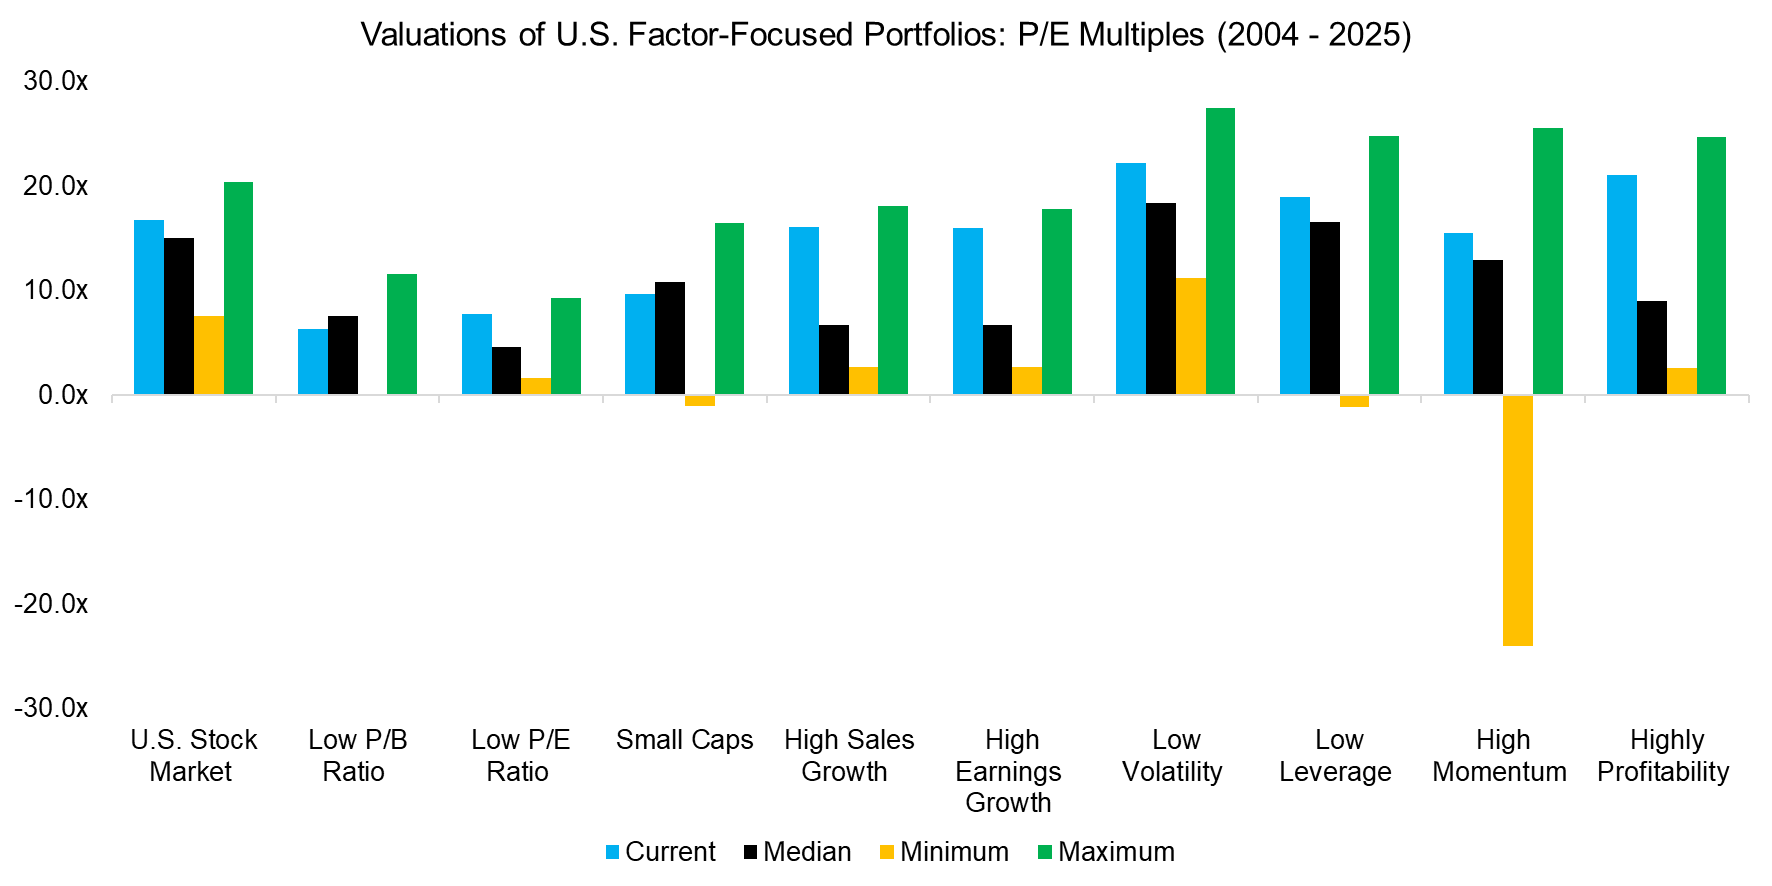
Source: Finominal
FURTHER THOUGHTS
Some stocks appear undervalued based on their P/B ratios relative to historical averages. However, this picture changes when considering P/E ratios, making valuation-based allocation challenging. Certain stocks – like highly profitable ones – look expensive across both metrics and may be best avoided.
That said, P/B ratios may not be a meaningful metric for evaluating technology companies, whose business models often render book value largely irrelevant. Moreover, valuations are generally unreliable for predicting short- or medium-term returns, and are only relevant over the long run.
RELATED RESEARCH
Cheap vs Expensive Factors
Value & Quality Factor Valuations
There is Value in the Value Factor
Measuring Factor Crowding via Valuations
Musing About S&P 500 Valuations
Myth-Busting: Low Rates Don’t Justify High Valuations
Equal vs Market Cap-Weighted Portfolios in Stock Market Crashes
This Time Is Different!?
Are Stock Markets becoming more Correlated?
Market Timing with Multiples, Momentum & Volatility
ABOUT THE AUTHOR
Nicolas Rabener is the CEO & Founder of Finominal, which empowers professional investors with data, technology, and research insights to improve their investment outcomes. Previously he created Jackdaw Capital, an award-winning quantitative hedge fund. Before that Nicolas worked at GIC and Citigroup in London and New York. Nicolas holds a Master of Finance from HHL Leipzig Graduate School of Management, is a CAIA charter holder, and enjoys endurance sports (Ironman & 100km Ultramarathon).
Connect with me on LinkedIn or X.

