Private Equity Without the Lag
Creating an index of listed private equity funds with daily returns
August 2025. Reading Time: 10 Minutes. Author: Nicolas Rabener.
SUMMARY
- Listed private equity funds can be used to create a PE index with daily returns
- Highly correlated to private market indices
- PE funds have not outperformed the S&P 500 over the last decade
INTRODUCTION
Since publishing our initial research articles on private equity in 2018 and 2020 (read Private Equity: The Emperor has No Clothes and Private Equity Is Still Equity, Nothing Special Here), one question has come up repeatedly: Can public equities be used to replicate private equity returns?
While the idea is appealing, the private equity industry has evolved significantly since its early days in the 1980s. Back then, when capital was scarce, pioneers like KKR focused on acquiring small, inexpensive, and stable companies using leverage. Today, with over $4 trillion in assets under management, the industry’s investment style has diversified substantially, encompassing a wide range of company types and deal structures. As a result, replicating private equity returns using stocks has become increasingly difficult.
Recently, Dan Rasmussen of Verdad Advisors highlighted a relatively overlooked segment of the market: a group of listed private equity funds traded on the London Stock Exchange. These funds invest directly in private equity deals or in PE funds and, because they trade publicly, offer daily pricing – making them suitable building blocks for a private equity funds index with daily returns.
In this research article, we explore the construction of such an index using listed private equity vehicles.
LISTED PRIVATE EQUITY FUNDS
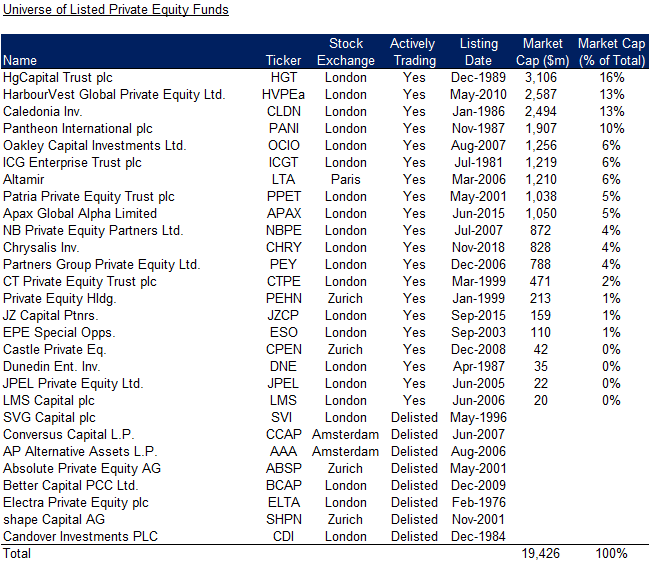
The listed private equity funds universe is small with only 28 securities, but includes some well-known names like Apax, HgCapital, and Partners Group. Only 20 remain actively traded on European exchanges, while 8 have been delisted. The fact that many have disappeared highlights an important truth: not everything private equity touches turns to gold. Including these delisted funds is essential to avoid survivorship bias, a common issue in private market indices where underperforming funds often stop reporting results as their fundraising prospects decline.
Source: Finominal
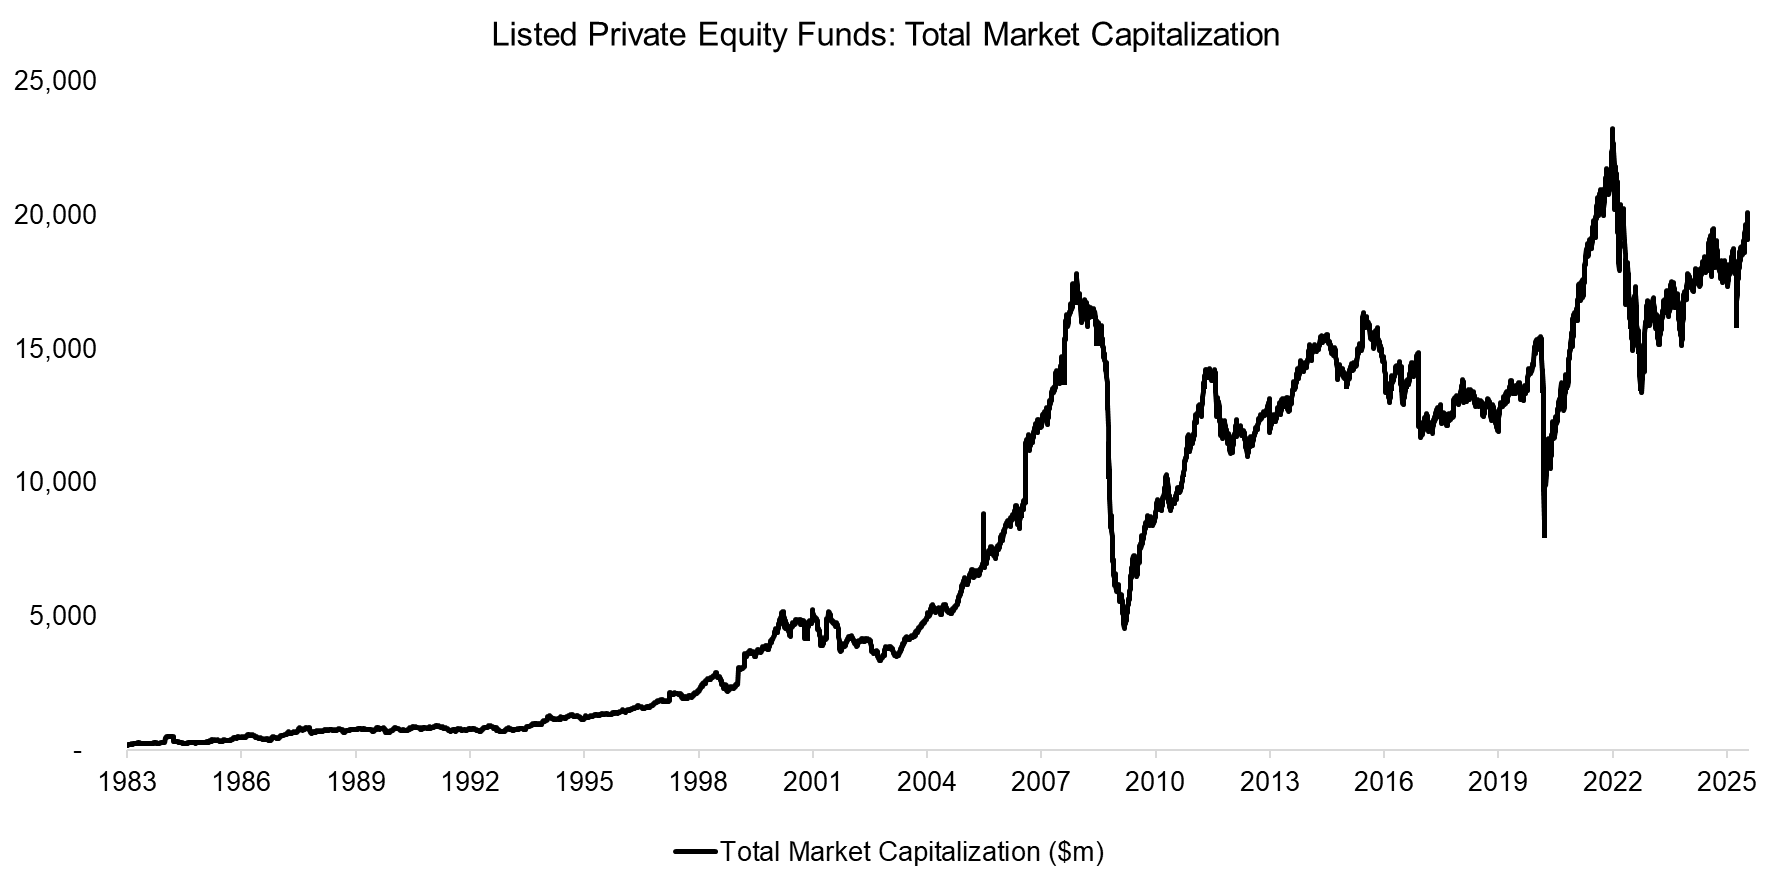
With a combined market capitalization of only $19 billion, this segment is modest in scale compared to the trillions allocated to traditional private equity funds and cannot be considered a broad success story. Among the currently listed funds, all have market capitalizations smaller than $3.5 billion – placing them firmly in the small- and mid-cap territory from a public market perspective. However, it’s important to note that these vehicles provide investors with access to globally diversified private equity portfolios, rather than exposure to single companies focused on specific products or services.
Source: Finominal
PRIVATE EQUITY PERFORMANCE
We construct a market capitalization-weighted index using the 28 listed private equity funds, with semi-annual rebalancing. While the earliest fund in the group was listed in 1983, it wasn’t until 2000 that the universe expanded to include more than 10 concurrently listed companies – providing a more meaningful basis for index construction from that point onward.
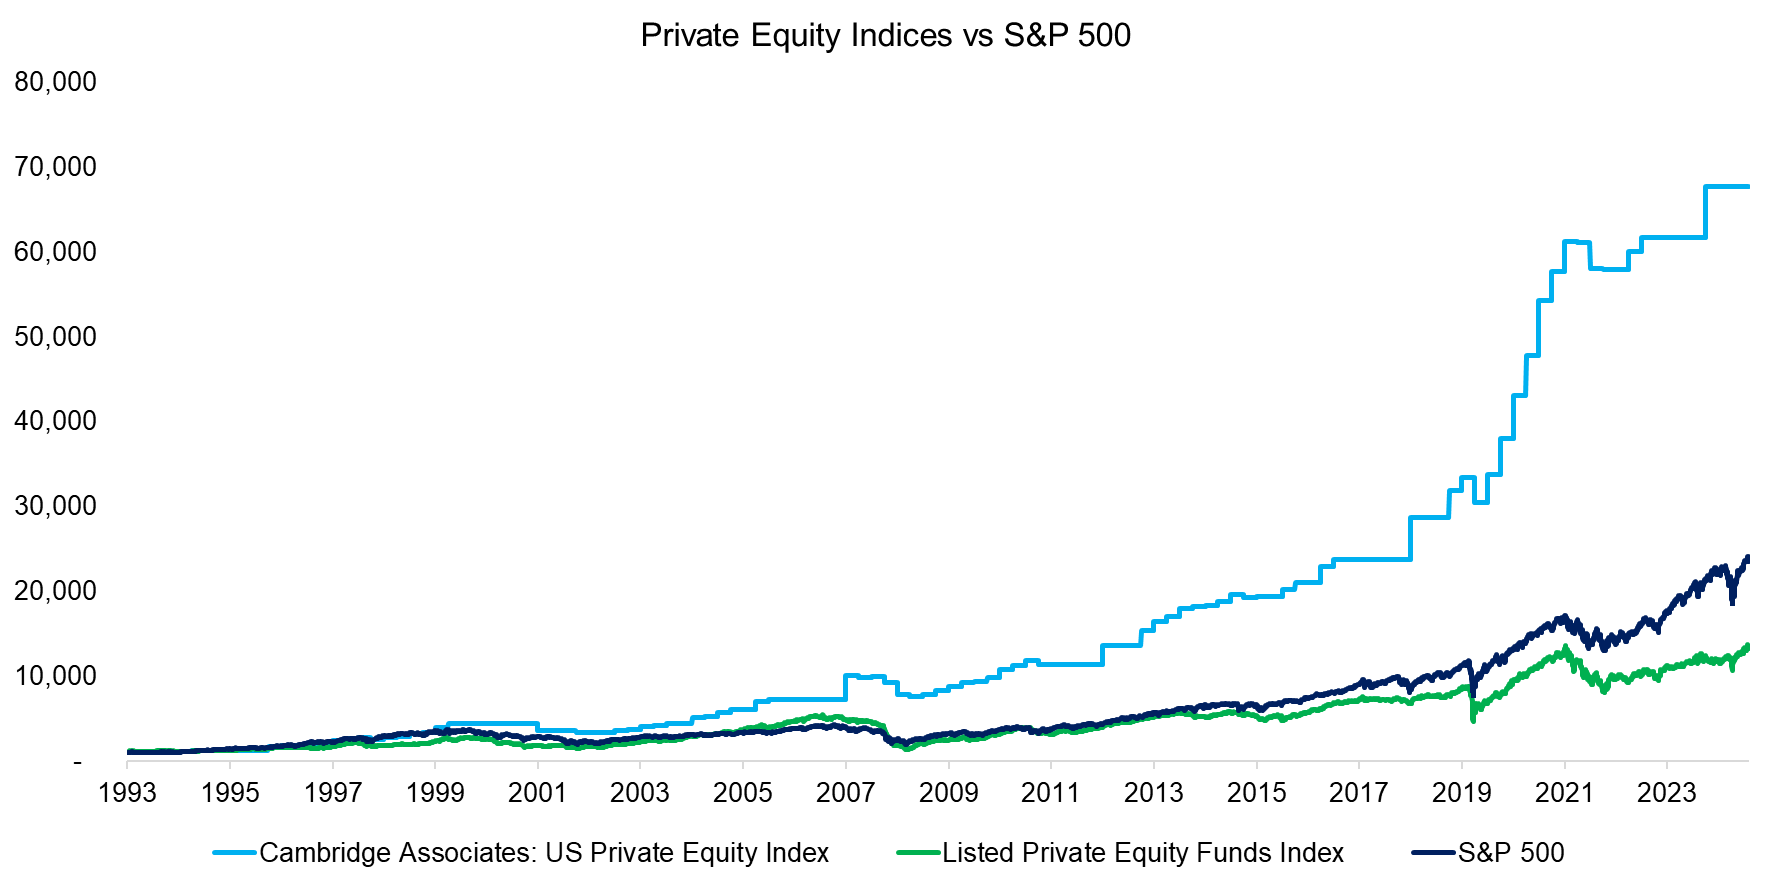
We compared this index with the S&P 500, and an index constructed using quarterly IRRs for the U.S. Private Equity Industry from Cambridge Associates, which are available since 1993. Reviewing the returns of these three indices reveals a divergent perspective. The Cambridge Associates US Private Equity Index has generated a CAGR of 14.7% since 1993, compared to 10.5% for the S&P 500 and 8.5% for the Listed Private Equity Funds Index.
How can we explain the discrepancy between the two private equity indices? IRRs are money-weighted returns and, while they are the standard metric used by private equity funds to report performance, using them for index construction is technically incorrect and tends to overstate returns. Additionally, the Cambridge Associates US Private Equity Index is subject to survivorship bias, as PE fund managers typically stop reporting to database providers like Cambridge Associates when performance deteriorates significantly.
Source: Finominal, Cambridge Associates
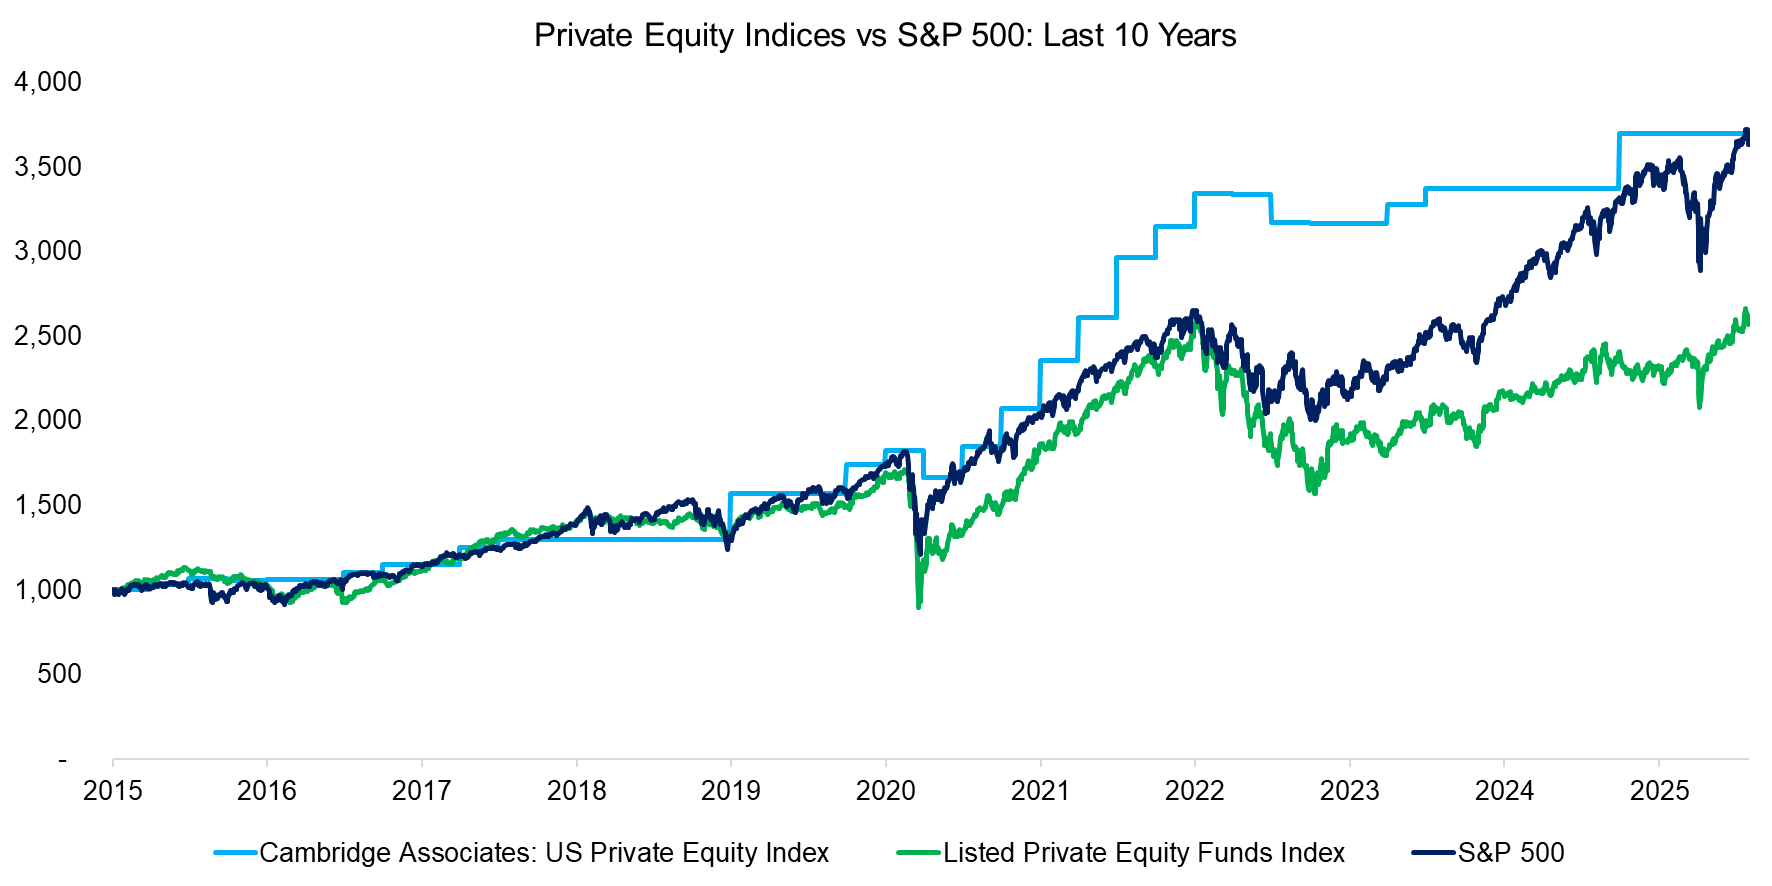
Investors have long believed that private equity funds, as reflected by private market indices, have consistently outperformed the S&P 500 since the industry’s inception in the 1980s. However, the Listed Private Equity Funds Index indicates that this has not been the case over the past decade, with private equity funds generating significantly lower returns.
This shift can be attributed to the dramatic expansion of the private equity industry, which now manages over $4 trillion in assets. With so much capital chasing relatively few deals, over half of all transactions are now conducted between private equity fund managers themselves. Furthermore, the two fundamental drivers that have historically propelled private equity – increasing valuation multiples and decreasing interest rates – are no longer present.
Even when looking at the IRR-based Cambridge Associates U.S. Private Equity Index, returns over the past 10 years have been roughly in line with the S&P 500.
Source: Finominal, Cambridge Associates
CORRELATION ANALYSIS
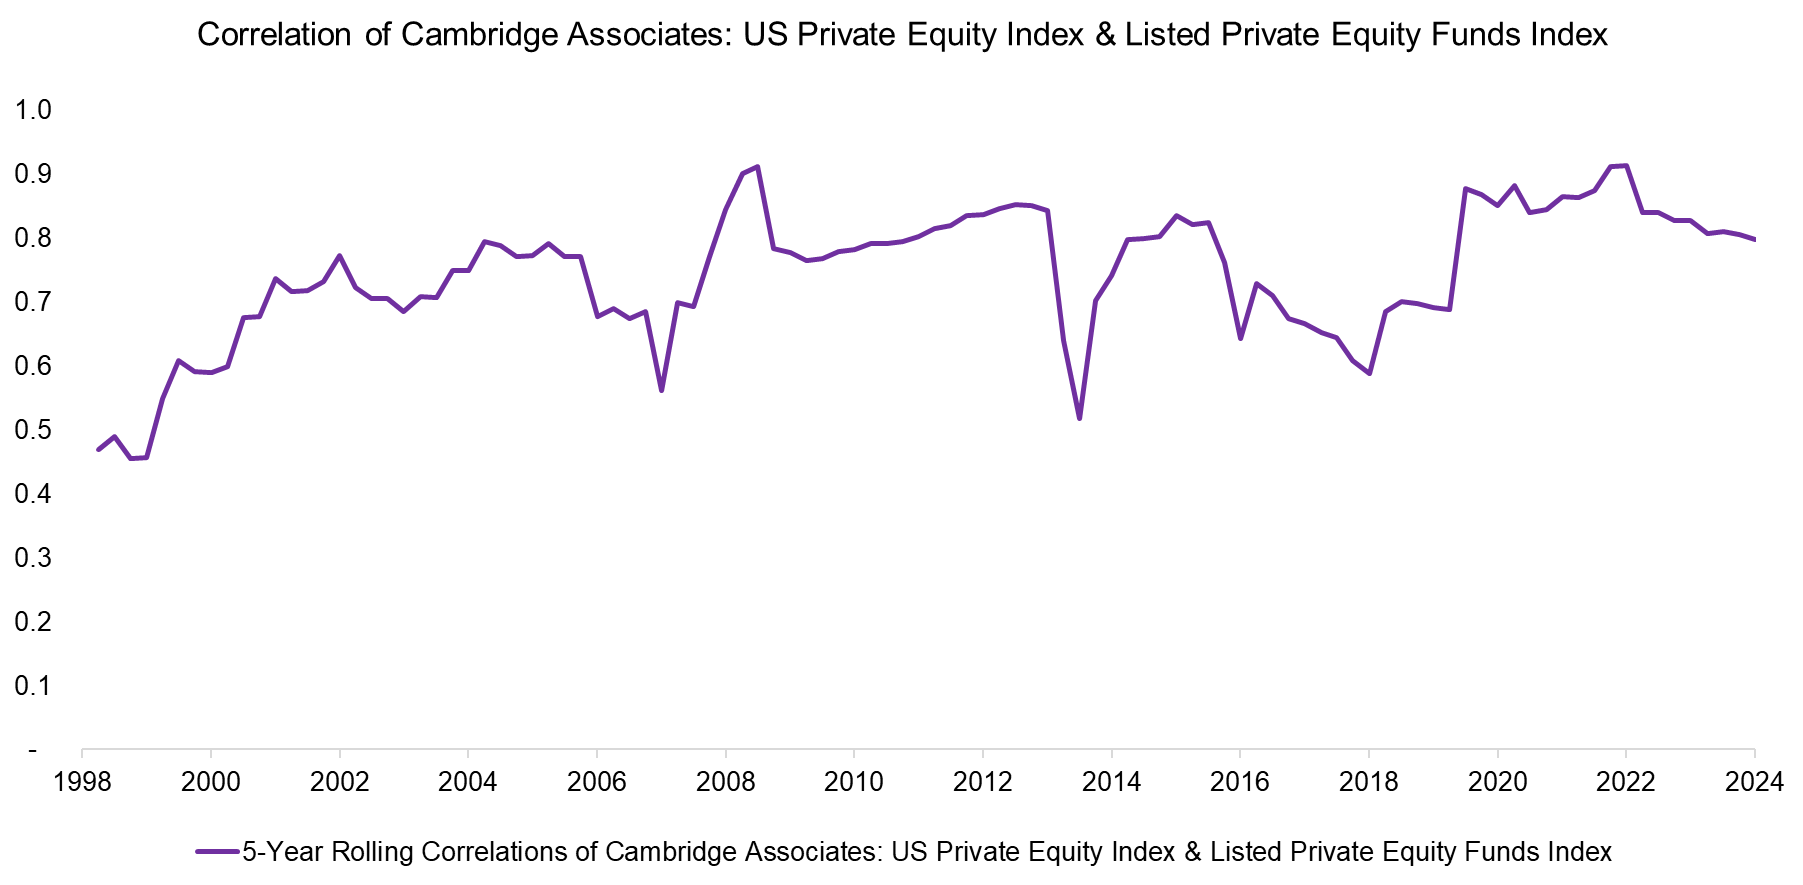
Finally, we calculate the 5-year rolling correlation between the Cambridge Associates U.S. Private Equity Index and the Listed Private Equity Funds Index, which has risen from 0.5 to 0.8 over time. This increase largely reflects the growing number of listed private equity funds and the expanding breadth of their holdings, making the combined portfolio more representative of the broader private equity industry. In other words, listed private equity funds have become a viable proxy for tracking the performance of private PE funds.
Source: Finominal, Cambridge Associates
FURTHER THOUGHTS
The private equity industry, like real estate, venture capital, and other private markets, suffers from a lack of transparency due to the absence of publicly available, high-quality benchmark indices to track performance. The Listed Private Equity Funds Index changes this by providing investors with a daily, more realistic view of private equity performance – one that fully accounts for poorly performing funds.
Most institutional investors have significant allocations to private equity and may not appreciate the transparency as it suggests investing in PE funds is a significant misallocation of capital from public to private markets. However, it is better to revise beliefs than ignore facts.
RELATED RESEARCH
Private Equity: The Emperor has No Clothes
Private Equity: Fooling Some People All the Time?
Private Equity Is Still Equity, Nothing Special Here
The Case Against Private Markets
Listed Private Equity ETFs: The Real Deal?
Venture Capital: Worth Venturing Into?
BDCs: Better Don’t Choose?
The Case Against REITs
A Crescendo in Private Credit?
Do Activist Investors Create Value?
Myth Busting: Alts’ Uncorrelated Returns Diversify Portfolios
What´s Better than the S&P 500?
Outperformance via Leverage
Complexity is the Enemy of Investing
Stock Selection versus Asset Allocation
ABOUT THE AUTHOR
Nicolas Rabener is the CEO & Founder of Finominal, which empowers professional investors with data, technology, and research insights to improve their investment outcomes. Previously he created Jackdaw Capital, an award-winning quantitative hedge fund. Before that Nicolas worked at GIC and Citigroup in London and New York. Nicolas holds a Master of Finance from HHL Leipzig Graduate School of Management, is a CAIA charter holder, and enjoys endurance sports (Ironman & 100km Ultramarathon).
Connect with me on LinkedIn or X.

