Quality vs Growth Factors
Why do high ROE stocks outperform high-growth ones?
- Quality and growth factor returns differ between research and reality
- Most generated negative excess returns
- Profitability was profitable, which can be partially attributed to the tech bias
INTRODUCTION
Based on the body of research available, factor investing remains the only approach with a strong record of delivering long-term outperformance. We can also explain – reasonably and logically – why it should work. For instance, value investing involves buying companies that are widely disliked, often because of self-inflicted setbacks or industry headwinds. Investors, in essence, get paid for pain.
Similarly, investors are compensated for holding “boring” stocks that exhibit low volatility. Conversely, there’s little reason to expect a premium from high-growth stocks. Yet the Fama–French five-factor model includes profitability as a factor – one that has historically delivered a positive excess return (read The Odd Factors: Profitability & Investment). This raises a question: why should investors earn a premium for owning highly profitable companies that are neither boring nor cheap?
In this article, we examine the quality factor versus the growth factor to explore that puzzle.
QUALITY VS GROWTH FACTORS (LONG-SHORT)
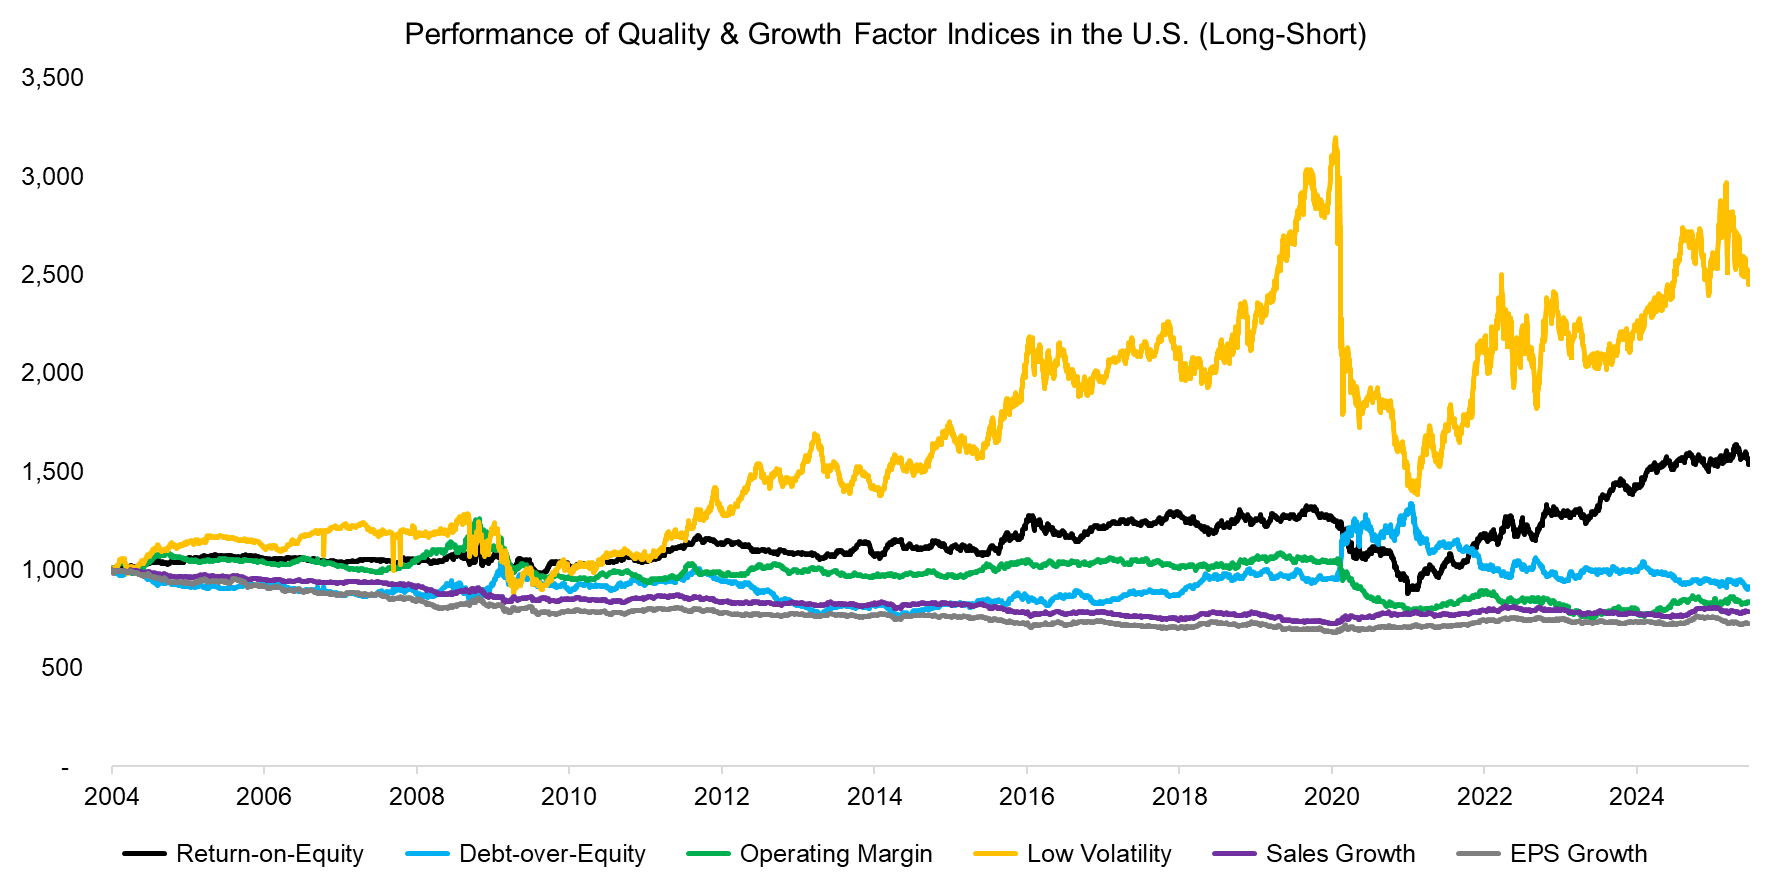
We focus on the U.S. stock market, constructing several quality and growth factors by selecting the top and bottom 10% of stocks ranked by various metrics. Companies with market capitalizations below $1 billion are excluded and stocks are equal-weighted. Portfolios are rebalanced monthly, incorporate transaction costs of 10 basis points, and are constructed to be beta-neutral.
From 2004 to 2025, only two of our six long-short factors – return on equity and low volatility – produced positive excess returns, consistent with findings in both academic and industry research. Leverage, operating margin, and sales or earnings growth did not deliver a positive premium.
Source: Finominal
QUALITY VS GROWTH FACTORS (LONG-ONLY)
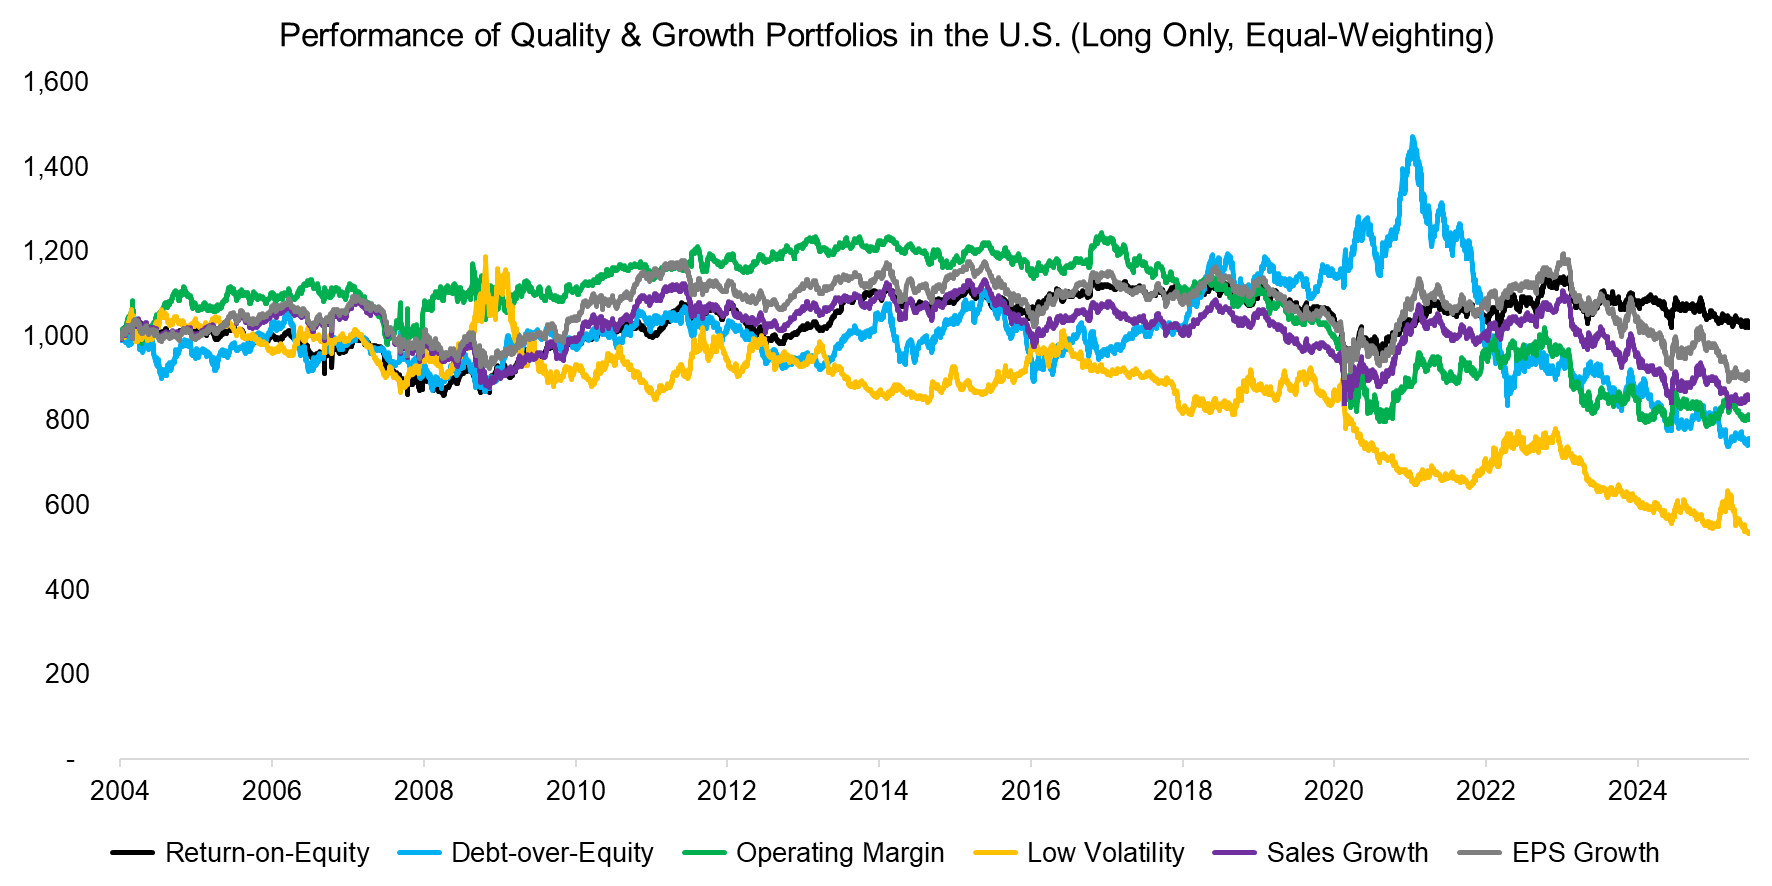
Although long-short factor indices are informative, most investors hold long-only portfolios. We therefore calculate the excess returns of equal-weighted long-only portfolios by subtracting the returns of the market capitalization-weighted U.S. stock market. These portfolios are comprised of stocks with the highest profitability, least risk, lowest leverage, and highest growth characteristics.
This finding completely changes the perspective: while the low-volatility factor delivered the highest return in its long-short form, it produced the lowest return when applied only to the long side. Part of this discrepancy can be attributed to the absence of returns from the short side, as well as the lack of leverage in long-only portfolios. Since low-volatility stocks typically have a beta below 1, they tend to underperform the broader market during bullish periods.
Source: Finominal
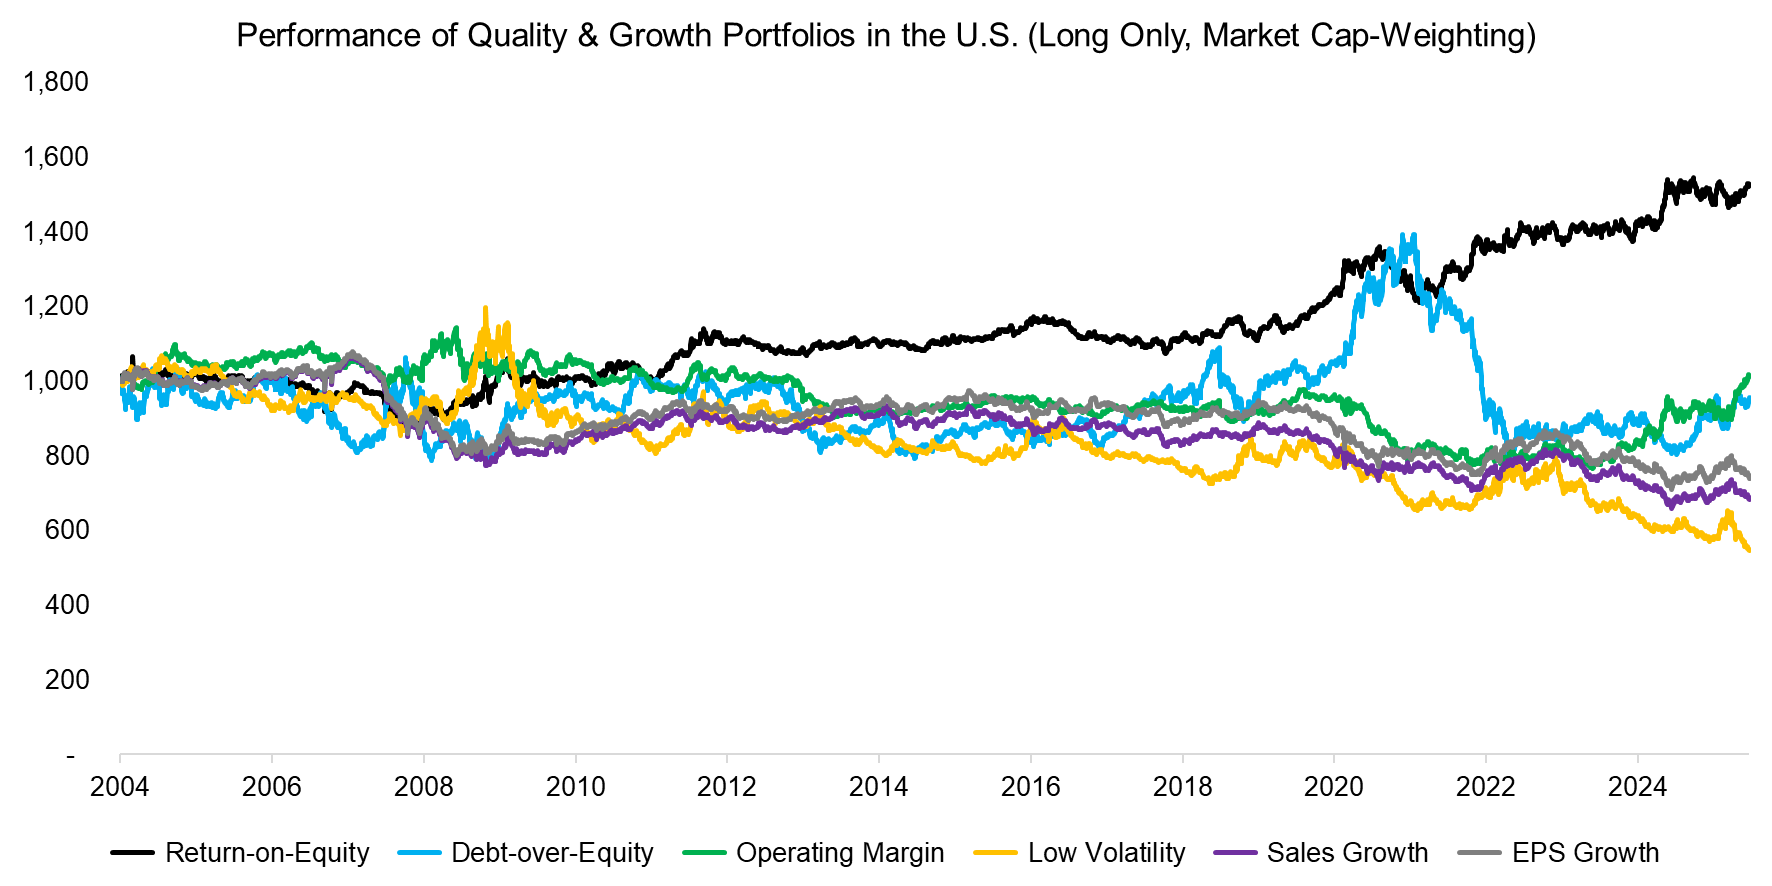
A second reason for the discrepancy between long–short and long-only indices lies in the weighting methodology. Factor portfolios are typically equal-weighted to minimize size bias, whereas most smart beta products in practice are weighted by market capitalization. Somewhat ironically, investors want outperformance, but not with a large tracking error, which is naturally difficult to achieve post fees.
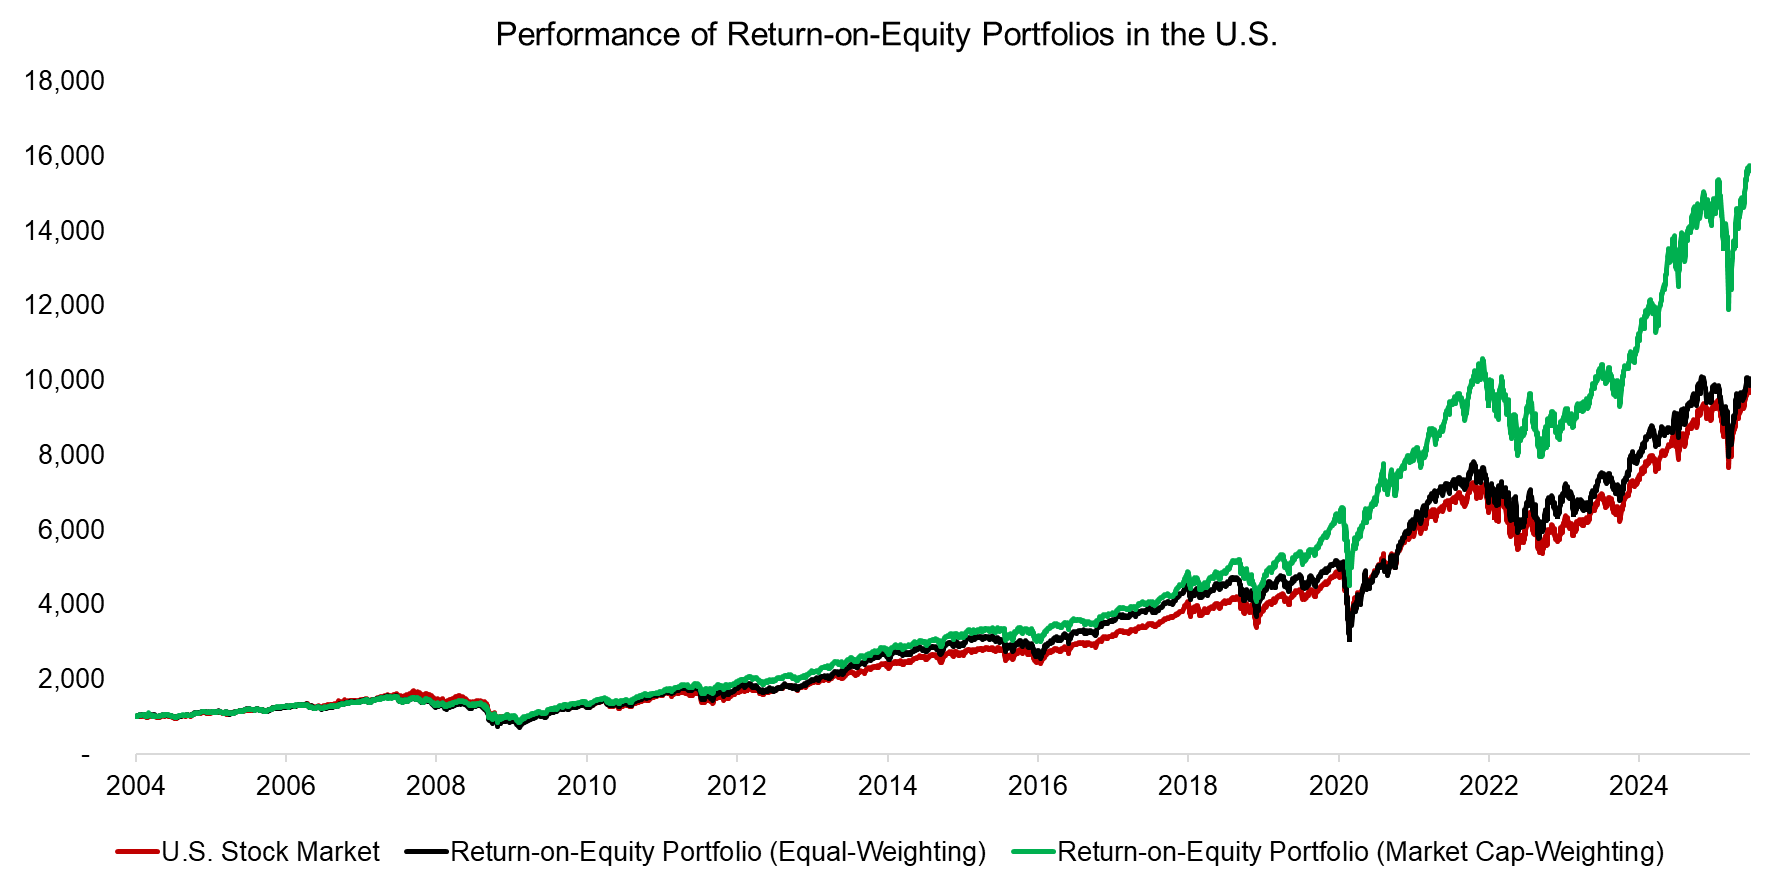
Shifting from equal weighting to market-cap weighting leaves most factor results unchanged – except in the case of profitability, where the difference is significant. Selecting the most profitable stocks and weighting these by their market capitalizations makes a profitable investment strategy.
Source: Finominal
Reviewing the performance of equal-weighted and market capitalization-weighted long-only portfolios shows that they performed similarly between 2004 and 2012; however, after that period, the market-cap-weighted portfolios significantly outperformed. What explains this divergence?
Source: Finominal
BREAKDOWN BY SECTORS
Between 2004 and 2025, the average price-to-book multiple of highly profitable stocks was 6.2x, compared to 2.5x for the overall stock market – indicating that high-ROE stocks seem to represent anti-value stocks.
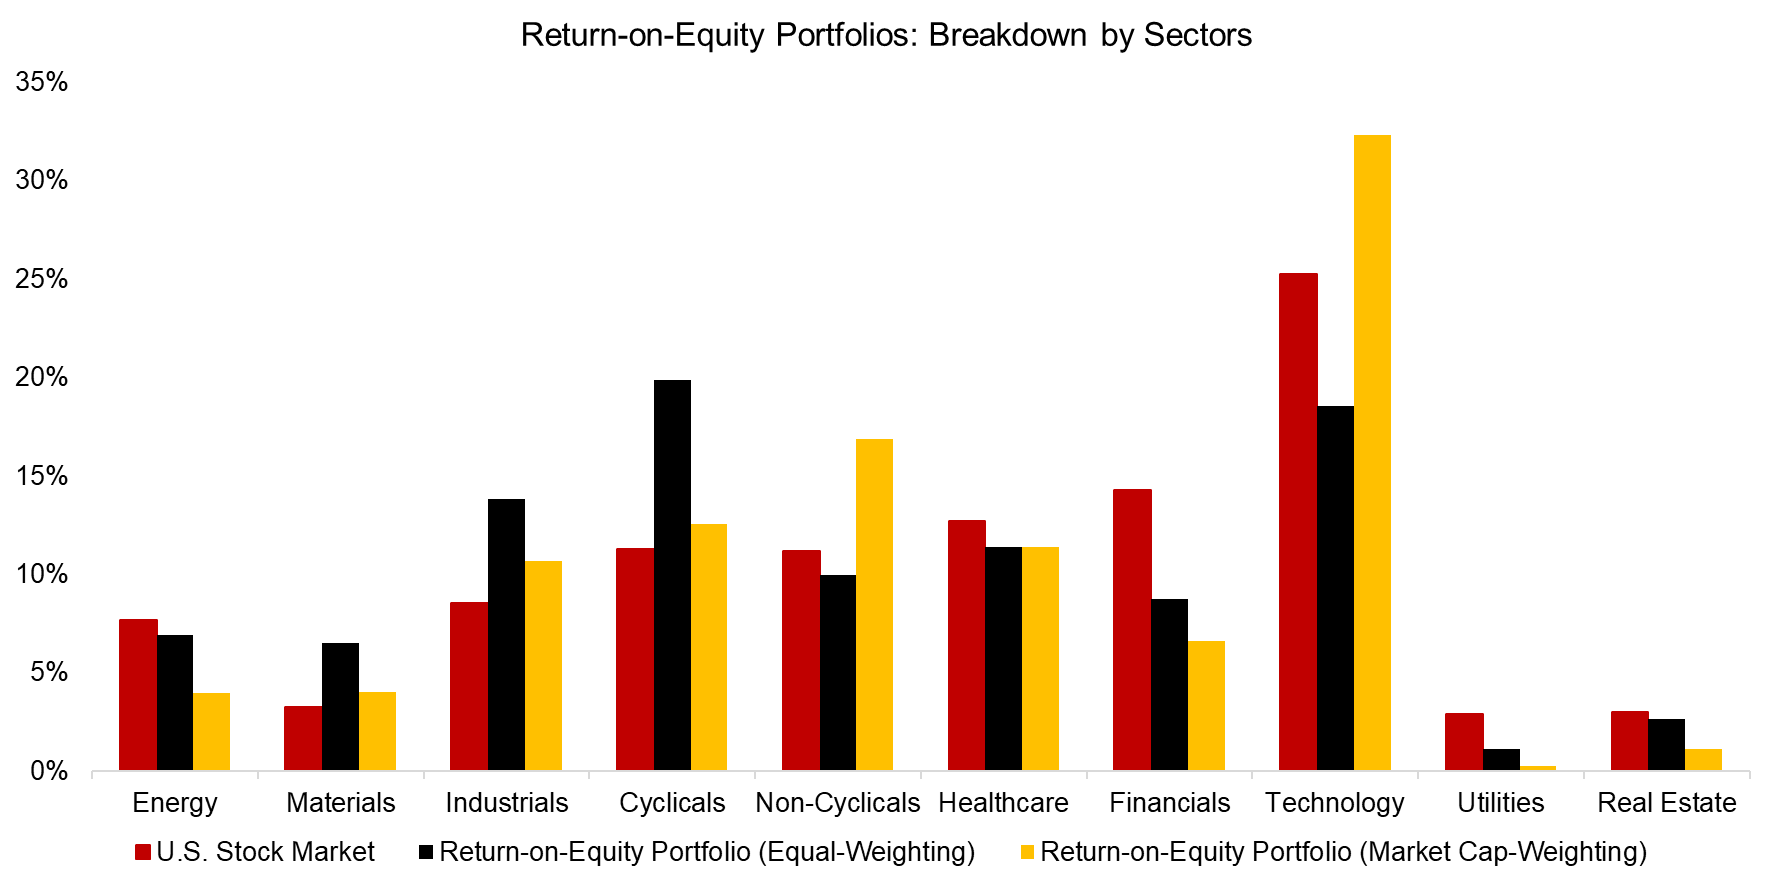
A sector breakdown helps explain why equal-weighting highly profitable stocks underperformed relative to market-cap weighting: equal-weighted portfolios tend to underweight technology stocks, whereas market-cap-weighted portfolios are overweight this sector. Examining the market-cap-weighted portfolios reveals significant holdings in tech companies such as Apple, NVIDIA, and Meta, which have delivered spectacular performance in recent years.
Source: Finominal
FURTHER THOUGHTS
As noted earlier, there is a significant distinction between long-short and long-only factor investing. Assets under management in long-short funds total approximately $5 billion, whereas smart beta products account for roughly $1 trillion (read Market-Neutral versus Smart Beta Factor Investing).
Does this article offer new insights to investing research? Unfortunately, no. Most quality and growth factors produced negative returns in both long–short and long-only formats – profitability is the only factor that remained consistently positive. While these returns can be attributed to the technology sector in this analysis, the Fama–French profitability premium dates back to 1990 and has been persistently positive in the U.S. and Europe, though not in Japan. This discrepancy remains an ongoing puzzle.
RELATED RESEARCH
The Odd Factors: Profitability & Investment
Market-Neutral versus Smart Beta Factor Investing
Factor Investing Is Dead, Long Live Factor Investing!
The Case Against Factor Investing
Smart Beta vs Alpha + Beta
Combining Smart Beta Funds May Not Be Smart
Smart Beta: Broken by Design?
Factor Exposure Analysis 113: Profitability vs Leverage Factors
Factor Exposure Analysis 112: Quality vs Growth Factors
Growth ETFs: Performance & Factor Exposures
What Are Growth Stocks?
Quality Factor: Zero Alpha for Most Investors?
Quality in Small versus Large-Cap Stocks
ABOUT THE AUTHOR
Nicolas Rabener is the CEO & Founder of Finominal, which empowers professional investors with data, technology, and research insights to improve their investment outcomes. Previously he created Jackdaw Capital, an award-winning quantitative hedge fund. Before that Nicolas worked at GIC and Citigroup in London and New York. Nicolas holds a Master of Finance from HHL Leipzig Graduate School of Management, is a CAIA charter holder, and enjoys endurance sports (Ironman & 100km Ultramarathon).
Connect with me on LinkedIn or X.

