Factor Exposure Analysis 117: Risk Contribution Analysis
Intuitive vs quant risk reports
November 2025. Reading Time: 10 Minutes. Author: Nicolas Rabener.
SUMMARY
- The choice of indices and regression type leads to different risk contributions
- Technically, most risk of equity funds can be attributed to a single variable
- Elastic net is advantageous over linear and lasso regressions
INTRODUCTION
In our recent research article Factor Exposure Analysis 116: Residualized Indices, we explored a method to reduce correlations among independent variables, such as country stock market indices, in regression analyses. Practically, this involved a two-step process: first, removing the global stock market effect, and second, residualizing country indices against other countries and sector indices against other sectors. The result is a set of indices that are “purer” than the raw indices.
Theoretically, these residualized indices are better suited for return and risk contribution analysis, though they can become more abstract. For example, the CAGR of the MSCI Japan Index dropped from 6.3% to 0.6% between 2018 and 2025 when fully residualized.
In this article, we compare the use of raw versus residualized indices in a risk contribution analysis across a selection of funds.
REGRESSION ANALYSIS
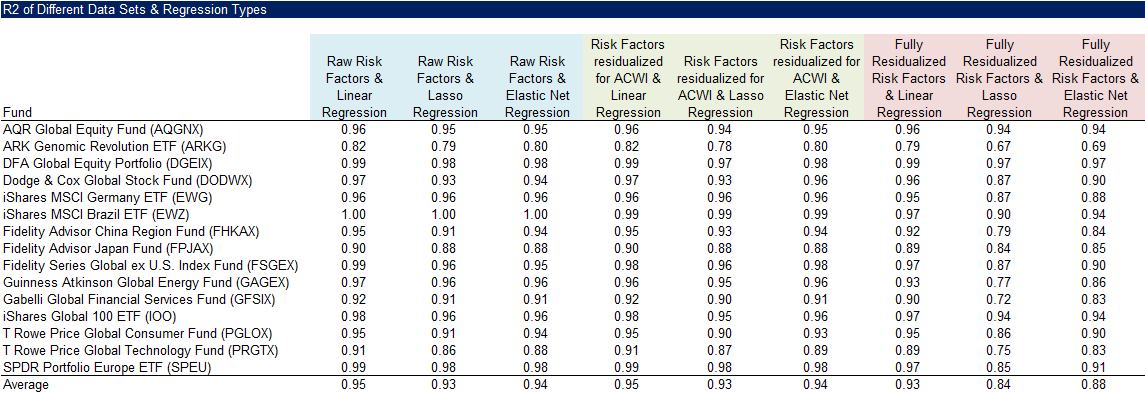
We randomly selected 15 equity funds trading in the U.S. that provide exposure to broad stock markets, individual countries, and sectors. We then ran three types of regressions – linear, lasso, and elastic net – using 17 country indices, 7 equity factor indices, and 11 sector indices. As independent variables, we used three sets of indices: raw indices, ACWI-residualized indices, and fully residualized indices (with ACWI, country, and sector exposures removed). This resulted in a total of nine regressions.
We compared the average R across these nine regressions. Using raw or ACWI-adjusted indices, the R2 ranged from 0.93 to 0.95, regardless of the regression method. Only when using lasso or elastic net regressions and fully residualized indices did the R2 drop to 0.84 to 0.88. These results suggest that residualization and more complex regression methods may not be necessary in this context.

Source: Finominal
RISK CONTRIBUTION CASE STUDY: ISHARES GLOBAL 100 ETF (IOO)
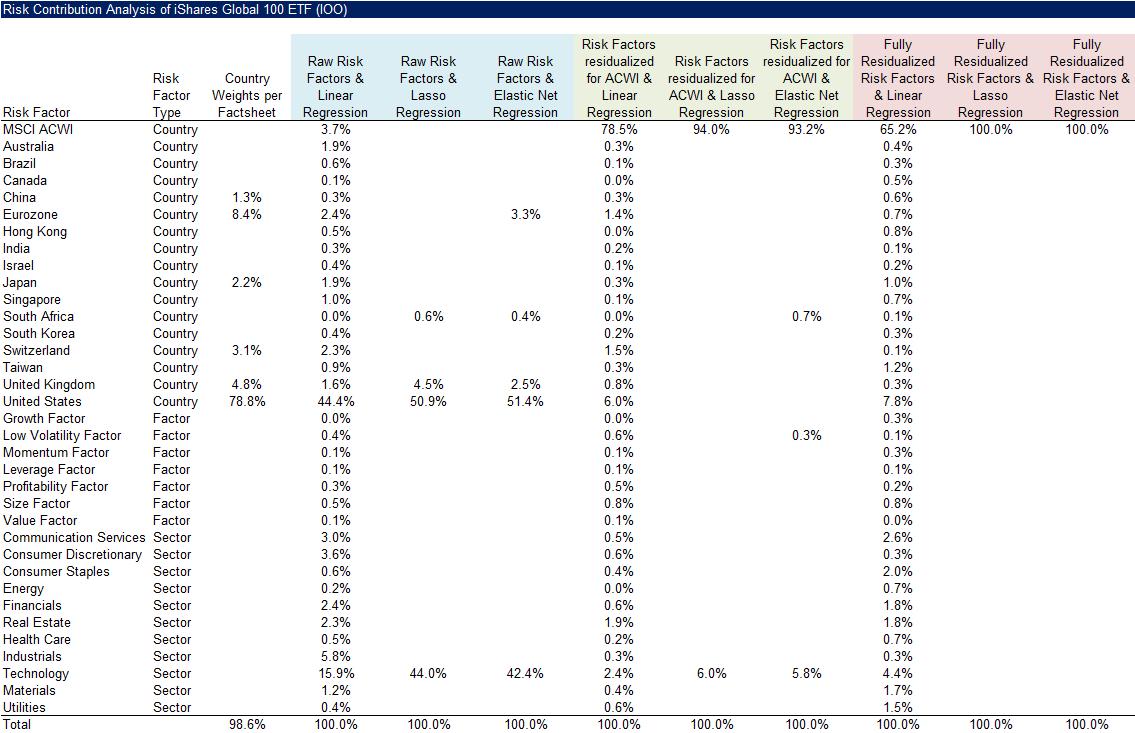
Next, we present a complete risk contribution analysis using the iShares Global 100 ETF (IOO) as a case study. While the did not improve with more sophisticated methods or residualized variables, there is a clear drawback to running a linear regression with 35 raw independent indices: the results are difficult to interpret, as nearly every variable appears to contribute to the risk. Applying lasso or elastic net regression removes less relevant variables, leaving almost all the risk attributed to just two factors: the U.S. stock market (≈50%) and the technology sector (≈40%).
From a theoretical perspective, using correlated variables introduces multicollinearity, which can distort the analysis. When we remove the ACWI exposure from all variables but also include it explicitly as an index, the ACWI explains almost all the risk (78–94%). Using fully residualized variables further increases its share of the risk contribution (65–100%). In other words, the total risk of IOO can largely be attributed to the global stock market, rather than to individual country, sector, or factor exposures.

Source: Finominal
RISK CONTRIBUTION CASE STUDY: T. ROWE PRICE GLOBAL TECHNOLOGY FUND
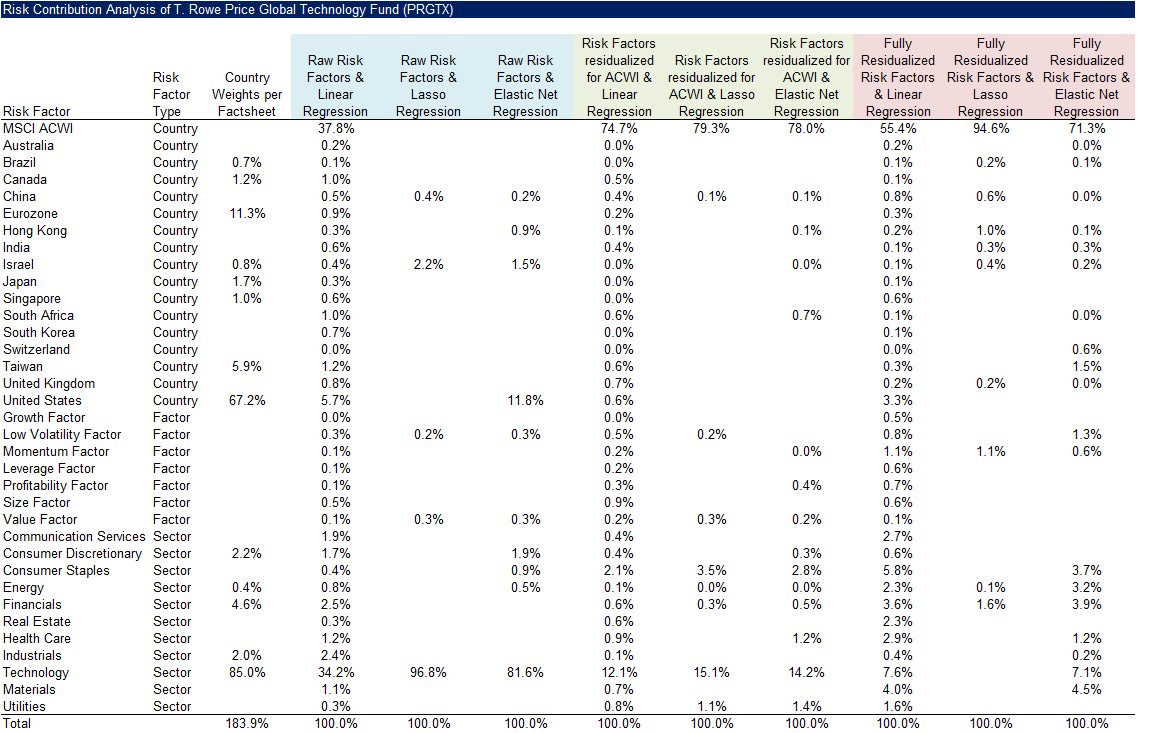
Next, we examine the T. Rowe Price Global Technology Fund (PRGTX) as a second case study. Linear regressions using raw, ACWI-adjusted, and fully residualized indices yield too many factor exposures to interpret meaningfully, making lasso and elastic net approaches more effective.
As before, once the ACWI effect is removed from the raw indices, most of the fund’s risk is explained by the global stock market. Notably, the elastic net assigns some risk contribution to the technology sector even after full residualization, whereas the lasso does not – giving the elastic net a slight advantage in this instance.

Source: Finominal
COMPARING DATA SETS & REGRESSION TYPES
Finally, we calculate the correlations between the country and sector weights reported in the funds’ factsheets and the risk contributions derived from the various index sets and regression methods. The average correlations range from 0.69 for the elastic net using ACWI-residualized indices to 0.91 for the elastic net with raw indices.
However, a higher correlation does not necessarily indicate a better approach – in fact, it may suggest the opposite. The elastic net with raw indices shows the strongest alignment with the reported weights, producing the most intuitive risk contributions, yet such weights can be misleading. For example, in a traditional 60/40 equities-bonds portfolio, roughly 90% of the total risk typically comes from equities and only 10% from bonds. Conversely, the elastic net using fully residualized indices tends to attribute most of the risk to the global stock market – an outcome that may seem less intuitive but is arguably more accurate.

Source: Finominal
FURTHER THOUGHTS
So, which datasets and regression approach should investors use for risk contribution analysis?
Elastic net tends to outperform lasso regression slightly, while linear regressions become unwieldy when faced with too many independent variables. Using raw indices often yields more intuitive results, making them ideal for reporting to broader audiences. Technically, however, most of the risk in equity funds can be traced to a single factor – the global stock market – as revealed when using fully residualized variables. For quants and risk managers, this offers a clearer analytical perspective. One painting, endless perspectives.
RELATED RESEARCH
Factor Exposure Analysis 116: Residualized Indices
Factor Exposure Analysis 115: Measuring International Exposures
Factor Exposure Analysis 114: Factor Offsetting
Factor Exposure Analysis 113: Profitability vs Leverage Factors
Factor Exposure Analysis 112: Quality vs Growth Factors
Factor Exposure Analysis 111: What is Alpha?
Factor Exposure Analysis 110: Long-Short vs Long-Only Factors
Factor Exposure Analysis 109: Linear vs Lasso vs Elastic Net
Factor Exposure Analysis 108: Fixed Income Factors II
Factor Exposure Analysis 107: Fixed Income Factors
Factor Exposure Analysis 106: Macro Variables
Factor Exposure Analysis 105: Sectors versus Factors
Factor Exposure Analysis 104: Fixed Income ETFs
Factor Exposure Analysis 103: Exploring Residualization
Factor Exposure Analysis 102: More or Less Independent Variables?
Factor Exposure Analysis 101: Linear vs Lasso Regression
Factor Exposure Analysis 100: Holdings vs Regression-Based
ABOUT THE AUTHOR
Nicolas Rabener is the CEO & Founder of Finominal, which empowers professional investors with data, technology, and research insights to improve their investment outcomes. Previously he created Jackdaw Capital, an award-winning quantitative hedge fund. Before that Nicolas worked at GIC and Citigroup in London and New York. Nicolas holds a Master of Finance from HHL Leipzig Graduate School of Management, is a CAIA charter holder, and enjoys endurance sports (Ironman & 100km Ultramarathon).
Connect with me on LinkedIn or X.

