
Multi-Factor Investing: Intersectional vs Combination Models
Which one is superior?
August 2026. Reading Time: 10 Minutes. Author: Nicolas Rabener.
SUMMARY
- Long-short multi-factor funds are at all-time highs
- Long-only smart beta funds have performed poorly recently
- Significant differences between the intersectional and combination models
INTRODUCTION
Most investors should focus on asset allocation rather than stock selection, as beating the market seems exceptionally difficult. For fund managers mandated to pursue stock selection, however, factor investing is the only approach with meaningful support from financial research. Even this is challenging, though, since factor premia only manifest over the medium to long term, which naturally clashes with investors’ short-term expectations.
Implementing factor strategies requires a number of decisions, including defining the universe, selecting factors, and constructing the portfolio. Although plenty of single-factor funds exist, most funds actually provide exposure to multiple factors. A small-cap value fund, for example, provides exposure to both the size and value factors.
Fund managers typically combine factors via three models: combination, intersectional, and sequential. We compared all three in previous research articles and found no clearly superior methodology. However, that analysis focused on long-short portfolios, whereas the vast majority of practitioners pursue factor investing through long-only (smart beta) funds.
In this article, we contrast the combination and intersectional models for long-only multi-factor portfolios.
LONG-SHORT MULTI-FACTOR INVESTING
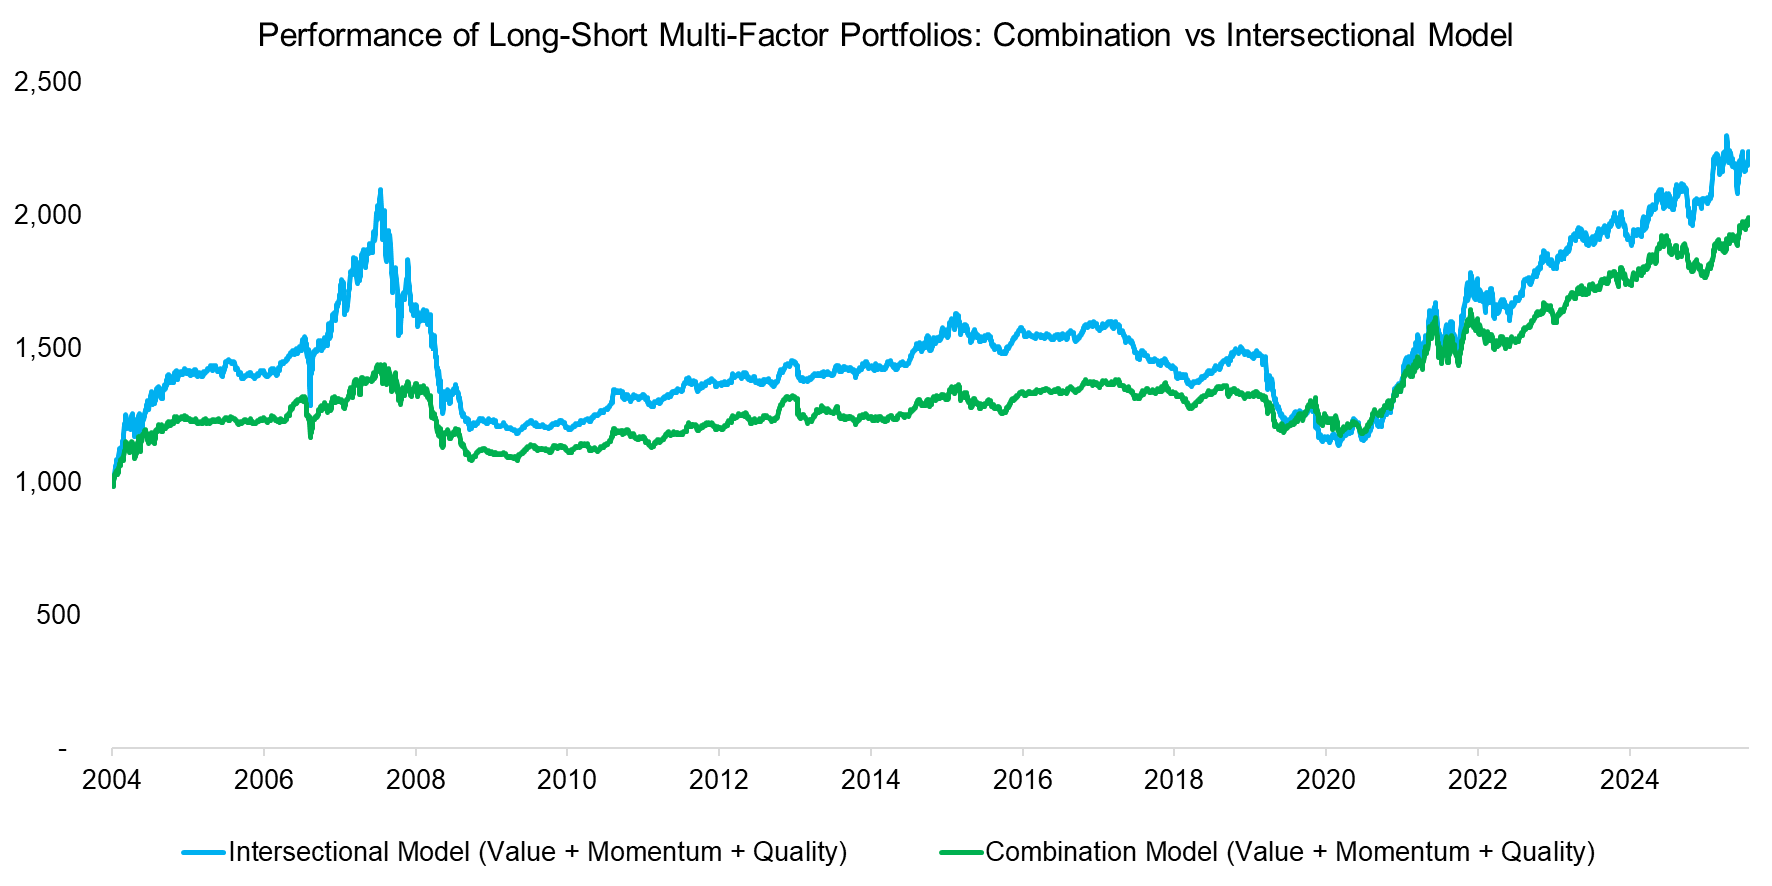
First, we construct long-short multi-factor portfolios using the value, momentum, and quality factors. Value is defined by P/B and P/E multiples, momentum by trailing 12-month performance excluding the most recent month, and quality by return on equity. We use the universe of U.S. stocks, which totals approximately 2,000 stocks in 2026. For the intersectional model, also known as the integrated model, we select the top and bottom 10% of stocks ranked across all three factors. For the combination model, we combine single-factor portfolios comprised of the top and bottom 3% of stocks. As a result, both portfolios comprise approximately 200 stocks on the long side and the same number on the short side. Stocks are weighted equally, portfolios are rebalanced monthly and managed to be beta-neutral, and we assume 10 basis points of transaction costs.
We observe that both multi-factor portfolios generated positive performance over the period from 2004 to 2026. The return trends were also nearly identical, with comparable total returns.
Source: Finominal
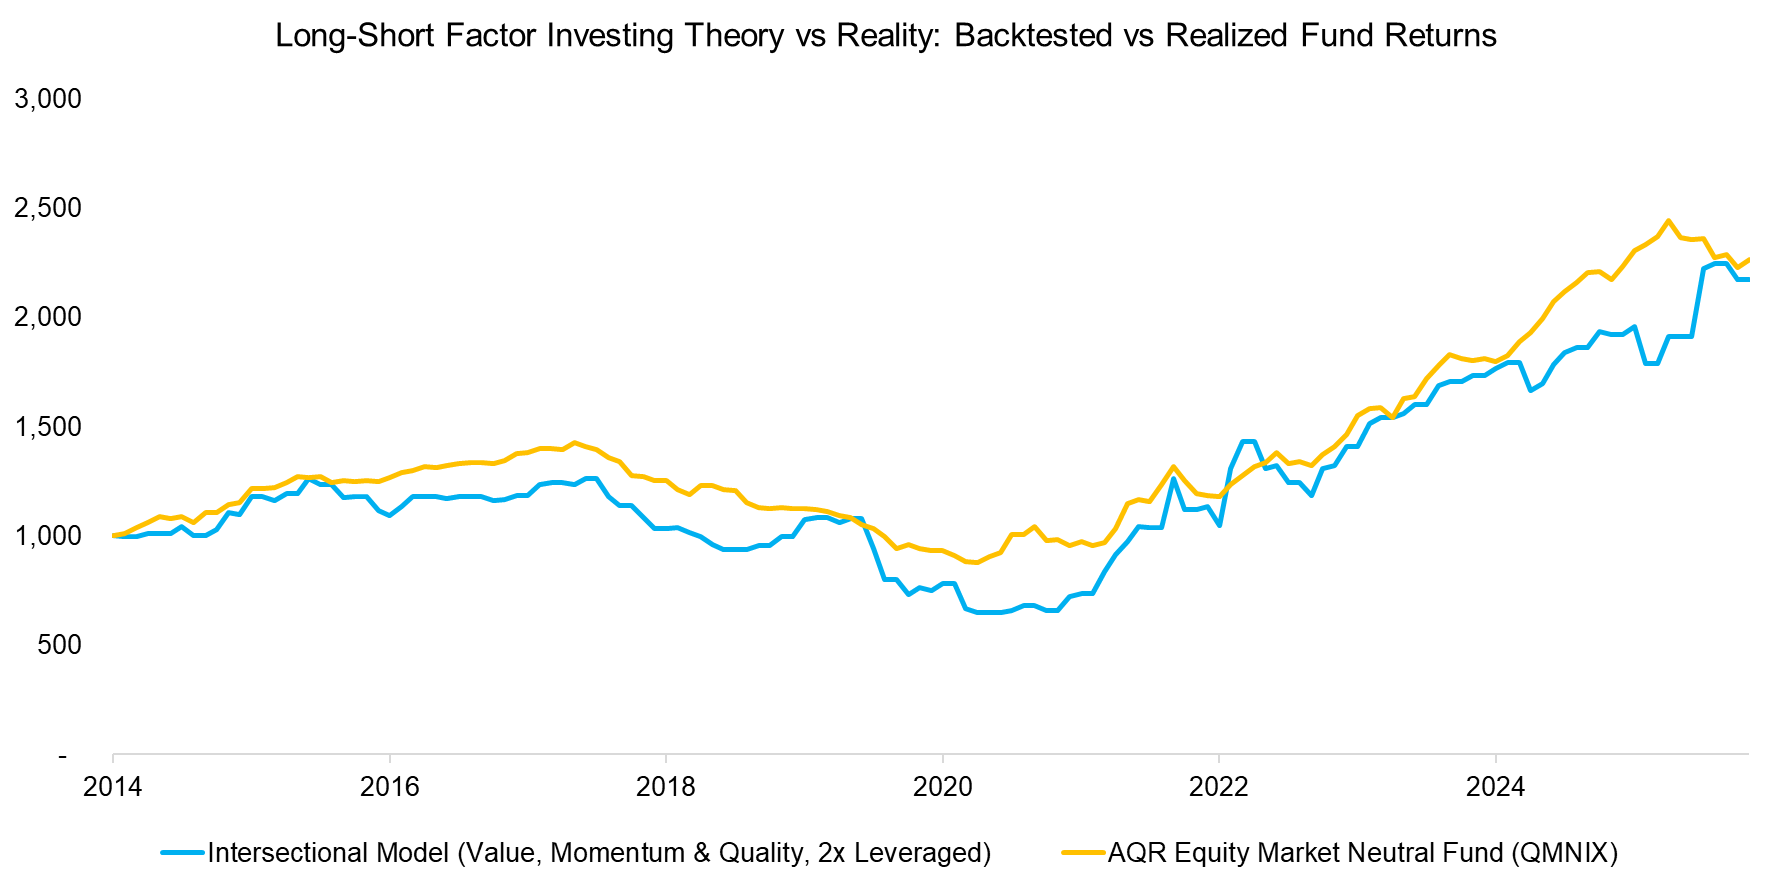
A frequent criticism of factor investing is that it merely reflects overfitted backtests that fail to hold up in the real world. However, when we compare the performance of AQR’s Equity Market Neutral Fund (QMNIX), which selects stocks globally using value, momentum, and quality metrics via the intersectional model, we observe performance nearly identical to that of the theoretical intersectional model.
Factor investing is alive and well: QMNIX is currently trading close to its all-time high.
Source: Finominal
LONG-ONLY MULTI-FACTOR INVESTING
Although most investors who subscribe to factor investing should allocate to long-short funds, given the attractive diversification benefits they offer, almost none do. Assets under management in long-only smart beta funds are more than 100x those of long-short funds.
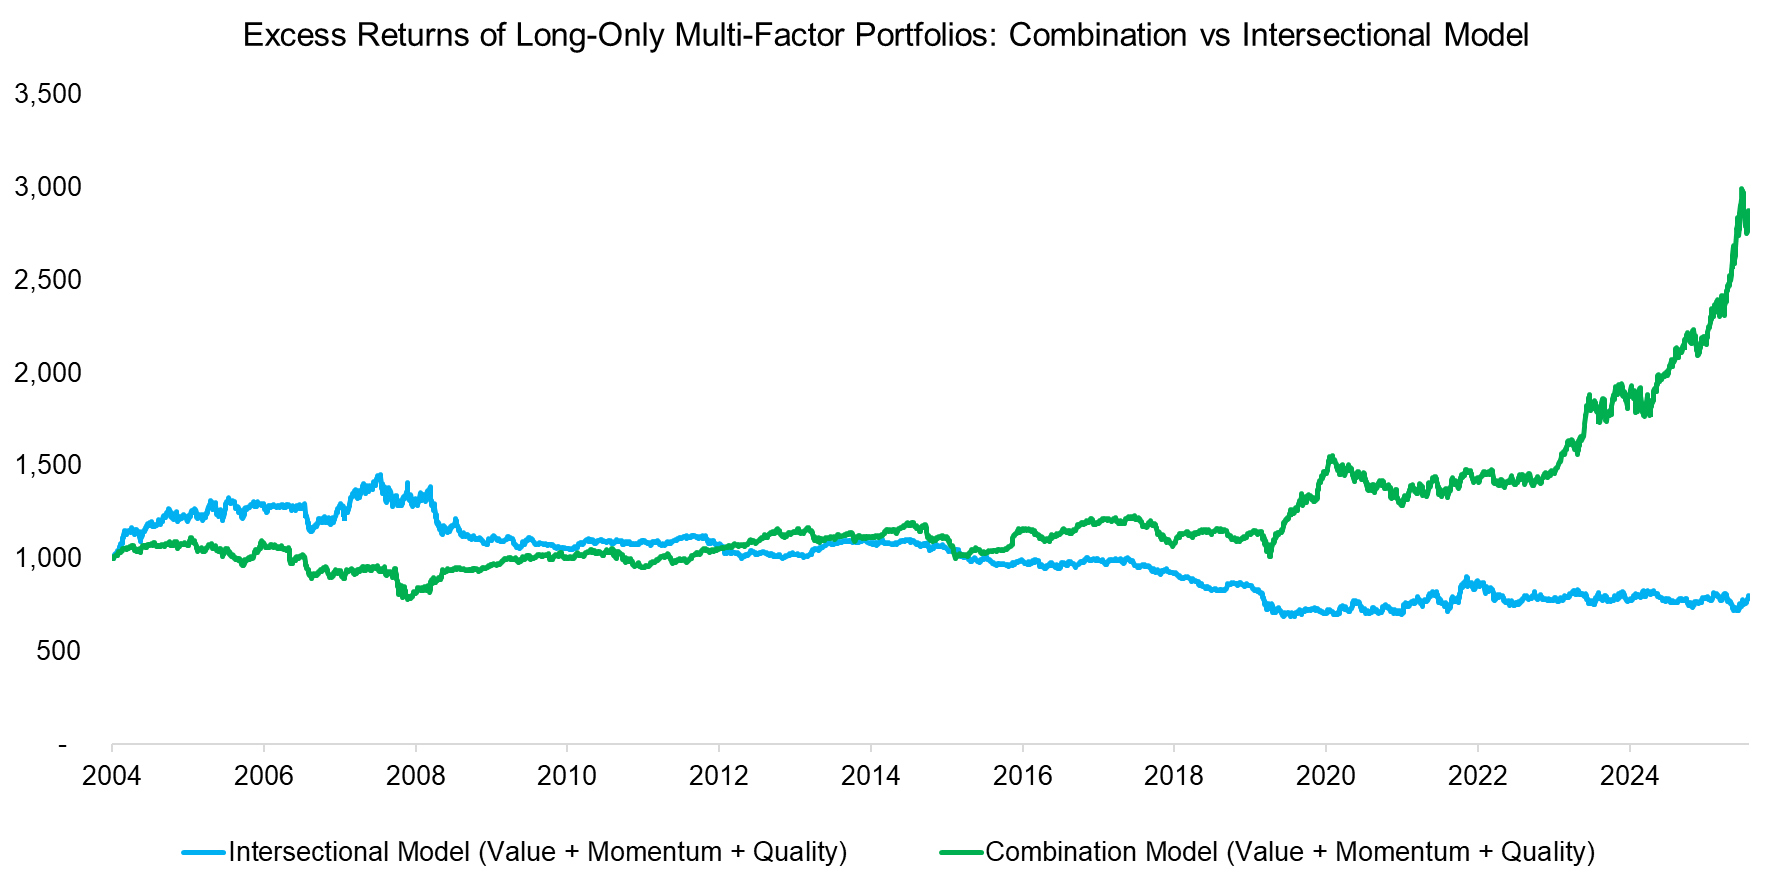
Given this, we construct long-only multi-factor portfolios in line with industry standards, with weights based on market capitalization. We compute excess returns, which highlight divergent performance between the intersectional and combination models. There was a significant difference in trends during the Global Financial Crisis in 2008, and again from 2016 onward, when the combination model began generating strongly positive returns while the intersectional model generated strongly negative returns.
Source: Finominal
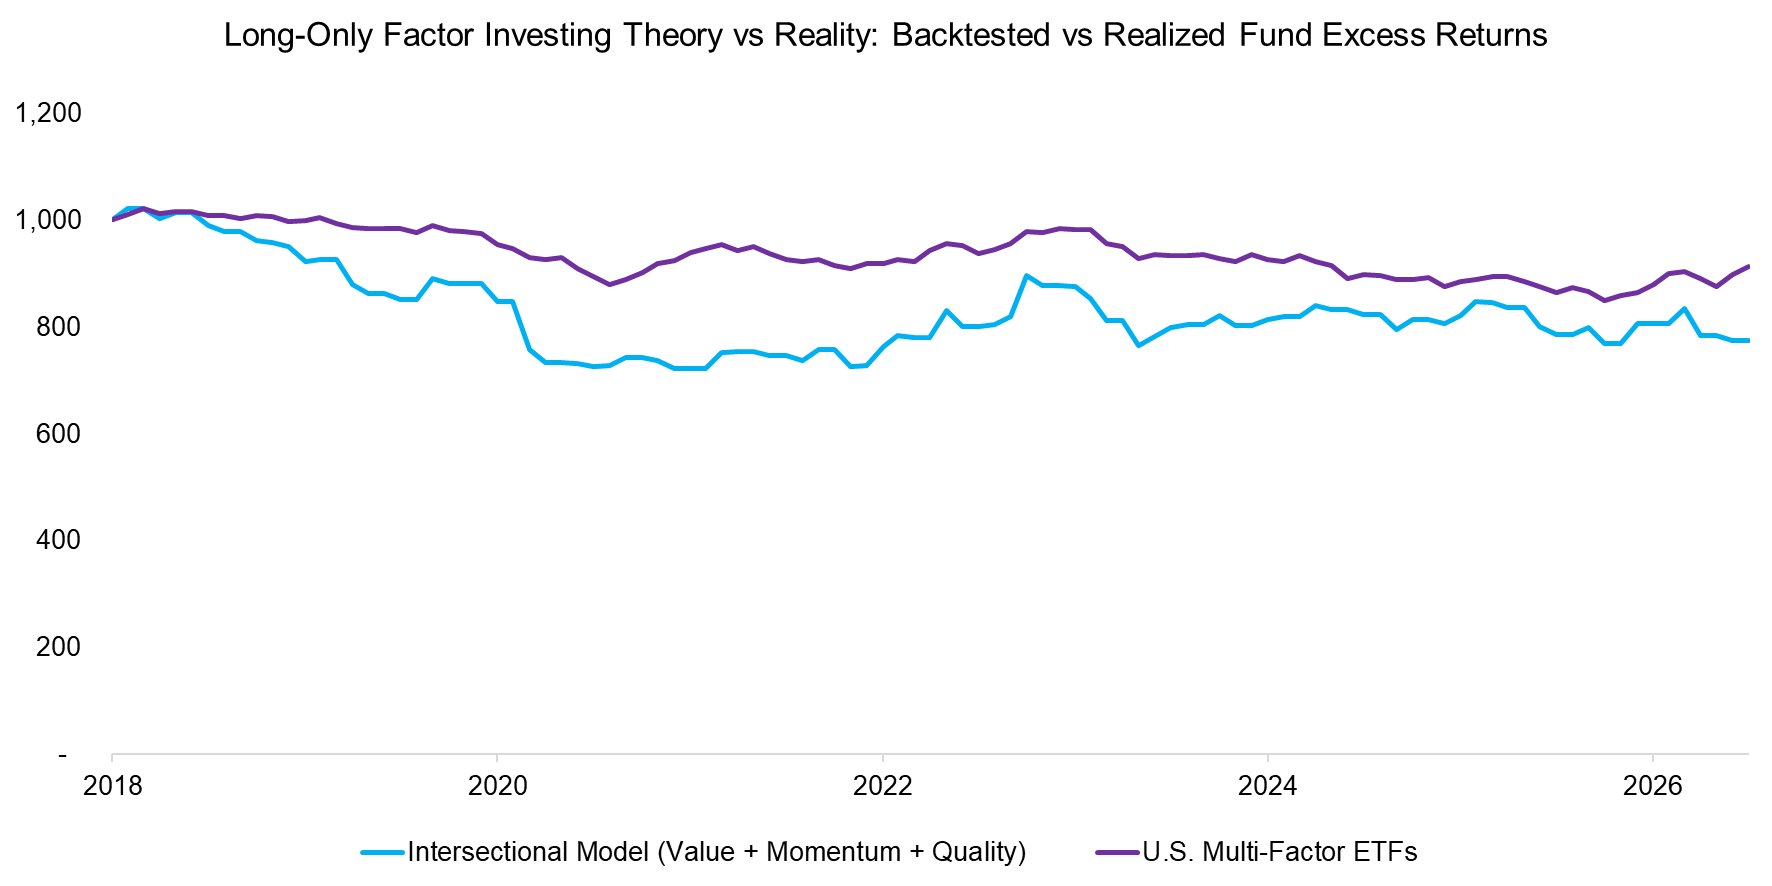
We again verify our theoretical results by constructing an index from U.S. multi-factor ETFs, which typically use the intersectional model for stock selection. We observe the same consistent downward trend since 2018, which is why many investors have lost faith in factor investing.
Source: Finominal
How do we explain the little difference between the intersectional and combination models in long-short investing, yet a significant difference in long-only multi-factor investing?
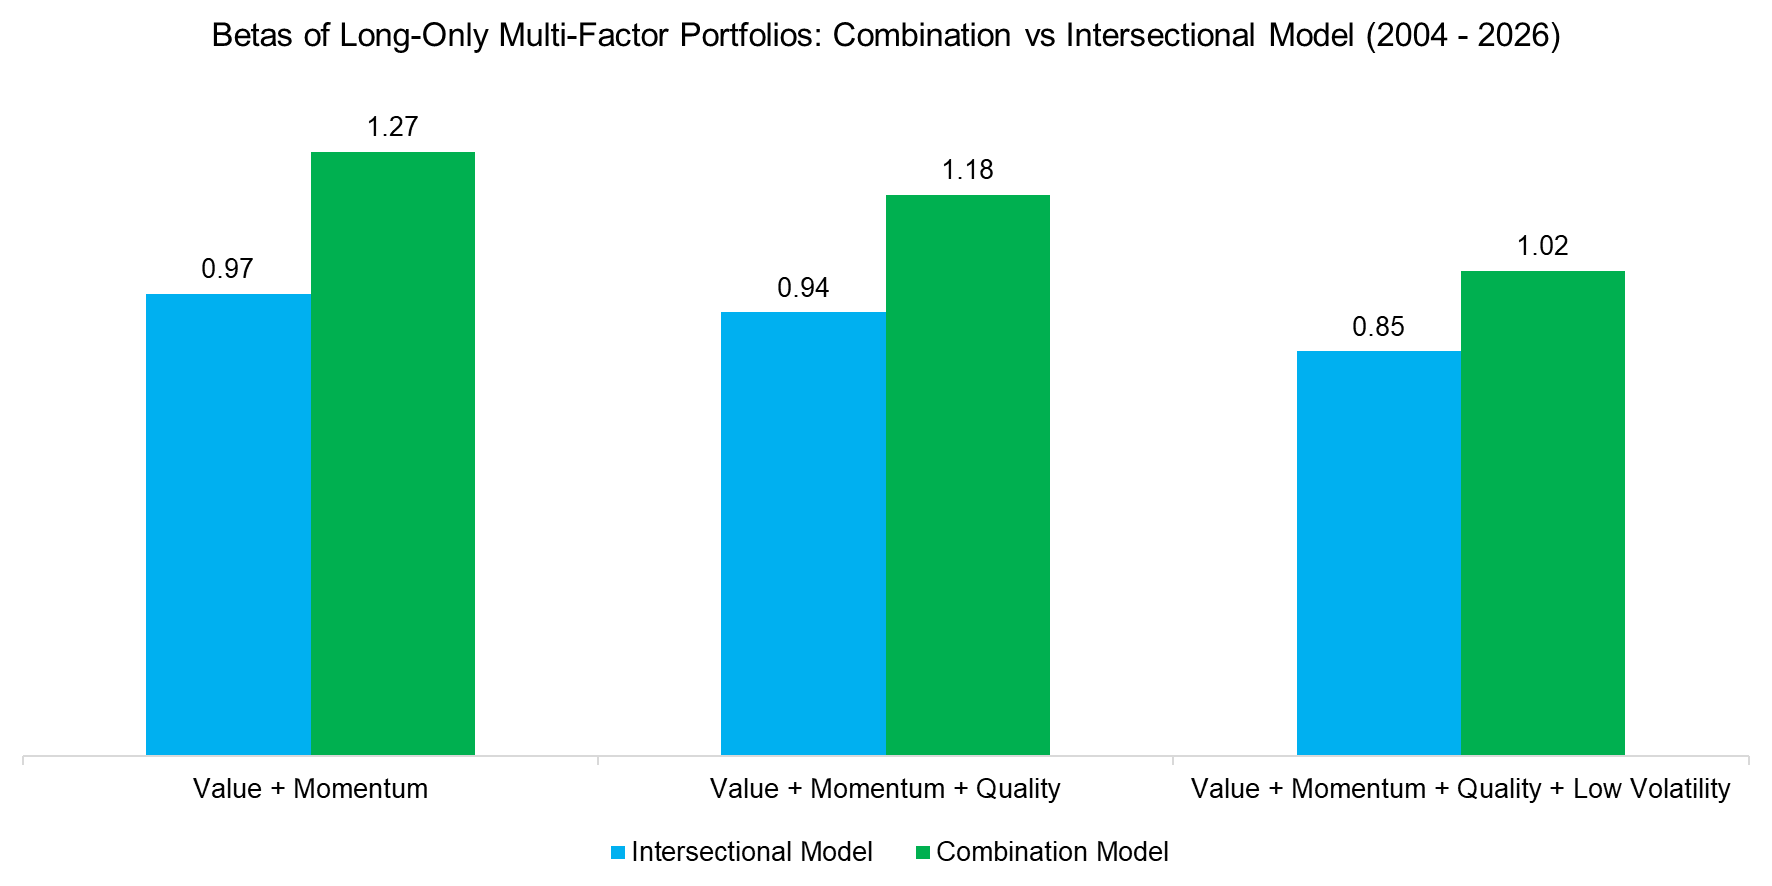
There are various metrics we can use to analyze the portfolios. A simple check is to measure the betas of long-only portfolios, where we review portfolios selected on (i) value and momentum, (ii) value, momentum, and quality, and (iii) value, momentum, quality, and low volatility metrics. This analysis highlights that the combination model yields portfolios with a beta to the stock market above 1, whereas the intersectional model yields portfolios with a beta below 1. Given that the stock market has risen strongly over the last 10 years, using the intersectional model for stock selection was akin to shorting the market, while the combination model behaved like a leveraged bet on it.
Source: Finominal
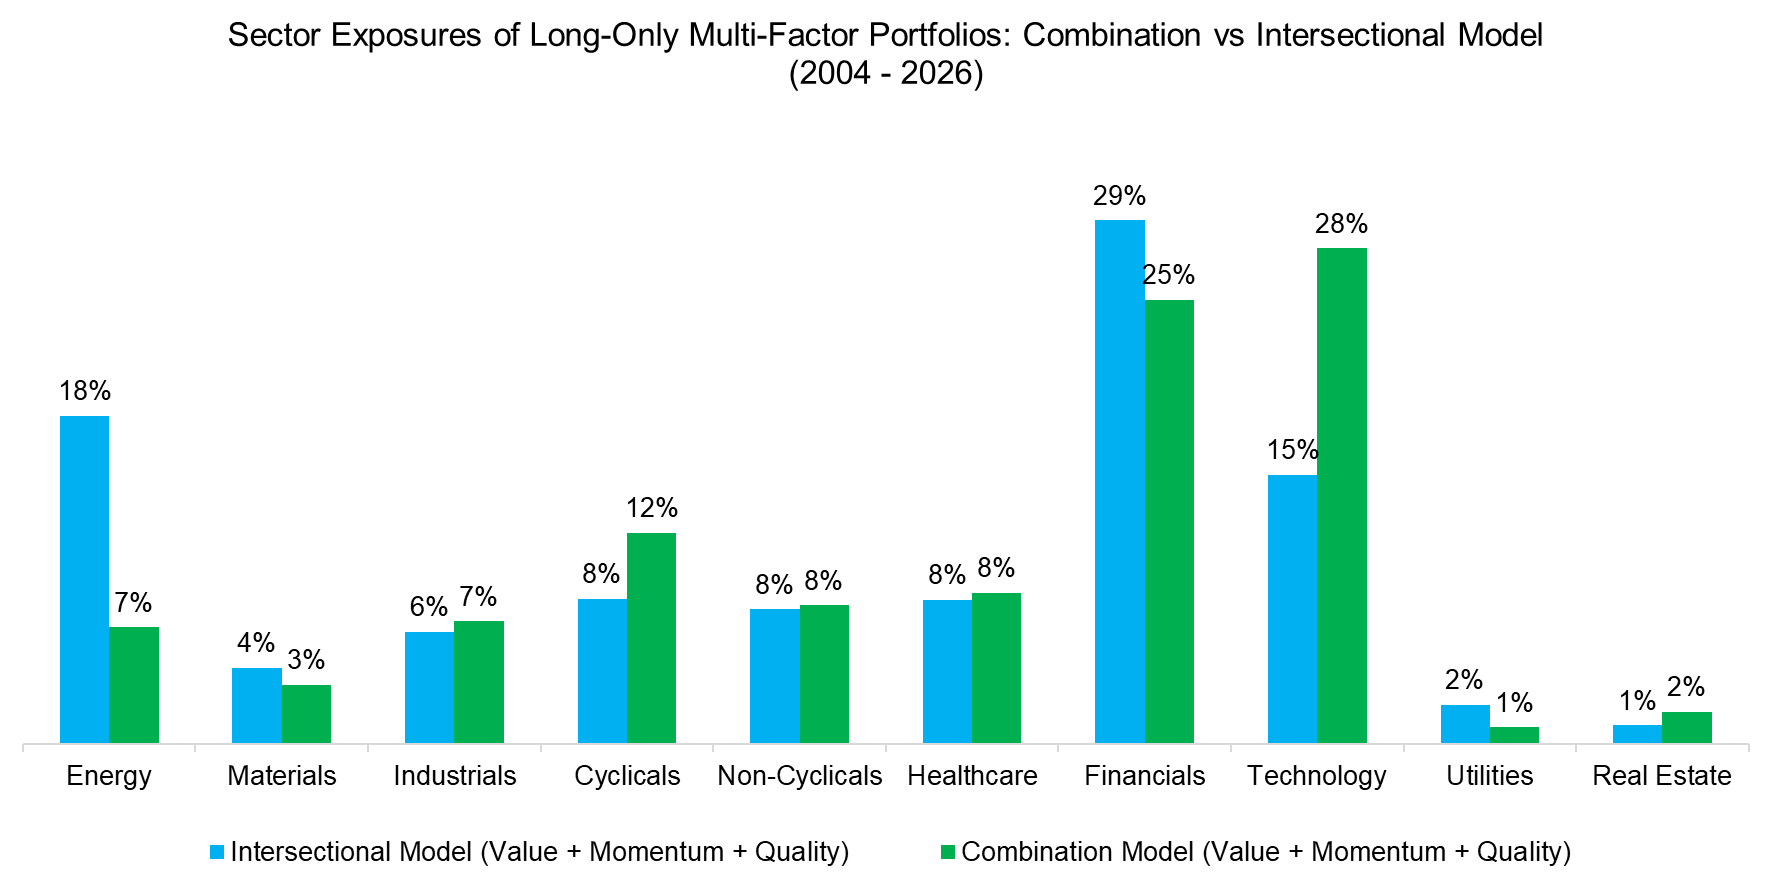
We can also review the sector exposures of both portfolios, which underscore meaningful differences. The intersectional model had a higher allocation to the energy sector but a lower one to technology stocks. This highlights the differing stock-selection dynamics: the intersectional model struggled to select technology stocks, as these were outperforming yet never cheap, and only some were profitable, resulting in low-to-medium multi-factor rankings. In contrast, the combination model selected these stocks using its single-factor approach.
Source: Finominal
FURTHER THOUGHTS
This analysis suggests that for long-only multi-factor portfolios, investors should prefer the combination model. However, we would likely have seen the opposite result during the tech bubble in 2000, when the intersectional model would have avoided all highly performing but expensive and unprofitable stocks like Pets.com or Amazon. Although our analysis does not cover this period due to a lack of data, we suspect that the combination model’s portfolio experienced a significant drawdown during the 2001 tech bubble collapse. We would speculate the same for the combination model’s recent outperformance. Time will tell.
RELATED RESEARCH
Timing Luck in Factor Investing
Market-Neutral versus Smart Beta Factor Investing
Intersectional vs Sequential Multi-Factor Models
Multi-Factor Models 101
Intersectional Model: Sorting 7 Factors
Sequential Model: Sorting by 5 Factors
Integrated Value, Growth & Quality Portfolios
Factor Investing Is Dead, Long Live Factor Investing!
Smart Beta vs Alpha + Beta
How Painful Can Factor Investing Get?
Factor Exposure Analysis 114: Factor Offsetting
Smart Beta ETF vs Customized Factor Portfolios
Multi-Factor Smart Beta ETFs
Factor Optimization via ETFs
Improving Smart Beta Attribution Analysis II
ABOUT THE AUTHOR
Nicolas Rabener is the CEO & Founder of Finominal, which empowers professional investors with data, technology, and research insights to improve their investment outcomes. Previously he created Jackdaw Capital, an award-winning quantitative hedge fund. Before that Nicolas worked at GIC and Citigroup in London and New York. Nicolas holds a Master of Finance from HHL Leipzig Graduate School of Management, is a CAIA charter holder, and enjoys endurance sports (Ironman & 100km Ultramarathon).
Connect with me on LinkedIn or X.