
100% Equities vs Leveraged Diversified Portfolios: A 100-Year Perspective
Does diversification plus leverage beat an all-equity portfolio?
November 2026. Reading Time: 10 Minutes. Author: Nicolas Rabener.
- Leveraged equity/bond portfolios were superior to 100% equities
- Adding diversifiers further improves Sharpe ratios
- Leverage can increase, but also reduce risk
INTRODUCTION
In 2023, Aizhan Anarkulova, Scott Cederburg and Michael O’Doherty published a working paper, Beyond the Status Quo: A Critical Assessment of Lifecycle Investment Advice, that made the case for a 100% equity allocation for some investors. The authors showed that, over the long run, global equities outperformed stock-and-bond portfolios.
The investment community responded quickly and largely negatively. Critics acknowledged this might be true but argued that most investors could not hold such portfolios through rare but severe drawdowns. US stocks fell more than 80% during the Great Depression in the 1930s and more than 50% during the global financial crisis in 2008.
One concern is that bonds are becoming riskier as governments run large deficits, public debt hits record highs, and populations decline. Given this, we recently made the case that investors can replicate traditional 60/40 equity/bond portfolios with leveraged diversified portfolios (read 60/40 vs Leveraged Diversified Portfolio).
In this article, we compare 100% equities with a leveraged diversified portfolio over the last century.
100% EQUITY VS LEVERAGED EQUITY-BOND PORTFOLIOS
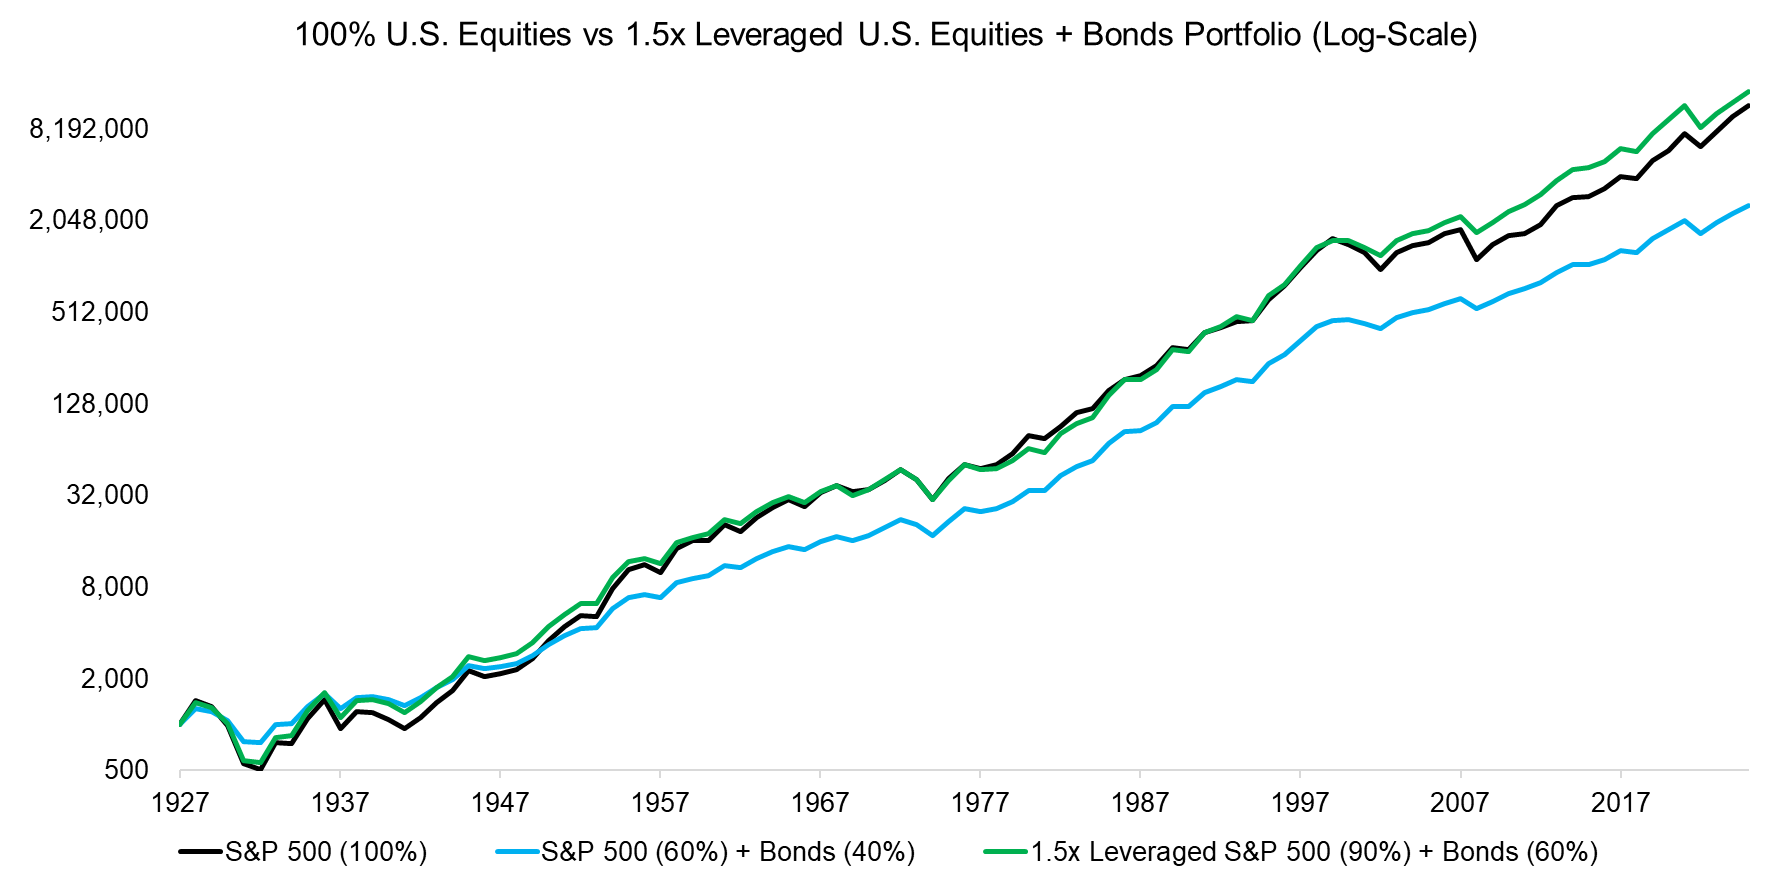
First, we use data from Professor Aswath Damodaran of New York University to compare a 100% S&P 500 portfolio with a traditional 60/40 S&P 500/U.S. 10-Year Treasury portfolio and a leveraged version of the latter. We assume annual rebalancing and zero transaction costs. We finance the leverage at the risk-free rate, proxied by 3-month Treasury bills.
We observe that a 1.5x leveraged portfolio, i.e., one that allocates 90% to equities and 60% to bonds, would have generated returns similar to investing 100% in the U.S. stock market.
Using leverage in portfolio construction naturally adds complexity and risk. Leveraged portfolios are usually implemented with futures, which are operationally more complex than buying stocks and funds, and they require monitoring and maintaining margins. Rising interest rates increase the cost of leverage, reducing returns, and also amplify losses from the bond allocation. However, funds like the WisdomTree U.S. Efficient Core Fund (NTSX) handle this complexity for investors, albeit at a cost of 0.20% pa.
Source: Finominal
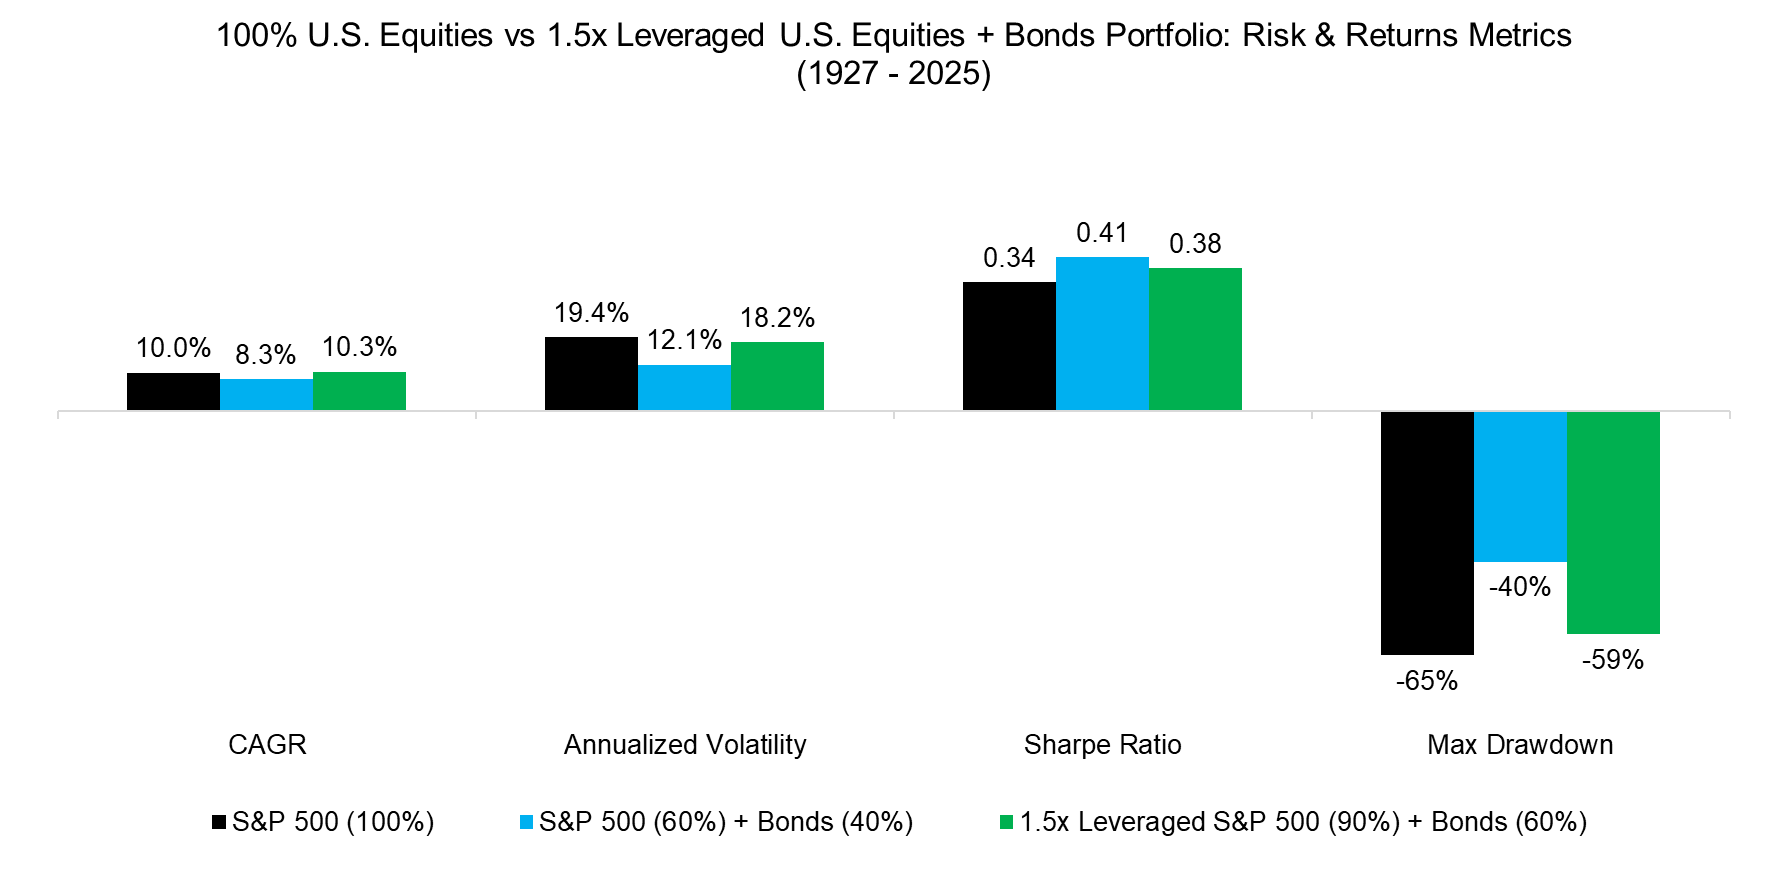
Although the S&P 500 and the 1.5x leveraged portfolio looked similar on the 100-year chart, the leveraged portfolio generated a slightly higher CAGR (10.3% vs 10.0%) and Sharpe ratio (0.38 vs 0.34), and a lower maximum drawdown (-59% vs -65%).
100% EQUITY VS LEVERAGED DIVERSIFIED PORTFOLIO
Next, we add an unleveraged and a 1.5x leveraged portfolio that allocate equally to the S&P 500, U.S. 10-Year Treasury bonds, gold, and managed futures. Managed futures are proxied by a backtest from AQR Capital Management, which should be viewed as an approximation with likely somewhat overstated returns, as with all backtests (read Bonds vs. Gold vs. Managed Futures: A 100-Year Perspective).
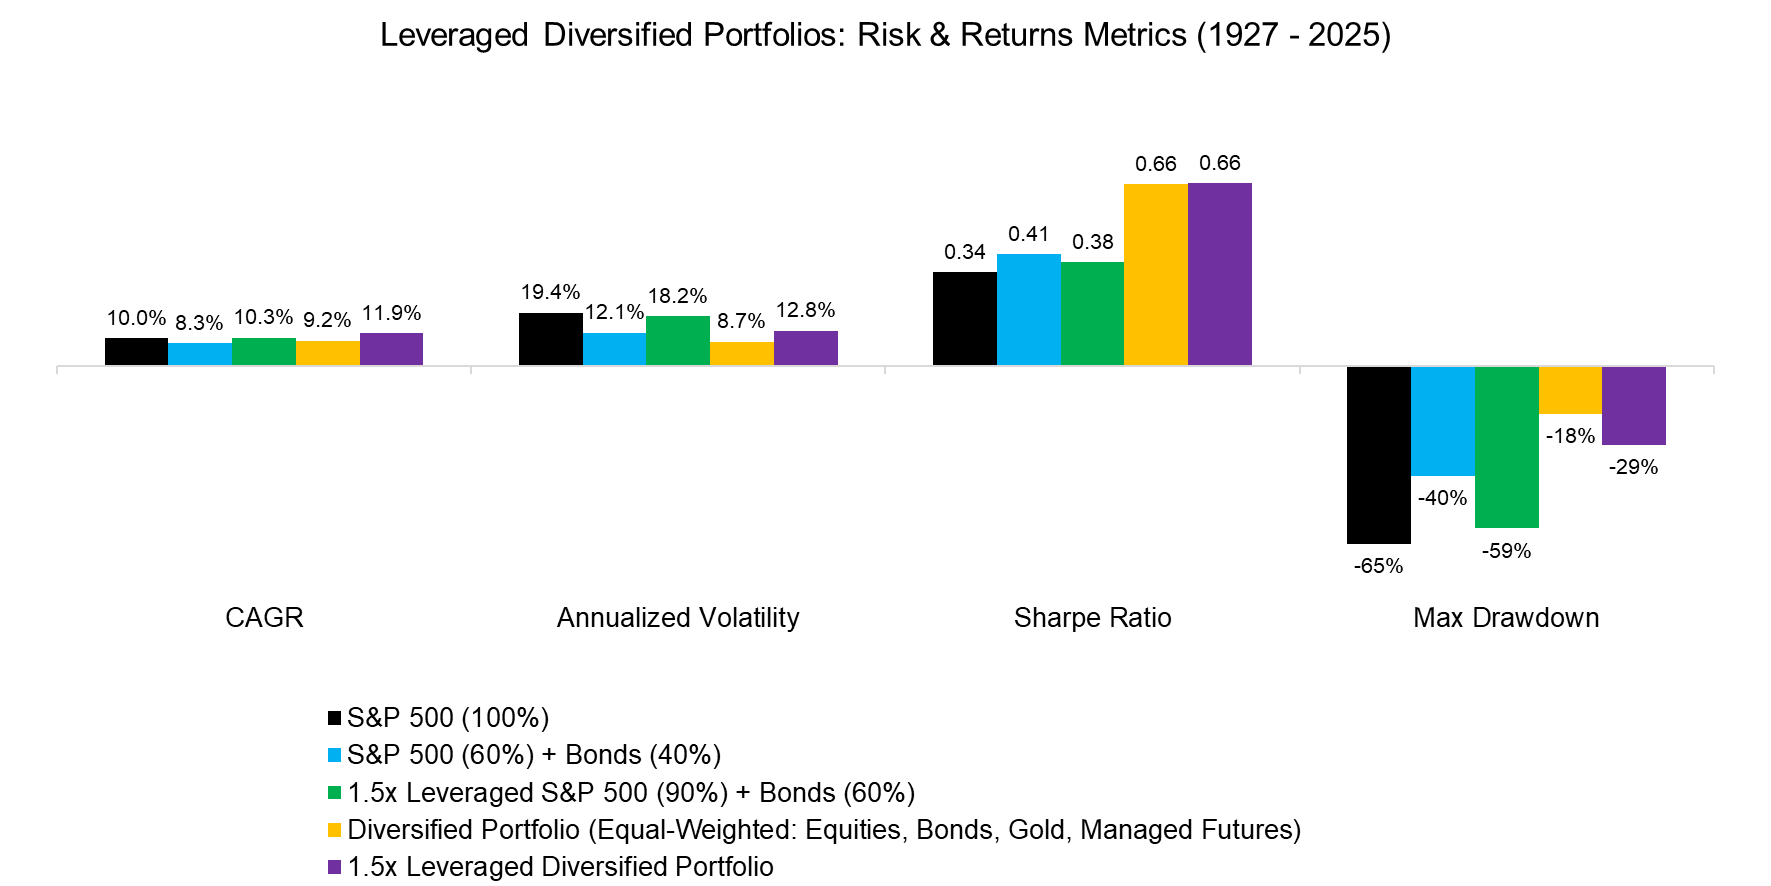
As expected, the diversified portfolios behaved markedly differently from the S&P 500 and the 60/40 portfolio over the last 100 years. Performance during equity market booms, e.g., the tech bubble of the late 1990s, was lower, but so were the drawdowns during market downturns.
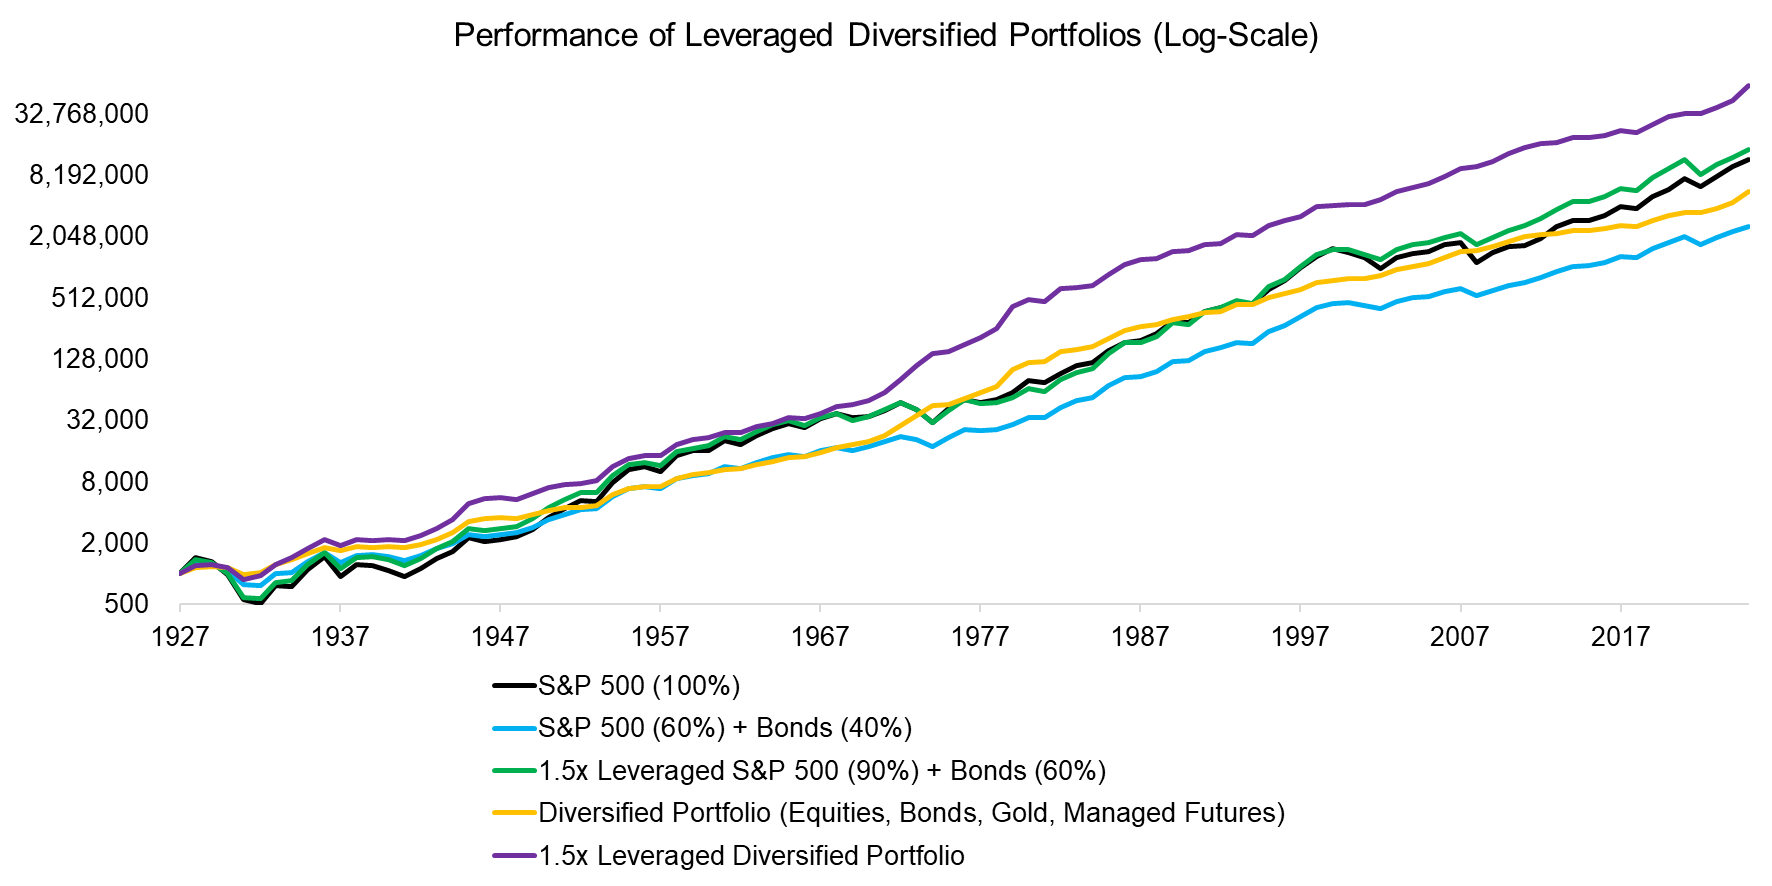
Overall, however, the diversified portfolio generated a significantly higher Sharpe ratio (0.66) than the S&P 500 (0.34) and the 60/40 portfolio (0.41). Its CAGR was below the stock market (9.2% vs 10.0%), but adding 50% leverage would have raised it to 11.9%. More importantly, maximum drawdowns were cut in half, which should make it easier for investors to stick with their portfolios.
Source: Finominal
FURTHER THOUGHTS
The case for leveraging lowly correlated assets is not new. Cliff Asness of AQR Capital Management wrote “Why Not 100% Equities” in the Journal of Portfolio Management in 1996. Despite the strong case, assets in leveraged 60/40 or diversified funds remain low, e.g., the WisdomTree U.S. Efficient Core Fund (NTSX) manages only about $1.3bn. However, firms like WisdomTree and Newfound Research have launched more products recently, so it will be interesting to see whether this evolves into its own fund category over time.
One type of fund has been much more successful at raising assets for these strategies: multi-strategy hedge funds like Millennium, Citadel, and Balyasny. These funds combine hundreds of largely uncorrelated strategies and use extensive leverage to boost returns. However, leverage is a double-edged sword, which is precisely why these funds are known for their rigorous risk management.
REFERENCED RESEARCH
Beyond the Status Quo: A Critical Assessment of Lifecycle Investment Advice, Aizhan Anarkulova, Scott Cederburg and Michael O’Doherty, 2023
Why Not 100% Equities, Cliff Asness, Journal of Portfolio Management, 1996
RELATED RESEARCH
60/40 vs Leveraged Diversified Portfolio
60/40 Portfolios Without Bonds
Fund Selection: Equity Substitutes vs Diversifiers
Diversifying vs De-Risking Funds
Diversification vs De-Risking: Evidence Across Asset Classes
Return vs Diversification: What Matters More?
Alts: Volatility Is Not Your Enemy
Diversification versus Hedging II
Diversification versus Hedging
Finding Funds with Diversification Potential
Downside Betas vs Downside Correlations
Bonds versus CTAs for Diversification
Bonds vs Gold vs Managed Futures: A 25-Year Perspective
Bonds vs. Gold vs. Managed Futures: A 100-Year Perspective
Bonds vs. Managed Futures: A 100-Year Perspective
Managed Futures vs Factor Investing: A 100-Year Perspective
ABOUT THE AUTHOR
Nicolas Rabener is the CEO & Founder of Finominal, which empowers professional investors with data, technology, and research insights to improve their investment outcomes. Previously he created Jackdaw Capital, an award-winning quantitative hedge fund. Before that Nicolas worked at GIC and Citigroup in London and New York. Nicolas holds a Master of Finance from HHL Leipzig Graduate School of Management, is a CAIA charter holder, and enjoys endurance sports (Ironman & 100km Ultramarathon).
Connect with me on LinkedIn or X.