
DIY Leveraged Portfolios
How useful are leveraged ETFs?
November 2026. Reading Time: 10 Minutes. Author: Nicolas Rabener.
SUMMARY
- Leveraged diversified portfolios can provide 100% equity-like returns
- Leveraged ETFs can be used in portfolio construction
- However, they are suboptimal compared to futures given high fees
INTRODUCTION
In our recent research article, 100% Equities vs Leveraged Diversified Portfolios: A 100-Year Perspective, we showed that investors can match or exceed the returns of a 100% equity portfolio, while taking less risk, by applying leverage to a diversified portfolio. This conclusion is not new. Cliff Asness of AQR Capital Management made the same case in “Why Not 100% Equities,” published in the Journal of Portfolio Management in 1996.
Yet despite a substantial body of supporting research, surprisingly few funds offer leveraged multi-asset portfolios, whether plain-vanilla or more sophisticated. WisdomTree and Newfound Research have launched a handful of “return-stacked” funds in recent years, but why only now? These funds obtain leverage through futures, which have been available since the 1980s (read Replicating Capital-Efficient Funds).
Leveraged ETFs are operationally even simpler, since investors need neither a margin account nor to roll futures contracts. Such ETFs in the U.S. now have track records approaching 20 years. For example, ProShares Ultra S&P500 (SSO), which provides 2x exposure to U.S. large-cap stocks, launched in 2006. In this research article, we explore the most straightforward way to construct leveraged portfolios: using leveraged ETFs.
LEVERAGED ETFS
In this analysis, we use leveraged equity, bond, and gold ETFs to construct leveraged diversified portfolios, using the ProShares Ultra S&P500 (SSO), ProShares Ultra 20+ Year Treasury (UBT), and ProShares Ultra Gold (UGL). Despite their long track records, they manage few assets. SSO manages only $8bn, compared with $809bn in the State Street SPDR S&P 500 ETF Trust (SPY). UBT manages a mere $57m, and UGL $770m.
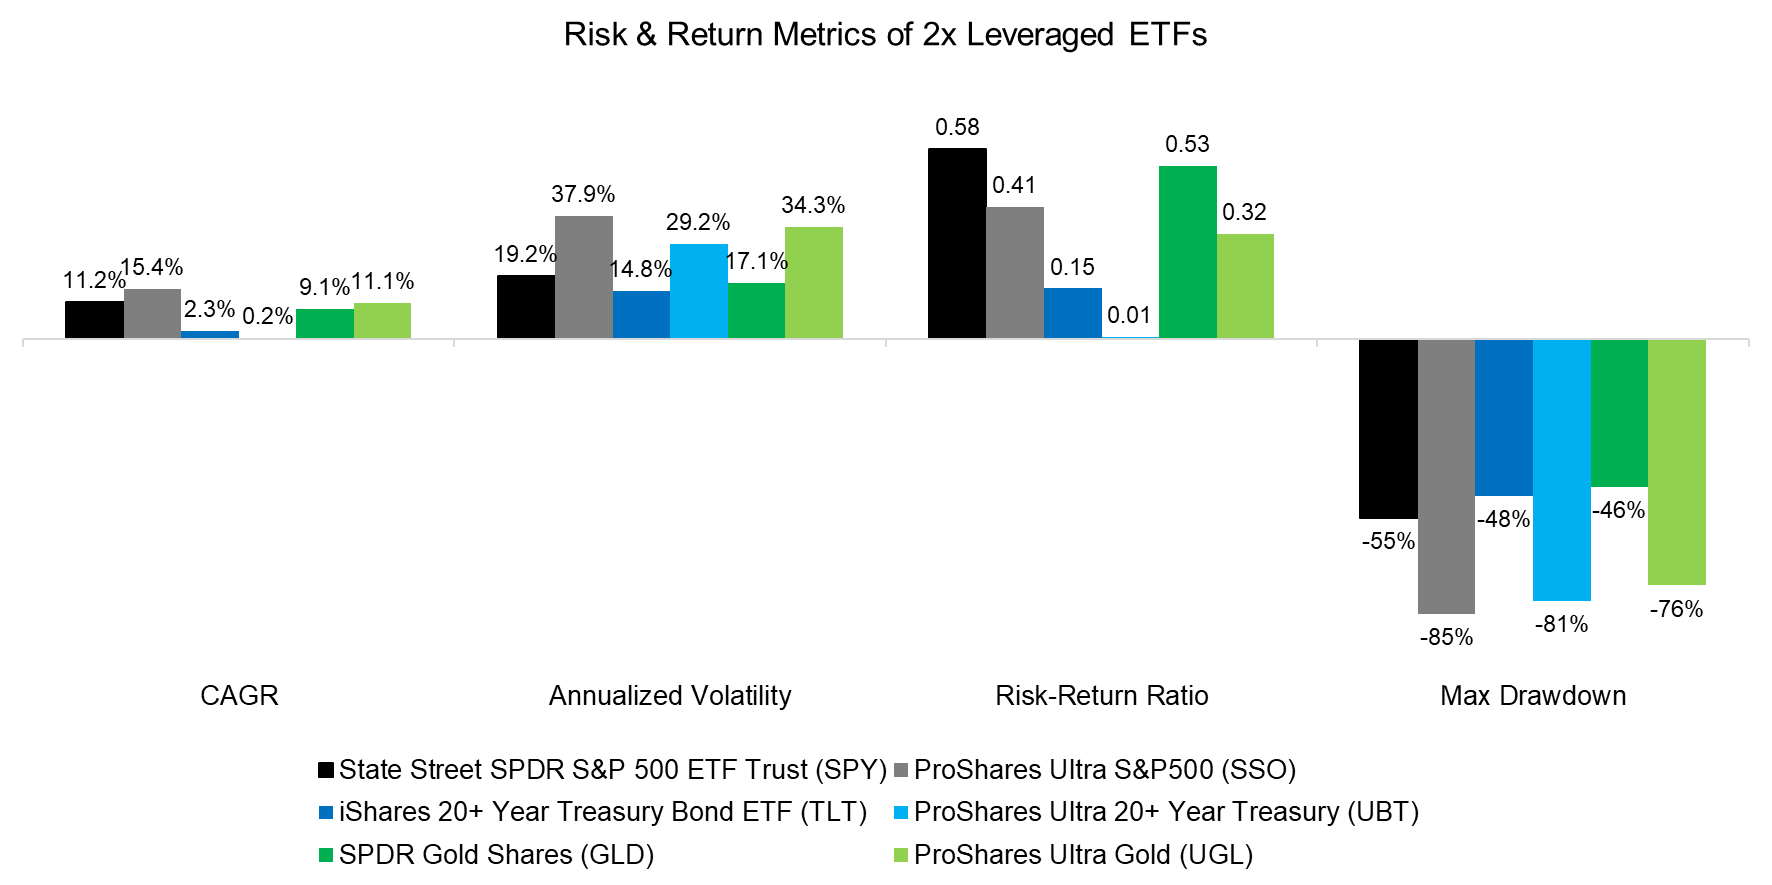
First, we compare the risk and return metrics of these prominent 2x leveraged funds with those of their underlying indices. The track records differ in length, as SSO launched in 2006, UGL in 2008, and UBT in 2010.
Many investors would expect a 2x leveraged fund to deliver twice the CAGR of its underlying index, yet SSO and UGL generated only marginally higher returns, while UBT produced a lower CAGR. This shortfall reflects management fees of close to 1% per annum, the cost of financing the leverage, and the daily reset. Because these funds deliver twice the daily return, they must increase exposure after gains and reduce it after losses, which creates a volatility drag that compounds over time. Unsurprisingly, risk-adjusted returns were much lower, while annualized volatility and maximum drawdowns were nearly twice as high (read Outperformance via Leverage).
Source: Finominal
DIY LEVERAGED PORTFOLIOS
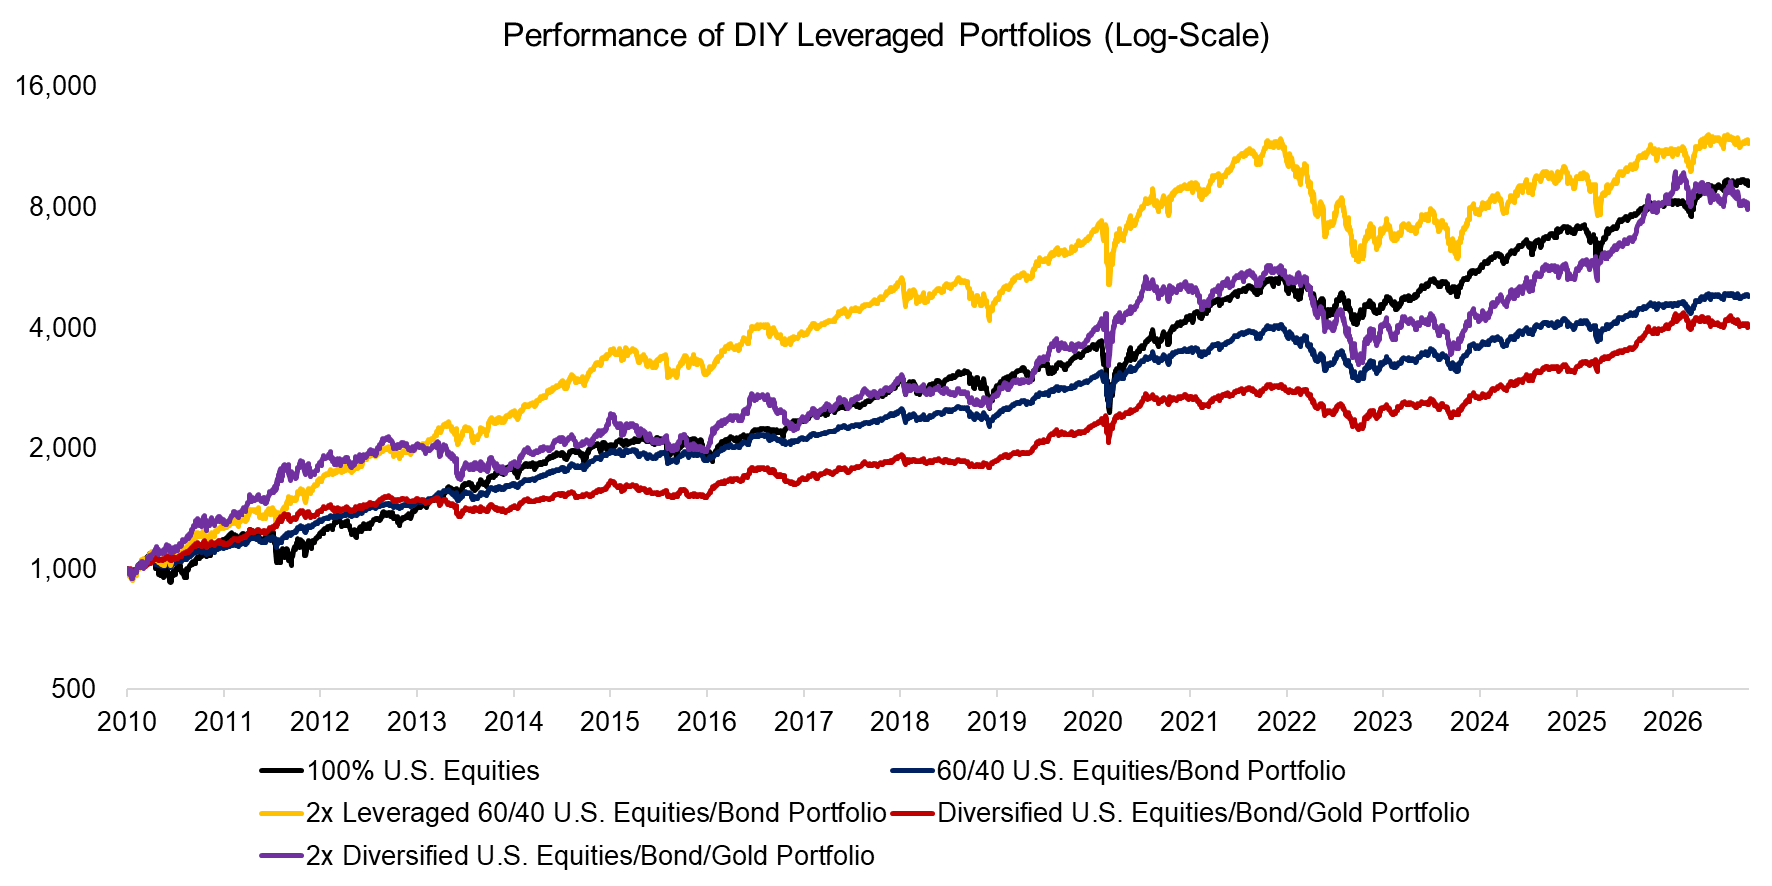
Next, we create two leveraged portfolios: a traditional 60/40 portfolio and an equal-weighted diversified portfolio of equities (SSO), bonds (UBT), and gold (UGL). Since 2010, when UBT launched, both leveraged portfolios have outperformed their unleveraged counterparts, and provided returns similar to the S&P 500. U.S. stocks were the key performance driver, as the S&P 500 was in a bull market for most of this 15-year period. Bonds performed strongly between 2010 and 2020, and gold thereafter, so the two assets effectively offset each other’s periods of weakness.
Source: Finominal
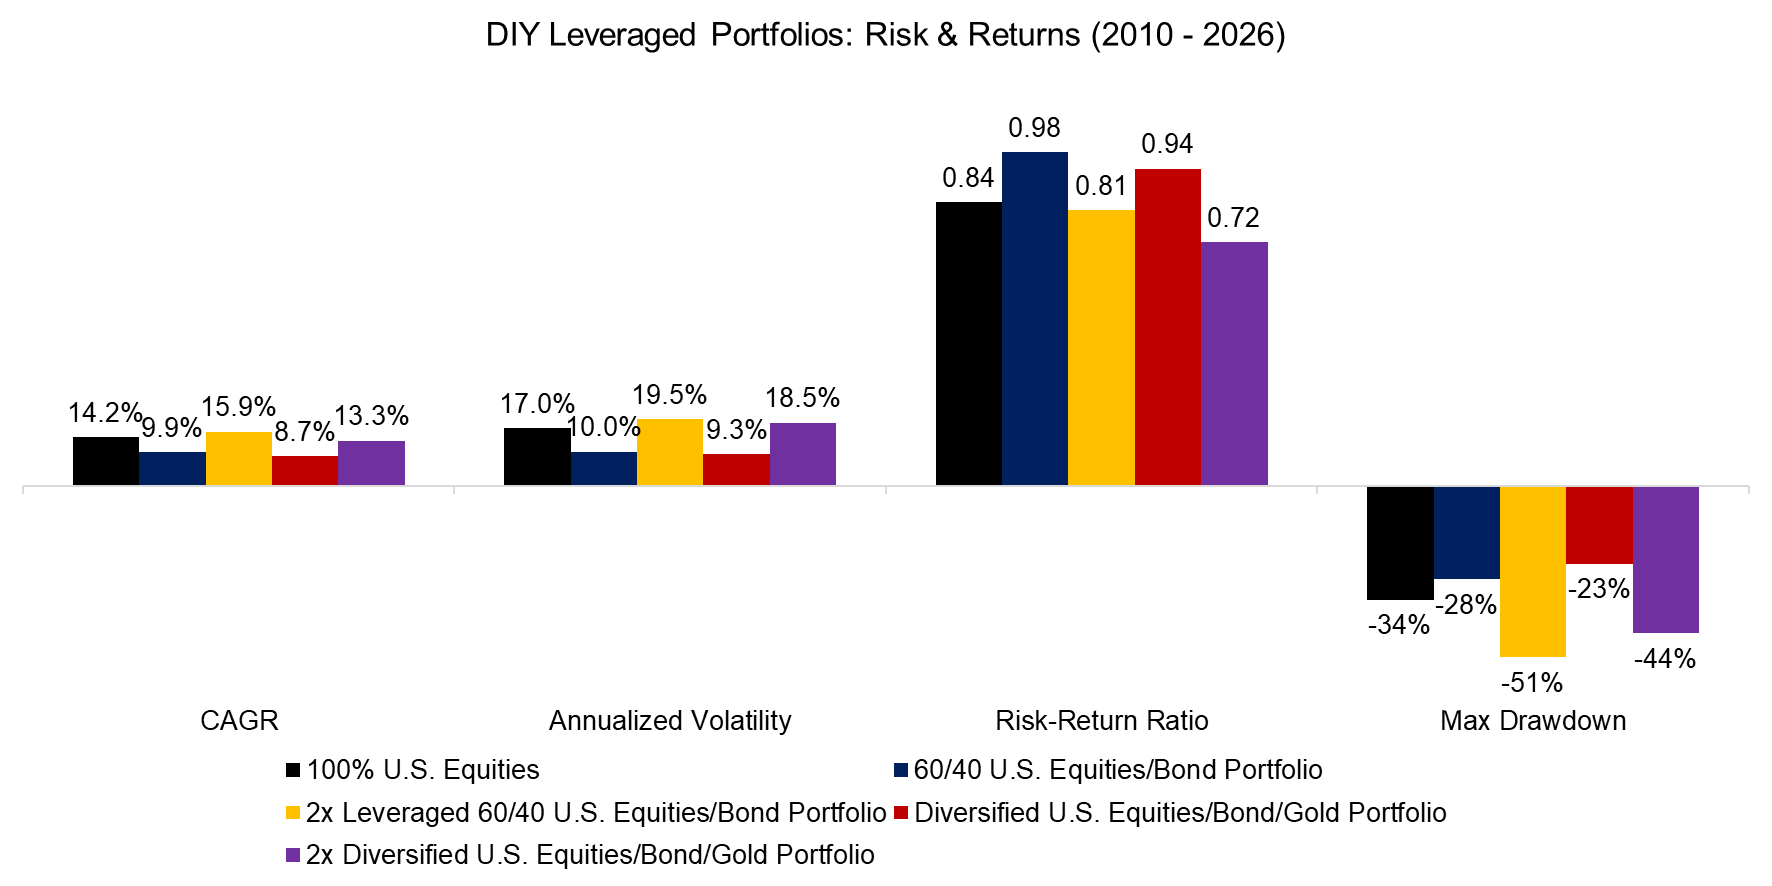
Since 2010, investors could have achieved returns similar to the U.S. stock market by holding leveraged, diversified portfolios. These results are impressive considering that the S&P 500 generated a CAGR of 14.0%, compared with only 2.3% for 20-year U.S. Treasuries and 7.5% for gold over the 15-year period.
However, risk-adjusted returns were no more attractive, and maximum drawdowns were significantly larger. That said, the case for equities is not compelling, as much of their recent return can be attributed to a handful of stocks riding a single theme. Expectations and valuation multiples are high. Leveraging diversified portfolios, especially once including alternatives such as managed futures, seems a sensible strategy going forward.
Source: Finominal
DIY VS RETURN STACKED PRODUCTS
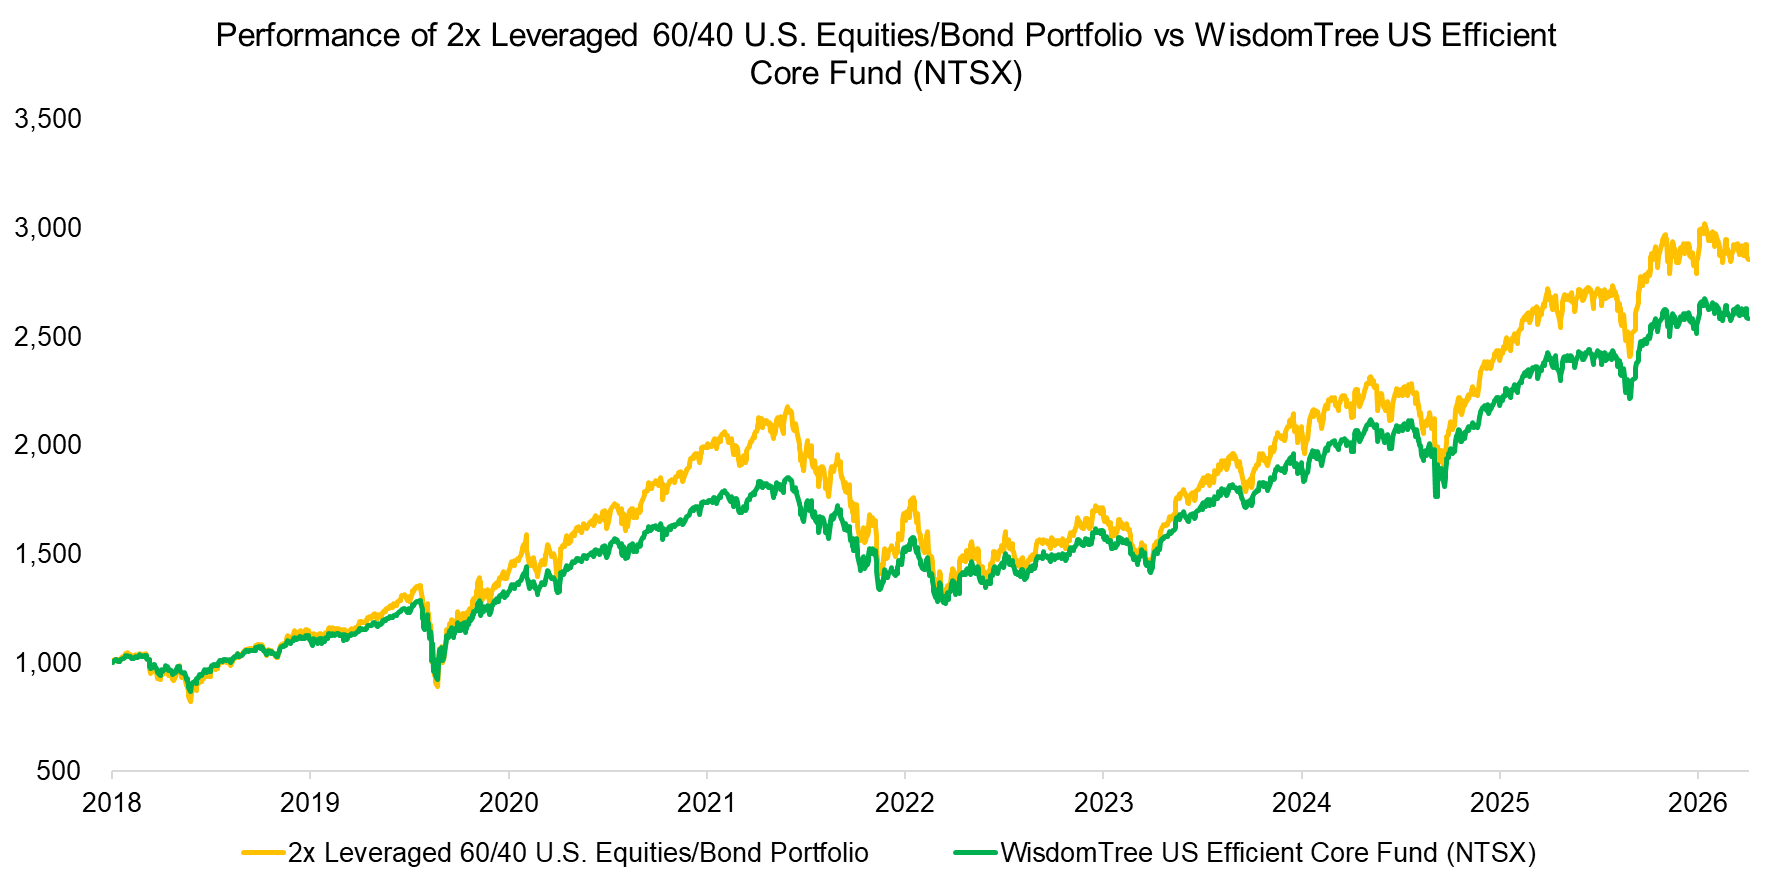
Although a few leveraged multi-asset funds have launched in recent years, most have short track records of less than three years. WisdomTree’s US Efficient Core Fund (NTSX) was launched in 2018, so it has a meaningful data history. We compare the performance of a 2x leveraged 60/40 portfolio comprised of SSO and the ProShares Ultra 7–10 Year Treasury (UST) with NTSX, which provides a 90% allocation to U.S. large-cap stocks and 60% to medium-duration U.S. Treasuries via futures. This makes NTSX a 1.5x leveraged portfolio. We observe that the DIY replication provided higher, more volatile returns, which can be explained by the slight additional leverage. NTSX’s Sharpe ratio is higher at 0.68 vs 0.61 for the replication, which may be attributed to lower fees, as NTSX charges a management fee of only 0.20% pa.
Source: Finominal
FURTHER THOUGHTS
Can investors use leveraged ETFs to create leveraged multi-asset portfolios themselves?
Yes, but leveraged ETFs are unlikely to be a good choice. The daily reset and high management fees make them structurally unattractive for long-term investors. Tradr ETFs, a brand of AXS Investments, has launched leveraged ETFs with monthly and quarterly resets, which is an improvement. However, these charge even higher fees; for example, the Tradr 2X Long SPY Quarterly ETF (SPYQ) has an expense ratio of 1.36% per annum. Futures remain the better tool for implementing leverage, even if they are operationally more complex.
REFERENCED RESEARCH
Why Not 100% Equities, Cliff Asness, Journal of Portfolio Management, 1996
RELATED RESEARCH
Outperformance via Leverage
Replicating Capital-Efficient Funds
100% Equities vs Leveraged Diversified Portfolios: A 100-Year Perspective
60/40 vs Leveraged Diversified Portfolio
60/40 Portfolios Without Bonds
Fund Selection: Equity Substitutes vs Diversifiers
Diversifying vs De-Risking Funds
Diversification vs De-Risking: Evidence Across Asset Classes
Return vs Diversification: What Matters More?
Alts: Volatility Is Not Your Enemy
60/40 vs Leveraged Diversified Portfolio
Diversification versus Hedging II
Diversification versus Hedging
Finding Funds with Diversification Potential
Downside Betas vs Downside Correlations
Bonds versus CTAs for Diversification
Bonds vs Gold vs Managed Futures: A 25-Year Perspective
Bonds vs. Gold vs. Managed Futures: A 100-Year Perspective
Bonds vs. Managed Futures: A 100-Year Perspective
Managed Futures vs Factor Investing: A 100-Year Perspective
ABOUT THE AUTHOR
Nicolas Rabener is the CEO & Founder of Finominal, which empowers professional investors with data, technology, and research insights to improve their investment outcomes. Previously he created Jackdaw Capital, an award-winning quantitative hedge fund. Before that Nicolas worked at GIC and Citigroup in London and New York. Nicolas holds a Master of Finance from HHL Leipzig Graduate School of Management, is a CAIA charter holder, and enjoys endurance sports (Ironman & 100km Ultramarathon).
Connect with me on LinkedIn or X.