Value Factor – Intra vs Cross-Sector
How Effective is Sector-Neutrality?
February 2018. Reading Time: 10 Minutes. Author: Nicolas Rabener.
SUMMARY
- Intra versus cross-sector Value portfolios share the major trends
- Neutralising the sector exposure increases the risk-return ratio of the Value factor
- However, the benefits are marginal and come with higher operational complexity
INTRODUCTION
2018 started almost identical to 2017 in terms of factor performance in the US – Momentum, Growth and Quality gained while Value lost. Investors with a Value focus naturally hope for a better performance this year as they have effectively experienced a lost decade given a flat factor performance since 2008. Aside from waiting for a more favourable environment for Value stocks, which in itself is challenging to identify, investors aim to improve how they define Value stocks and construct portfolios. One common research question is if there is a difference between sector-neutral and cross-sector portfolios. Investors might assume that the factor performance is more attractive if any unwanted risks such as sector exposure are neutralised. In this short research note we will analyse the Value factor in the US intra versus cross-sector and evaluate eliminating any sector-risks (read There is Value in the Value Factor).
METHODOLOGY
We focus on the Value factor in the US, which is defined as a combination of book-value and price-earnings multiples. The factor is created by constructing long-short beta-neutral portfolios of the top and bottom 30% stocks. Portfolios rebalance monthly and include 10bps of transaction costs. Only companies with a market capitalisation of larger than $1 billion are included.
VALUE FACTOR: CROSS-SECTOR – BREAKDOWN BY SECTORS
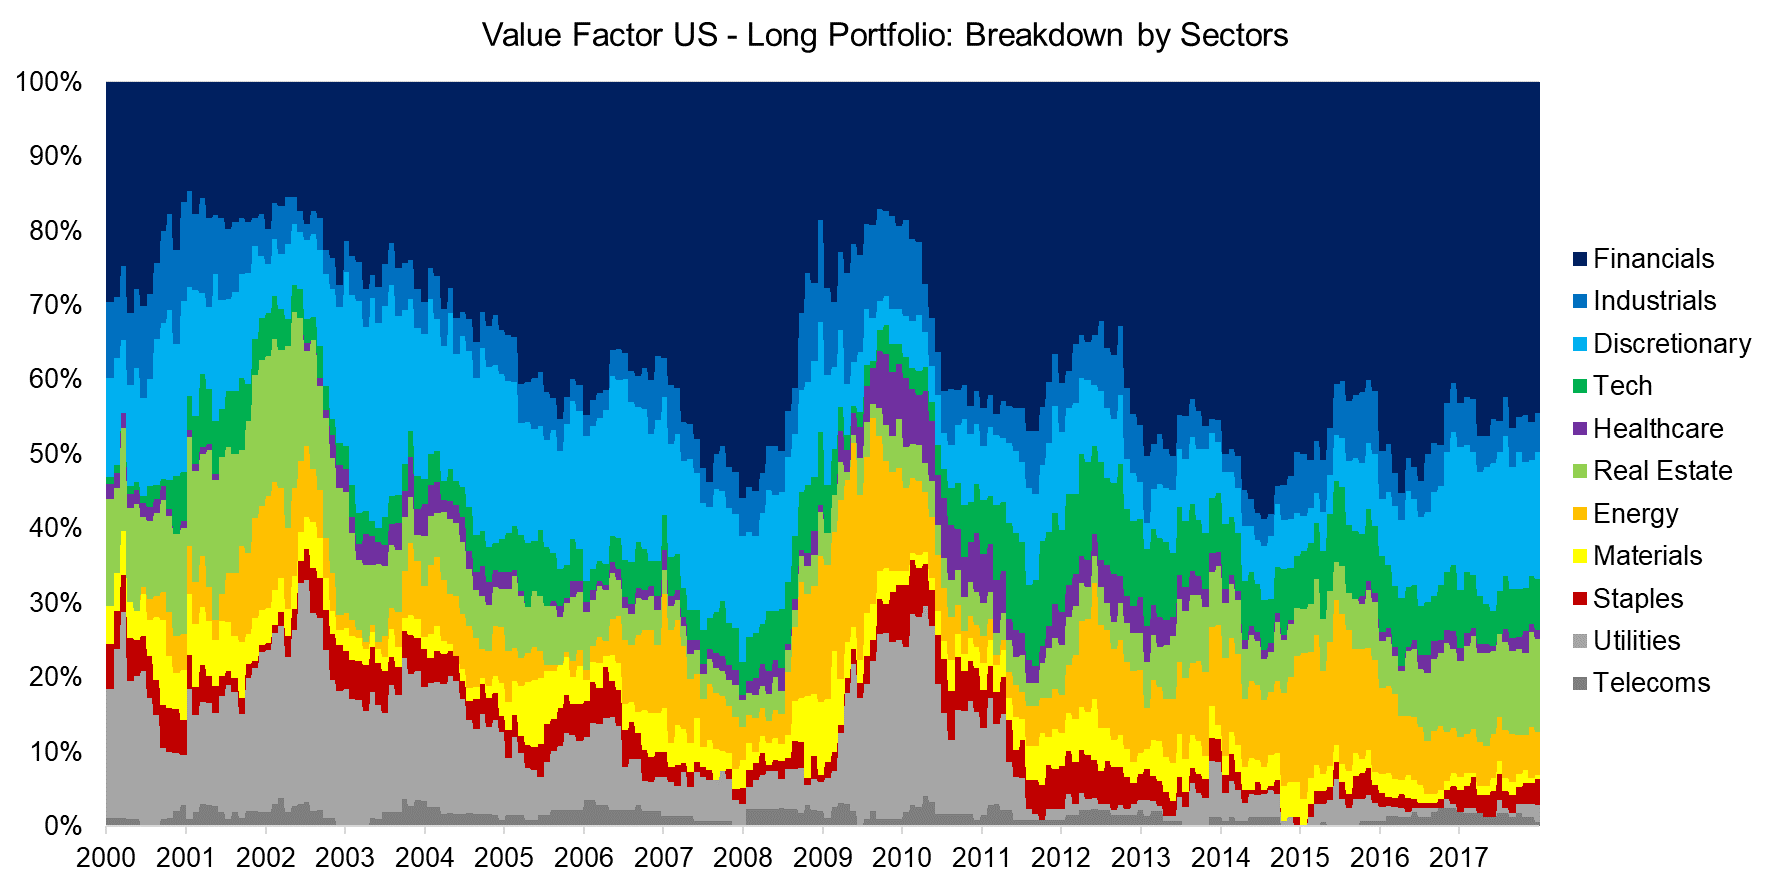
A Value factor portfolio simply represents a portfolio of cheap stocks on the long side and expensive stocks on the short side. The chart below shows the breakdown by sectors for the long portfolio of the cross-sector Value factor in the US from 2000 to 2018. We can observe that Financial stocks dominate the long portfolio currently and historically, i.e. seem perpetually cheap. The analysis highlights the significant sector exposure of the cross-sector portfolio over time, which may be undesirable for investors aiming at harvesting factor returns.
Source: FactorResearch
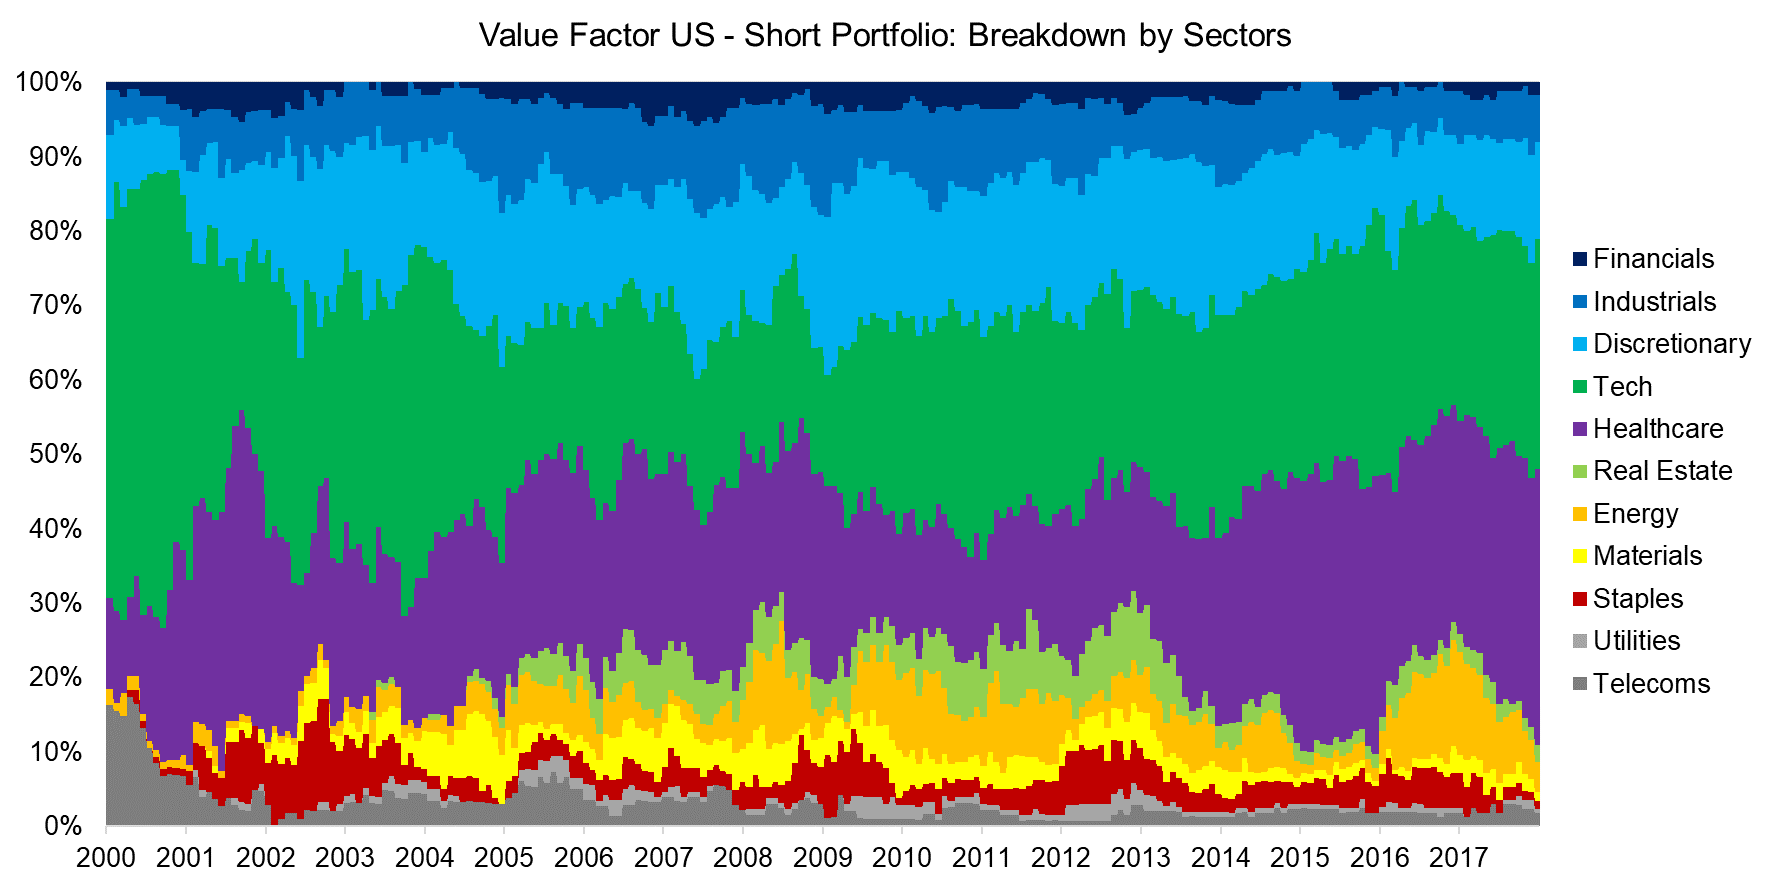
The sector exposure of the short portfolio has varied over time, with the Consumer Discretionary, Technology and Healthcare sectors contributing most stocks. Naturally the sectoral composition depends on the factor definition. Our definition of the Value factor, i.e. a combination of book-value and price-earnings multiples, tends to maximise the universe of available stocks as both metrics are available for all stocks.
Source: FactorResearch
VALUE FACTOR – INTRA VS CROSS-SECTOR: PERFORMANCE
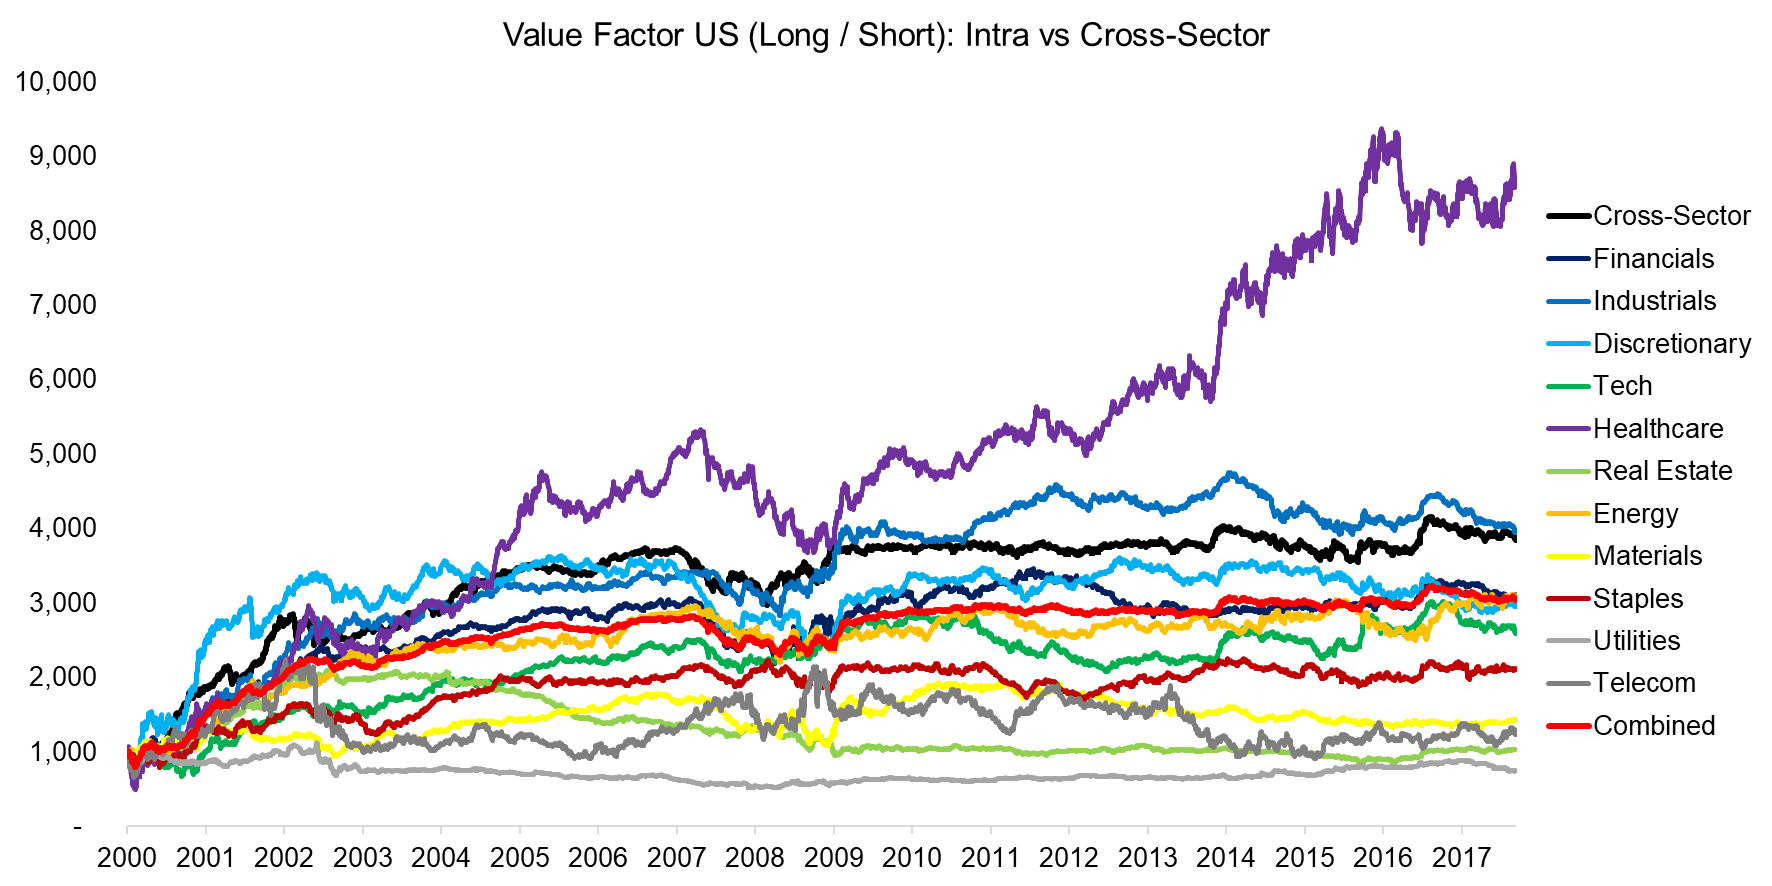
The chart below shows the performance of the Value factor (long / short) in the US from 2000 to 2018 for 11 sectors as well as on cross-sector level. We can observe quite different return profiles for the period with some sectors generating significant returns while others show a flat return profile. The performance of the cross-sector portfolio has been relatively strong and better than that of the combined portfolio, which aggregates the intra-sector profiles and weights these by the number of companies per sector. The trends of the cross-sector and combined portfolios are almost identical, suggesting that sector risks on cross-sector level are being replicated on sub-sector level in the combined portfolio.
Source: FactorResearch
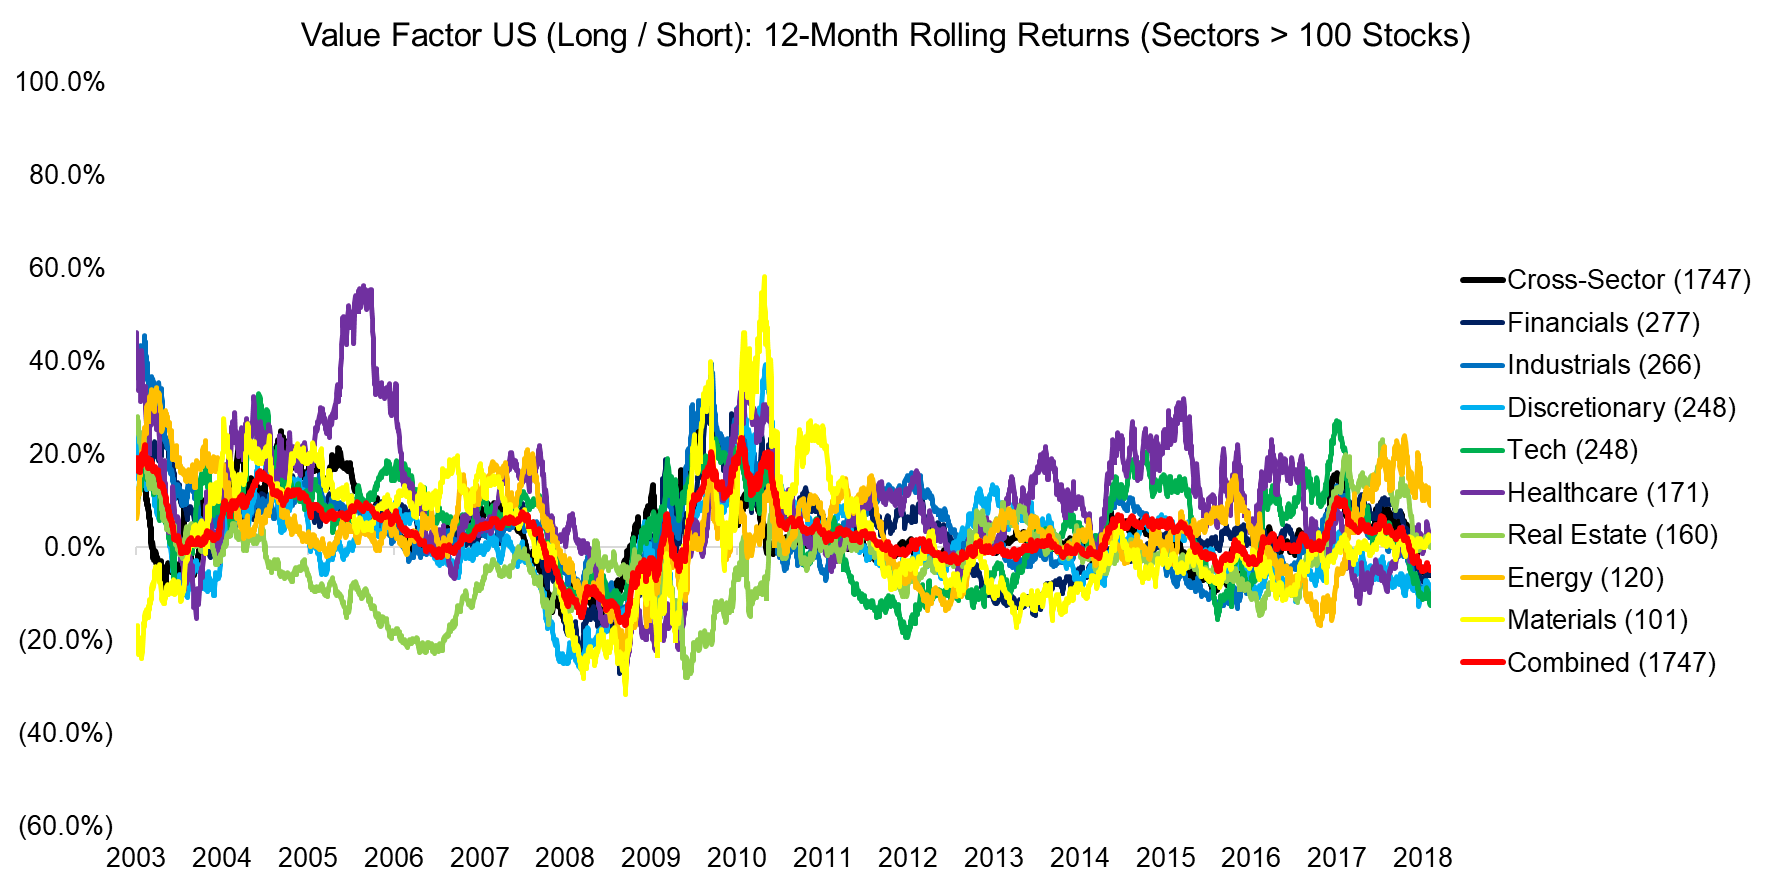
Some sectors like real estate had very few companies in the early years of the analysis, which results in extreme portfolios and may distort the results. The chart below shows the performance as 12-month rolling returns, which makes it easier to analyse similar trends. Any sectors with less than a 100 stocks is removed in order to minimise the impact of single stocks. We can observe that the performance profiles are still heterogeneous, although all portfolios seem to mirror the Global Financial Crisis in 2008 – 2009 in terms of performance, likely indicating that the performance of the Value factor is impacted by investor sentiment. Other factors, e.g. Momentum, show much more homogeneous performance intra versus cross-sector (please see our report Momentum Factor: Intra vs Cross-Sector Level).
Source: FactorResearch. The numbers in brackets represent the number of stocks per sector.
VALUE FACTOR – INTRA VS CROSS-SECTOR: RISK METRICS
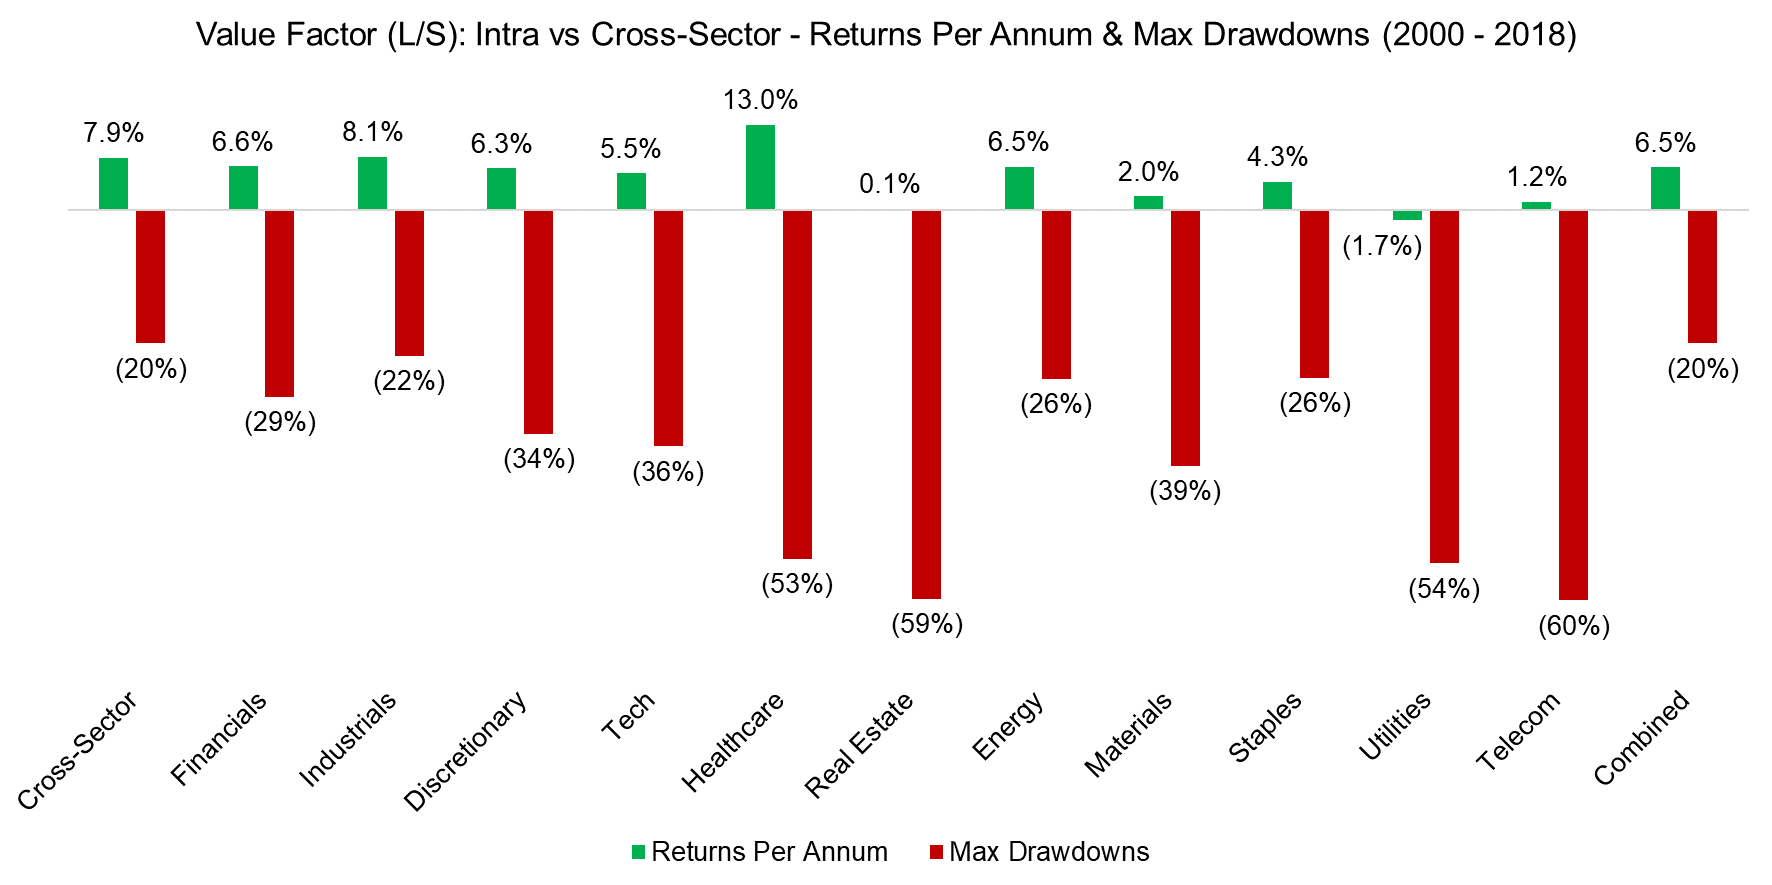
In addition to observing the performance we can analyse the risk metrics. The chart below shows the returns per annum and maximum drawdowns from 2000 to 2018, which vary significantly. The intra-sector portfolios show higher drawdowns compared to the cross-sector portfolio, which reflect sector-neutral but less diversified portfolios. Consequently the combined portfolio, which aggregates the intra-sector portfolios, does not show a lower maximum drawdown than the cross-sector portfolio.
Source: FactorResearch
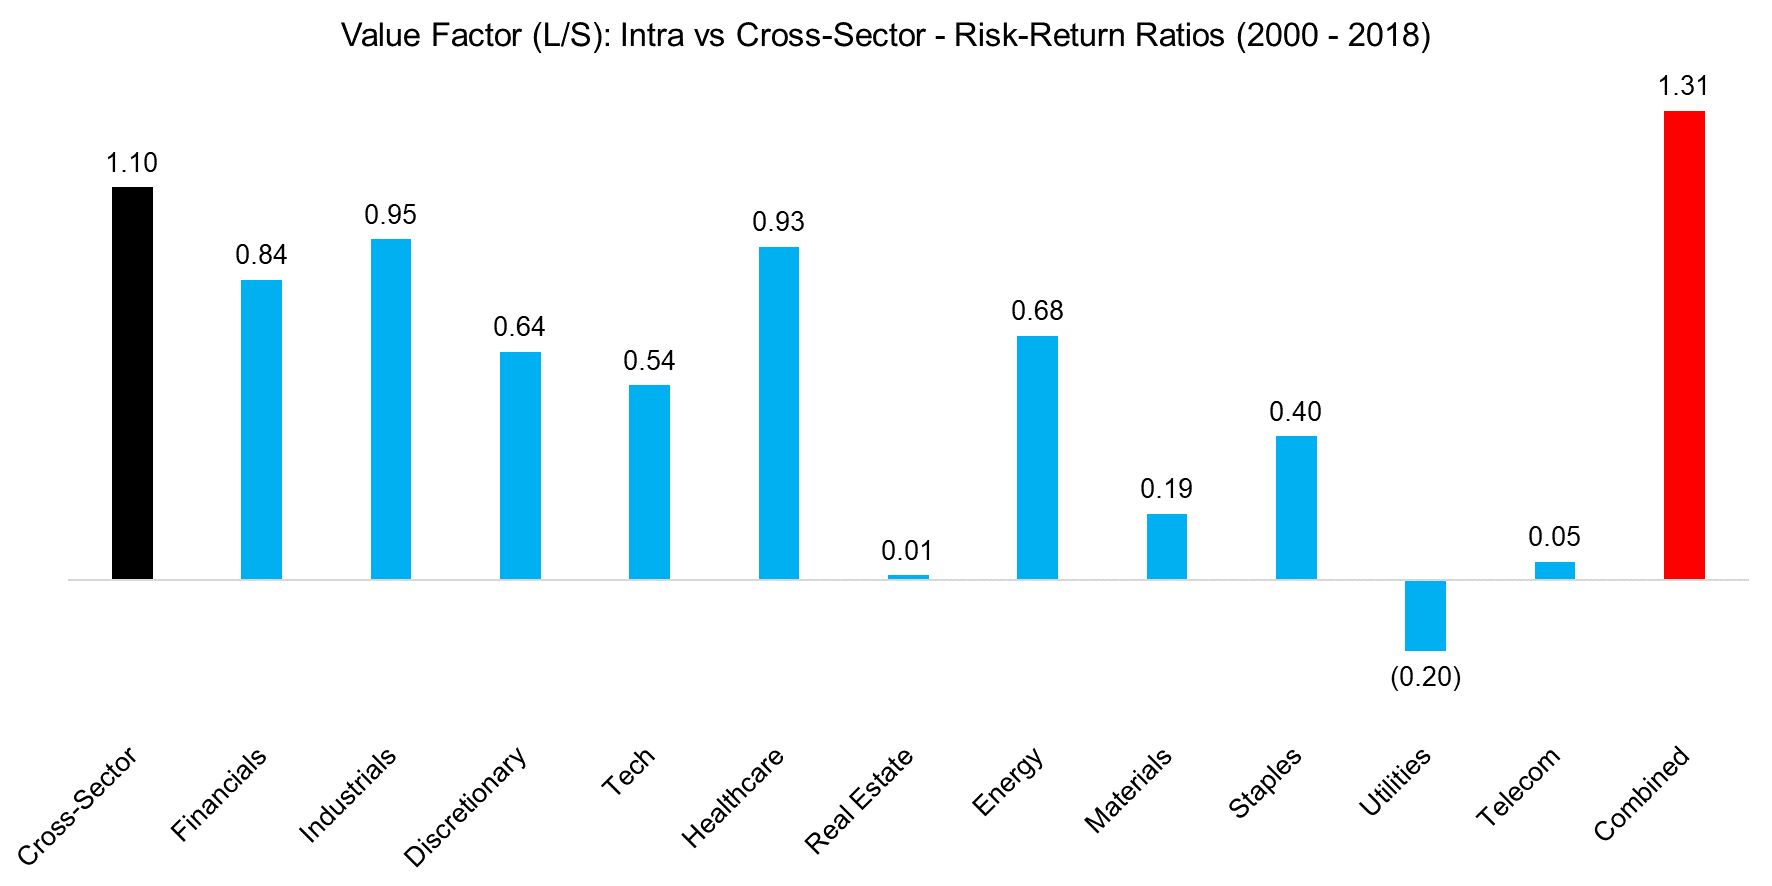
The final chart shows the risk-return ratios, which highlights that the combined portfolio generated the highest risk-return ratio, followed by the cross-sector portfolio. The combined portfolio contains the largest amount of stocks and is therefore much more diversified than any other portfolios, which results in a much lower portfolio volatility and partially explains the high risk-return ratio.
Source: FactorResearch
FURTHER THOUGHTS
This short research note contrasts the Value factor intra versus cross-sector and shows that sector-neutrality offers only marginal benefits to a cross-sector portfolio. Investors might appreciate if sector-risks are neutralised, but it is worth highlighting that the operational complexity increases by managing multiple sector-neutral portfolios, which needs to be considered when constructing a Value portfolio.
ABOUT THE AUTHOR
Nicolas Rabener is the CEO & Founder of Finominal, which empowers professional investors with data, technology, and research insights to improve their investment outcomes. Previously he created Jackdaw Capital, an award-winning quantitative hedge fund. Before that Nicolas worked at GIC and Citigroup in London and New York. Nicolas holds a Master of Finance from HHL Leipzig Graduate School of Management, is a CAIA charter holder, and enjoys endurance sports (Ironman & 100km Ultramarathon).
Connect with me on LinkedIn or X.

