Equity Factors & Inflation
Should Factor Investors Prefer Inflation or Deflation?
April 2018. Reading Time: 10 Minutes. Author: Nicolas Rabener.
SUMMARY
- Factor performance is impacted by inflation and deflation
- An inflationary environment is more attractive for most factors
- The change in inflation has been most meaningful for the Size factor
INTRODUCTION
We recently published a research note on the relationship between factor returns and real GDP growth (Equity Factors & GDP Growth), which highlighted that some factors exhibit pro-cyclical while others have anti-cyclical characteristics. The Value and Size factors showed strong returns when economic growth was high while the Quality and Growth factors performed best when real GDP declined. In another research note (Factors & Interest Rates) we observed that there are no consistent relationships between factor performance and interest rates. Given that we covered real GDP and interest rates, we are only missing inflation in terms of analysing the most important macroeconomic variables and their impact on factor performance. This short research note evaluates the relationship between equity factor returns and inflation in the US.
METHODOLOGY
We initially focus on the Value, Size and Momentum factors from Fama-French, which are constructed as dollar-neutral long-short portfolios based on the top and bottom 10% of the US stock market. The data includes companies with small market capitalisations, excludes transaction costs and is available since 1926. We expand the factor set by the Low Volatility, Quality, Growth and Dividend Yield factors based on our own data, which is available since 2000. These are created via long-short beta-neutral portfolios and only include stocks with a market capitalisation of larger than $1 billion. Portfolios are rebalanced monthly and each transaction occurs costs of 10 basis points.
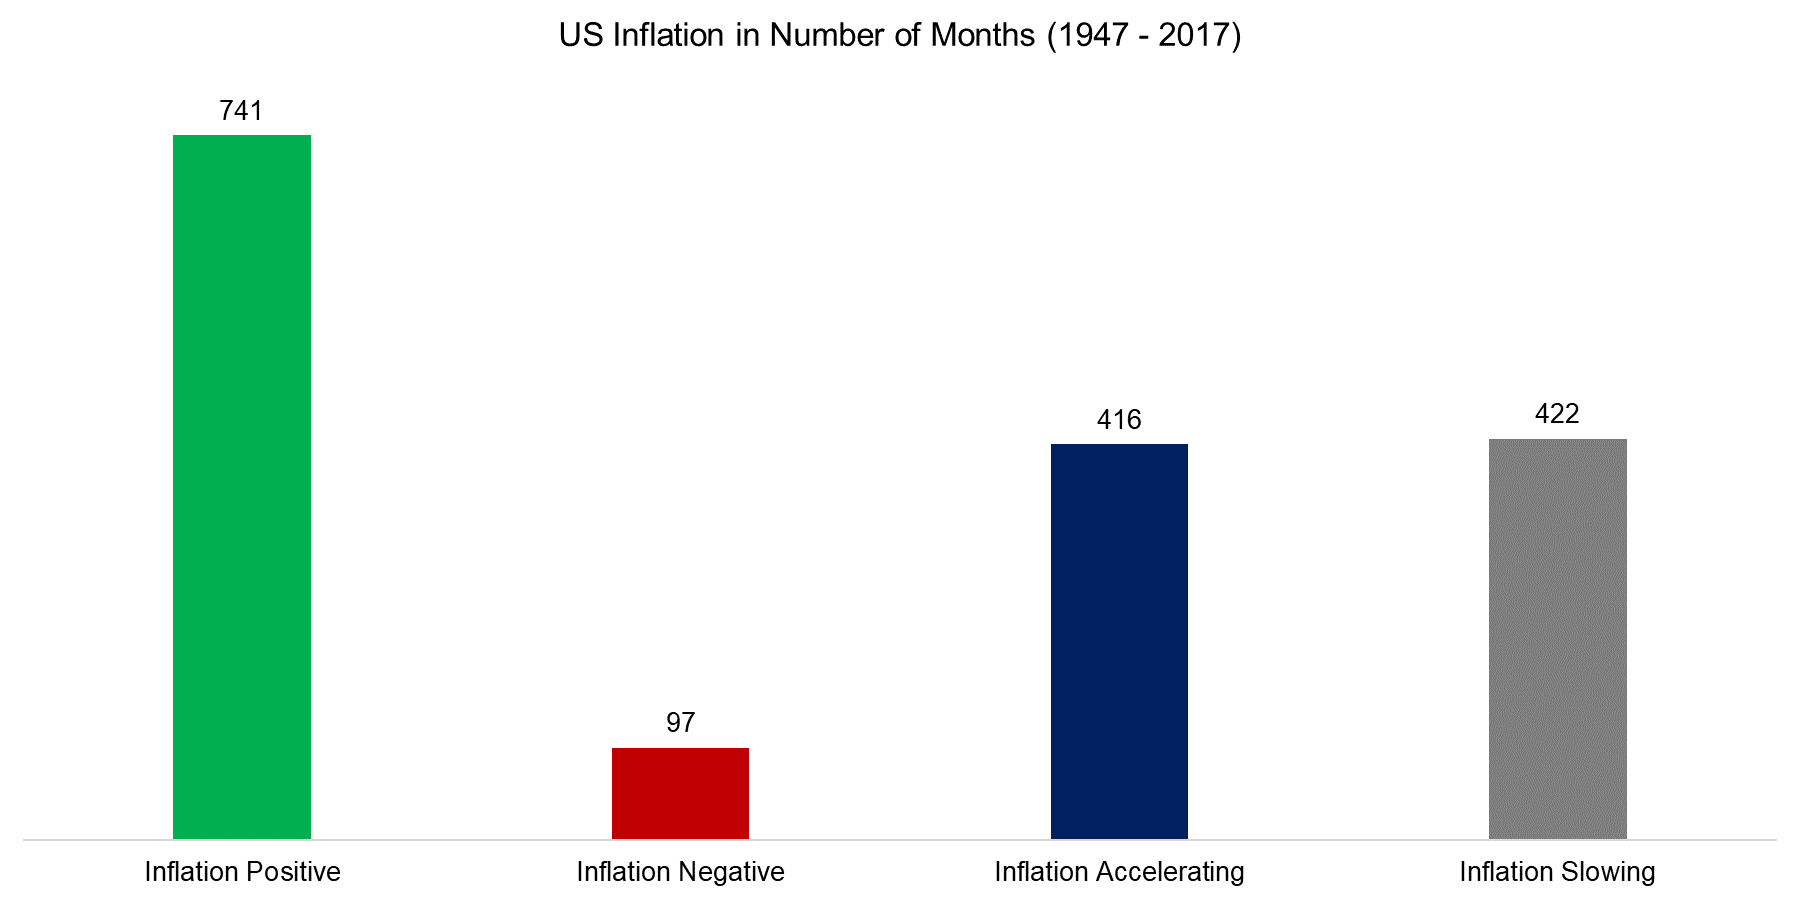
Inflation data is sourced from the Federal Reserve Bank of St. Louis and available since 1947. The chart below shows the number of months with positive and negative inflation as well as accelerating and decelerating inflation, which is defined as the last month divided by the average inflation of the previous 12 months. We can observe that more than 88% of the months showed positive inflation, likely reflecting the healthy economy and demographics of the US, and that the split between acceleration and slowdown was almost equal.
Source: Federal Reserve Bank of St. Louis, FactorResearch
EQUITY FACTORS & INFLATION: 1947 – 2017
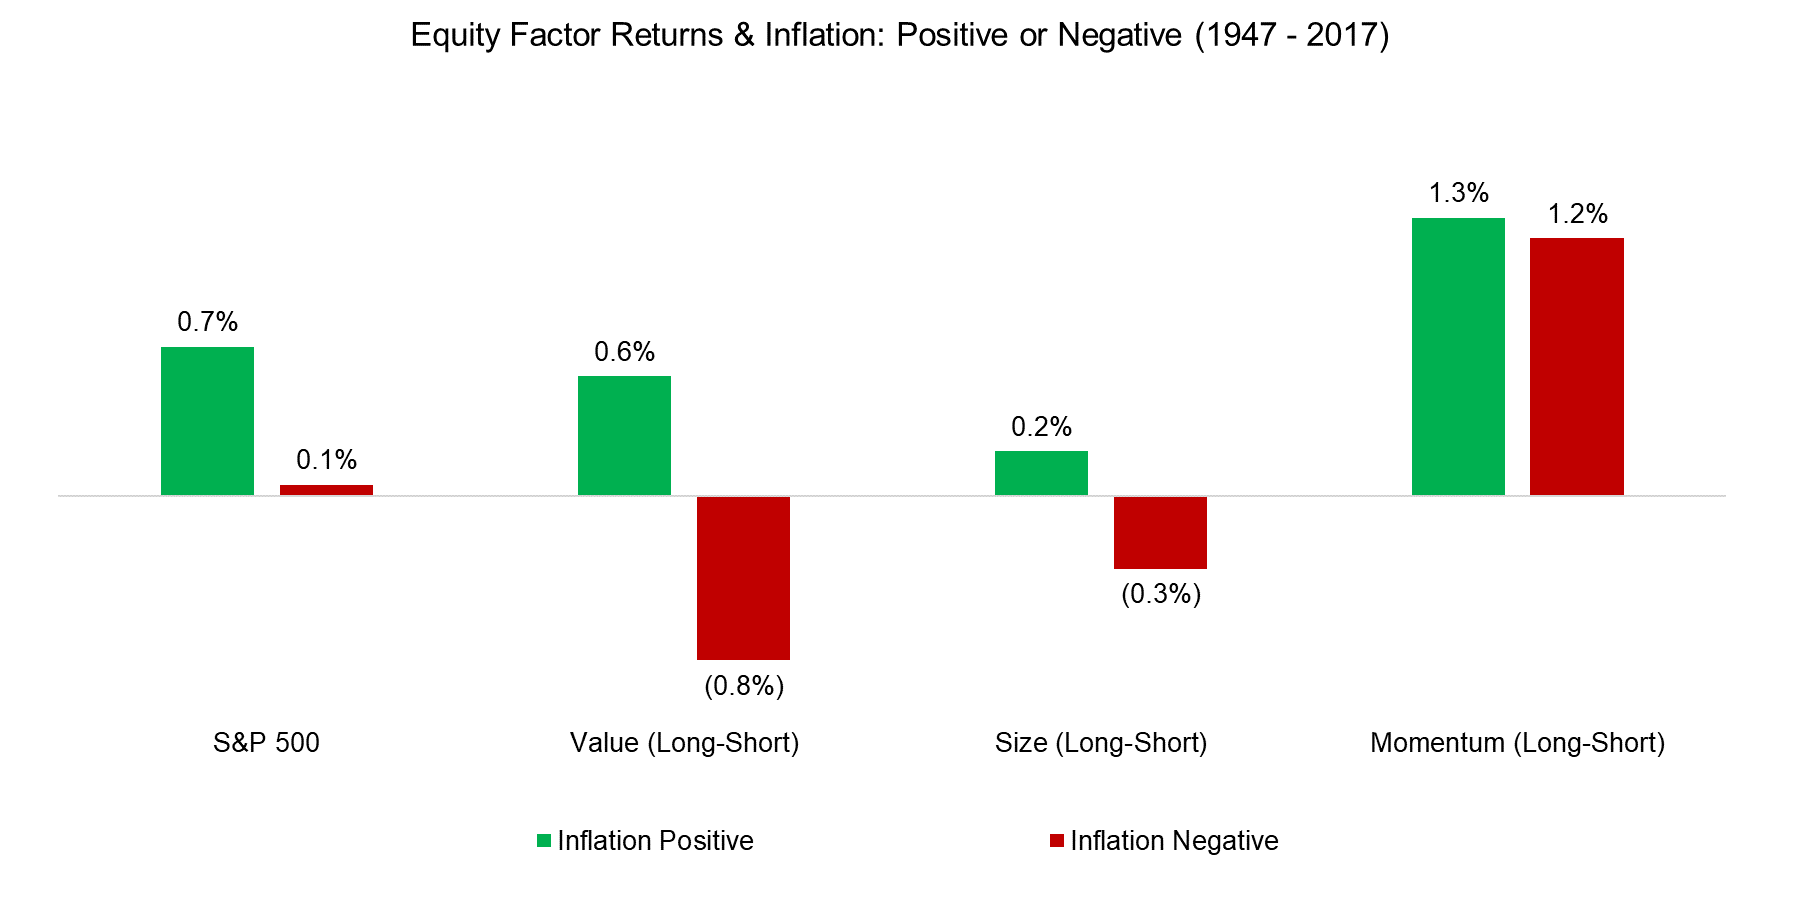
The chart below shows the returns of the S&P 500 and three factors (long-short) since 1947 sorted by positive and negative months of inflation. We can observe that equity markets as well as the Value and Size factors generated positive returns in periods of positive inflation, however, negative inflation led to negative returns for the two factors. Deflation likely occurs when the economy is slowing down or in a recession, which highlights the pro-cyclical characteristics of the Value and Size factors. The Momentum factor generated similar positive returns in inflationary and deflationary environments.
Source: Fama-French, Federal Reserve Bank of St. Louis, FactorResearch
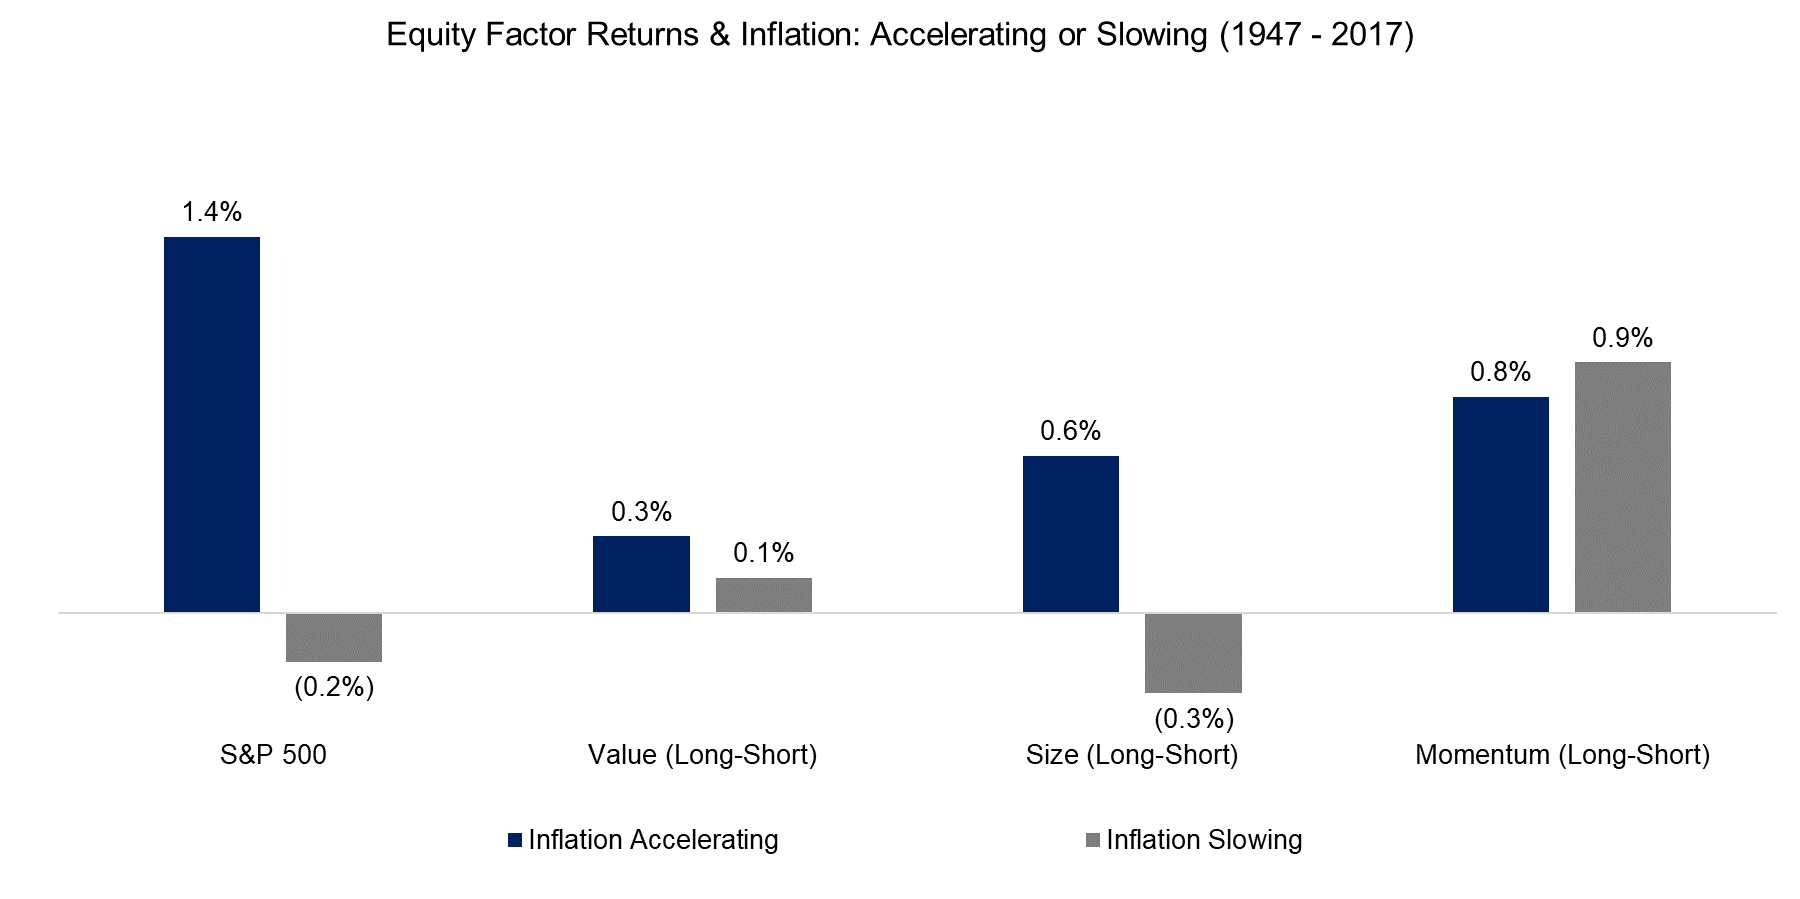
Since 1947 the US had a long period of consistently rising inflation, which peaked above 10% per annum in the 1970s, and then declined slowly to the current levels of approximately 2%, supported by an inflation-targeting central bank. The chart below highlights the factor performance when the growth of inflation was accelerating and slowing down. We can observe that a slowdown in inflation generated negative returns for the Size factor as well as for the S&P 500.
Source: Federal Reserve Bank of St. Louis, FactorResearch
The Size factor, i.e long small and short large caps, approximately mirrors the long upward and downtrend of inflation from 1963 to 2000. It is somewhat challenging to explain this relationship and there are multiple possible reasons, e.g. smaller companies might have been less affected by the dramatic changes in the oil price during that period compared to larger companies or might be better at adjusting to rapidly rising inflation from a revenue and cost perspective.
EQUITY FACTORS & INFLATION: 2000 – 2017
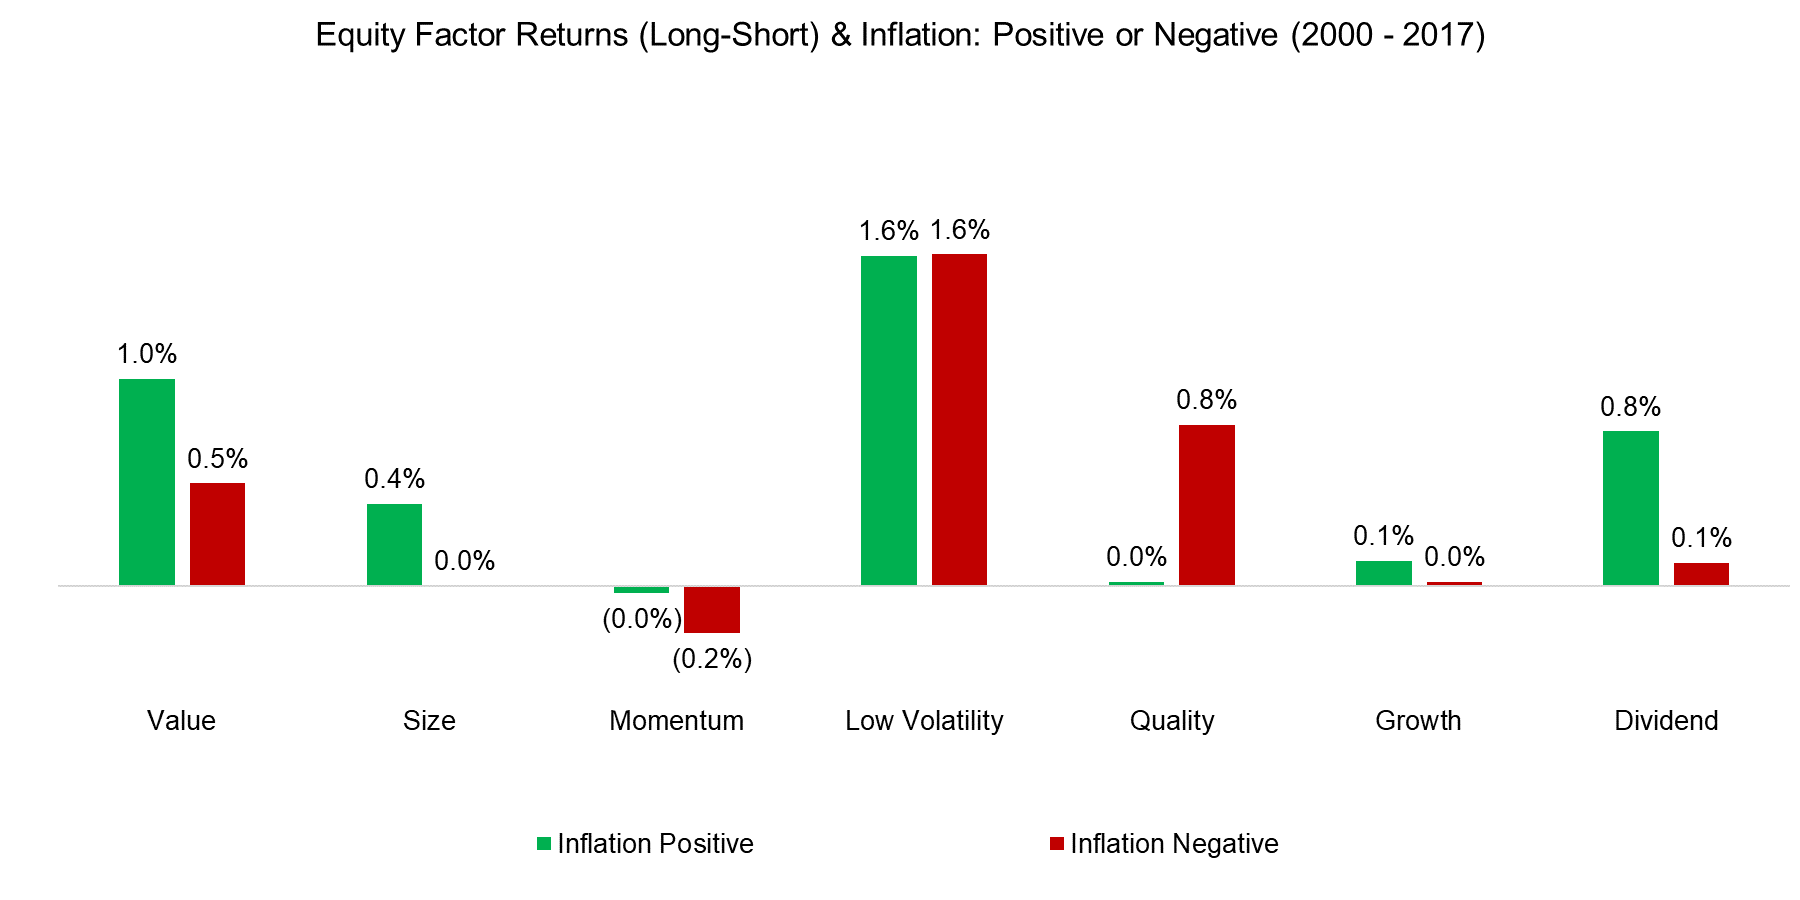
We can extend the analysis by adding additional factors, where data is available since 2000. The chart below shows the performance for seven factors from 2000 to 2017, which was quite heterogeneous when divided into periods of positive and negative inflation. Investors might have expected that the Low Volatility factor would generate higher returns in periods of deflation versus inflation as then interest rates would more likely to be decreasing than increasing, which is beneficial for the factor given its bond-proxy characteristics. However, the US central bank policy post the Global Financial Crisis has been unusual given quantitative easing and the link between inflation and interest rates has likely been weaker than historically.
Source: Federal Reserve Bank of St. Louis, FactorResearch
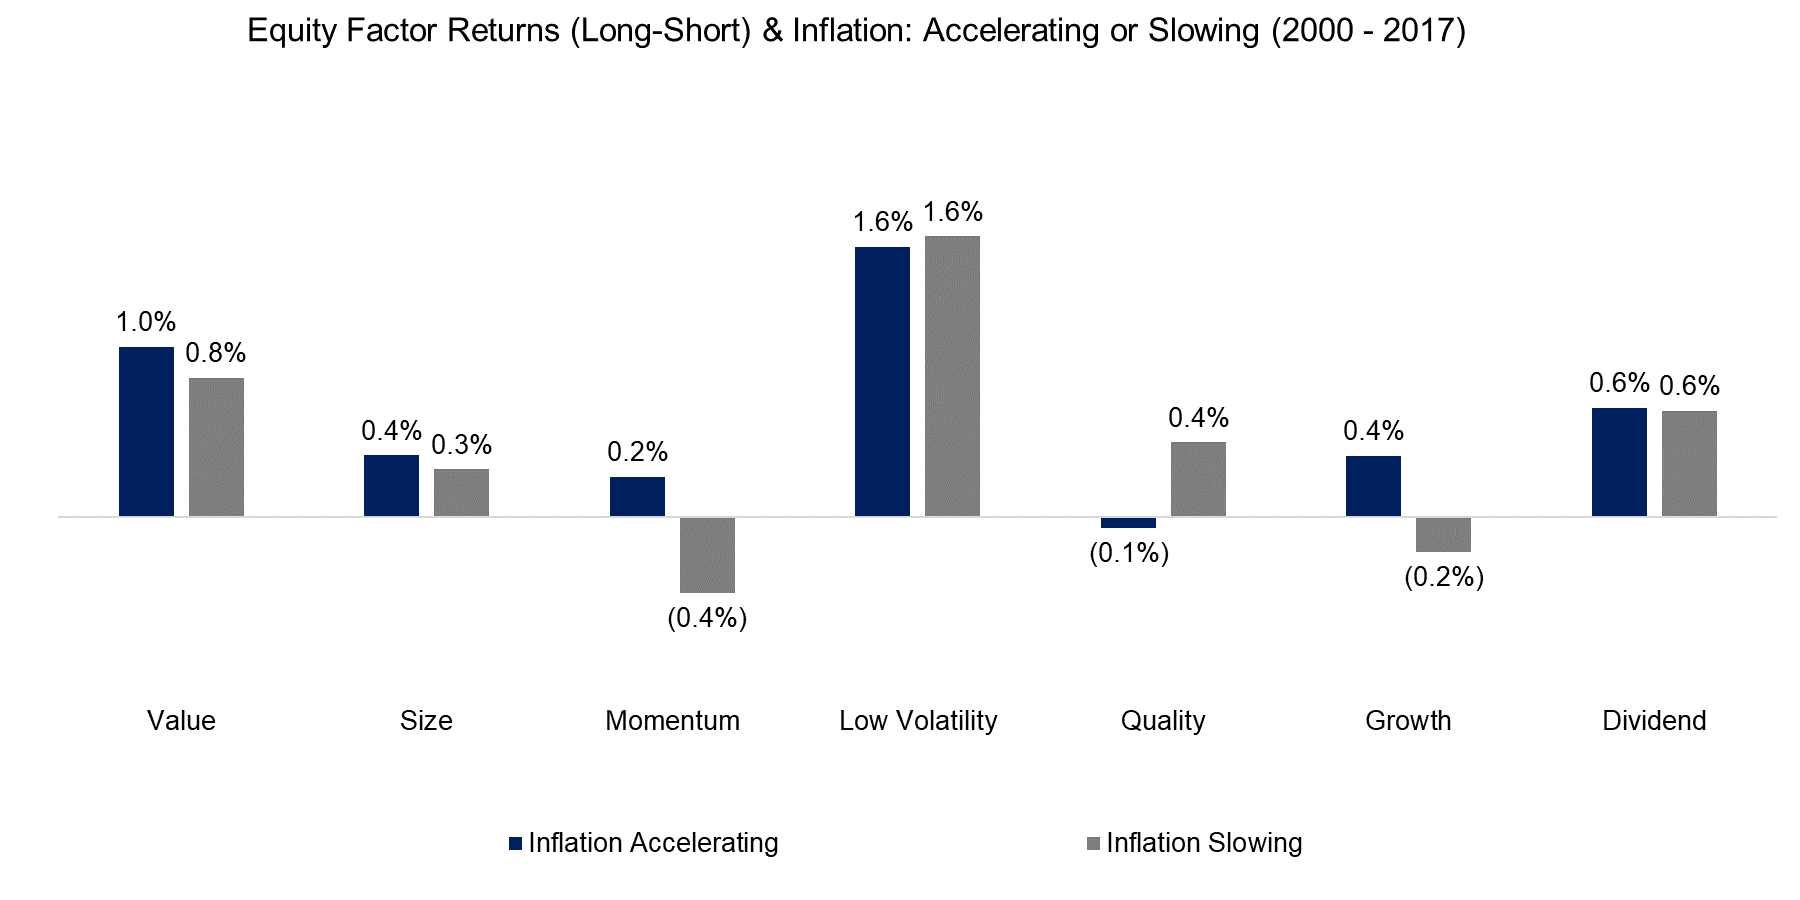
The chart below shows the factor performance in periods of acceleration and slowdown in inflation and no clear relationship emerges, which contrasts to the relationship with real GDP, which highlighted pro-cylical and anti-cyclical characteristics.
Source: Federal Reserve Bank of St. Louis, FactorResearch
INFLATION EXPECTATIONS
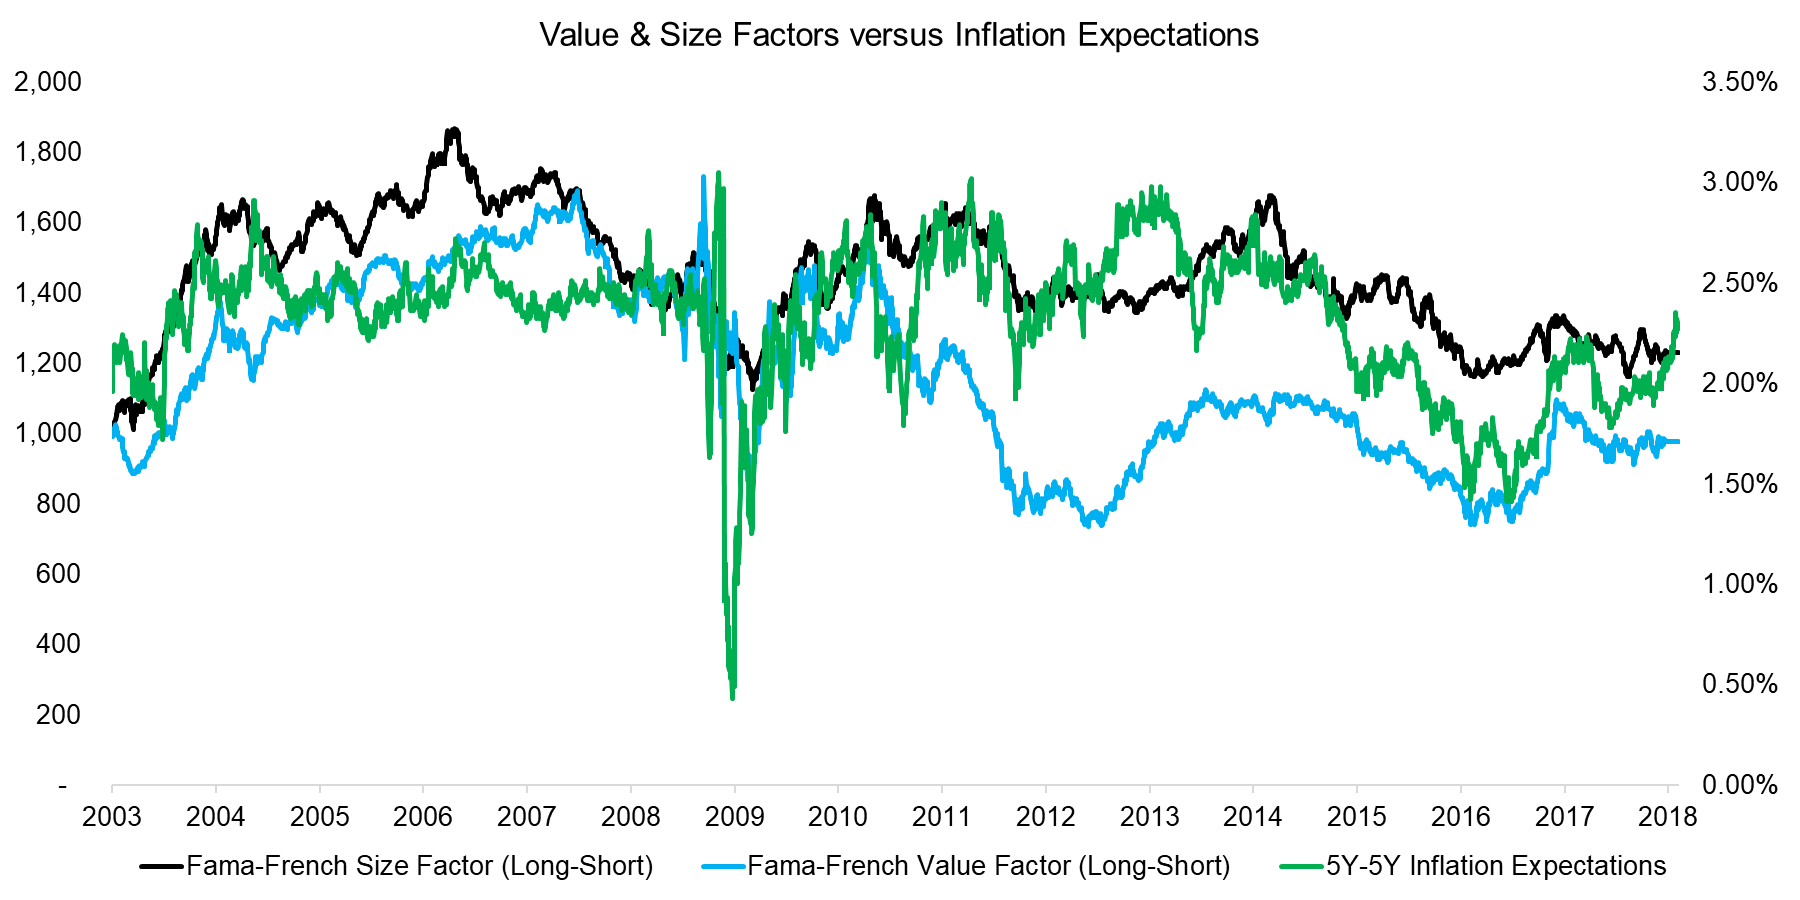
Economic data tends to get published long after the observation period and is often revised thereafter, which makes it less attractive for investment analysis. However, there are a few forward-looking data sets like the 5 year-5 year inflation expectations, which highlights the expected average level of inflation over 5 years 5 years from today and is available on a daily basis. The chart below shows the Value and Size factors and inflation expectations and we can identify some similar trends. However, we can also observe that inflation expectations is not a leading, but more likely a coincident indicator of factor performance.
Source: Fama-French, Federal Reserve Bank of St. Louis, FactorResearch
FURTHER THOUGHTS
This short research notes highlights the performance of common factors in different periods of inflation, which shows that equity and factor investors should have a preference for inflation over deflation. Although inflation has increased recently across the global economy, deflation might be more likely in many countries given record of levels of debt and poor demographics. Naturally central banks will fight deflation, but it is challenging fighting a declining population with monetary policy as the experience in Japan shows.
ABOUT THE AUTHOR
Nicolas Rabener is the CEO & Founder of Finominal, which empowers professional investors with data, technology, and research insights to improve their investment outcomes. Previously he created Jackdaw Capital, an award-winning quantitative hedge fund. Before that Nicolas worked at GIC and Citigroup in London and New York. Nicolas holds a Master of Finance from HHL Leipzig Graduate School of Management, is a CAIA charter holder, and enjoys endurance sports (Ironman & 100km Ultramarathon).
Connect with me on LinkedIn or X.

