Measuring Factor Crowding via Valuations
Investigating Crowd Control Measures for Factor Investing
June 2018. Reading Time: 10 Minutes. Author: Nicolas Rabener.
SUMMARY
- Fundamental factor valuations can be used to identify factor crowding
- However, the approach does not improve risk metrics
- A multi-metric approach for identifying factor crowding is likely more successful
INTRODUCTION
The Value factor has generated flat returns over the last decade, which has been challenging for the most dedicated Value investors. Given that the average mutual fund holding period is three years, investors might question if the Value factor has become a contrarian call, which arguably makes it less risky compared to investing in the growth-oriented FAANG stocks. Factors, from a Value perspective, should be more attractive if they are cheaper and uncrowded and more risky if they are expensive and crowded. In this short research note we will analyse factor crowding from a fundamental valuation perspective using price-to-book multiples, starting with the Value factor as a case study and then expanding the analysis to other common equity factors.
METHODOLOGY
We focus on seven factors namely Value, Size, Momentum, Low Volatility, Quality, Growth and Dividend Yield in the US. The factor definitions are in line with industry standards and the factors are created via long-short beta-neutral portfolios based on the top and bottom 10% of the US stock market. Only stocks with a minimum market capitalisation of $1 billion are included. Portfolios are rebalanced monthly and each transaction incurs costs of 10 basis points.
VALUE FACTOR: FUNDAMENTAL FACTOR VALUATION
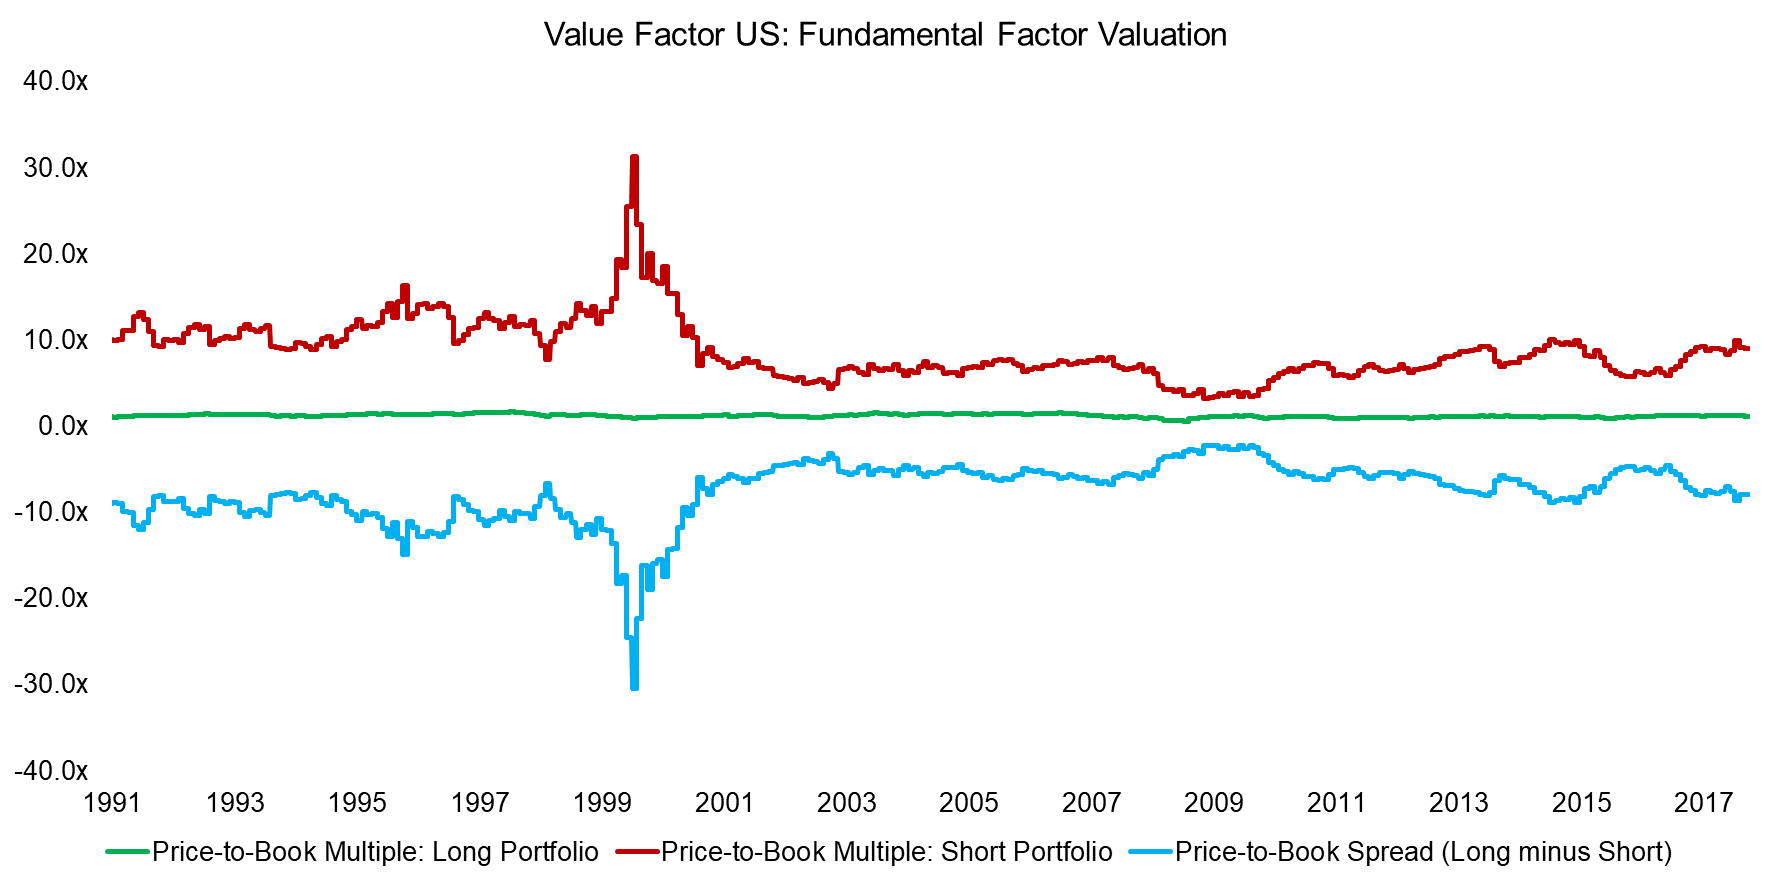
The concept of valuing a security with fundamental multiples can be applied to single stocks as well as to factors. In the case of factors, the valuation can be determined by measuring the price-to-book multiple spread, which is derived by subtracting the multiple of the short portfolio from the multiple of the long portfolio. For example, if the long portfolio has a price-to-book multiple of 1.0x and the short portfolio of 5.0x, then the spread is -4.0x. If assets are flowing into the factor, then the long portfolio will become more expensive as investors are buying the cheap stocks and the short portfolio will become cheaper as investors are selling the expensive stocks, which will result in a more positive spread. Stated from a Value perspective, the higher the price-to-book spread, the more expensive and crowded the factor.
The chart below shows the price-to-book multiples of the long and short portfolios as well as the spread of the Value factor in the US (read There is Value in the Value Factor). We can observe that the multiple of the long portfolio is almost constant at around 1.0x over time, while the multiple of the short portfolio varies significantly. The peak in 2000 represents the Tech bubble, where Technology stocks were trading at absurdly high multiples. During that period the Value factor was trading at an extremely attractive level compared to its history and was uncrowded as investors were not interested in cheap stocks. However, it is somewhat difficult to identify periods where the factor was expensive and crowded.
Source: FactorResearch
It is worth highlighting the following regarding the price-to-book spread:
- From a quantitative perspective the price-to-book spread data is difficult to work with given the magnitude of the increase in multiples in the short portfolio during the Tech bubble. The absolute spread is somewhat meaningless post 2000 as these levels were never reached again, although theoretically they could be reached again at any time. Investors could choose to ignore that period, but that is alike to ignoring the Global Financial Crisis and debatable.
- The Tech bubble valuation distortion affects all factors, although in different directions. For example, the Value and Size factors became cheap and uncrowded based on their price-to-book spreads while the Growth and Momentum factors became expensive and crowded.
- Price-to-book can be challenged as a metric for valuing stocks, but the Tech bubble is also reflected in other measures such as price-to-earnings or cashflow-based multiples.
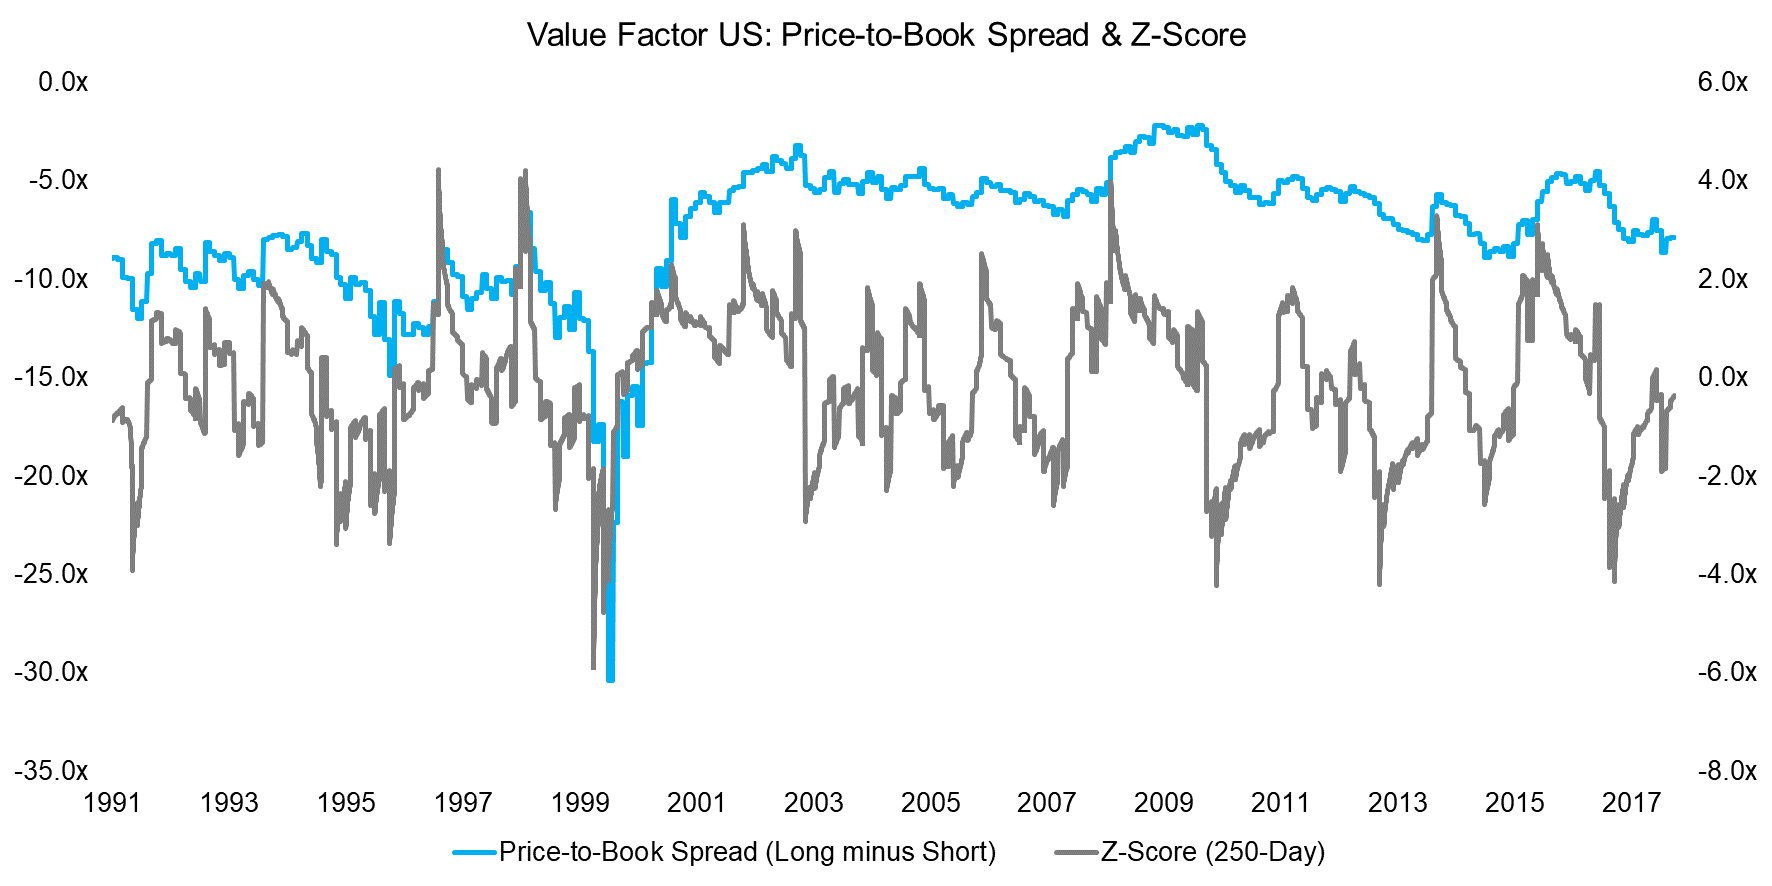
One solution for mitigating this data issue is to normalise the price-to-book spread data by calculating z-scores, which can be used to identify periods where the price-to-book spread is increasing or decreasing significantly. Positive z-scores indicate that the spread has become more positive, i.e. the short portfolio slightly less expensive as the long portfolio does not vary much over time, while negative z-scores indicate that the spread has become more negative, i.e. the short portfolio more expensive. From a Value perspective an investor might argue that positive z-scores represent a period where the factor is less attractive and crowded (read Value Factor – Comparing Valuation Metrics).
Source: FactorResearch
VALUE FACTOR WITH VALUATION FILTERS
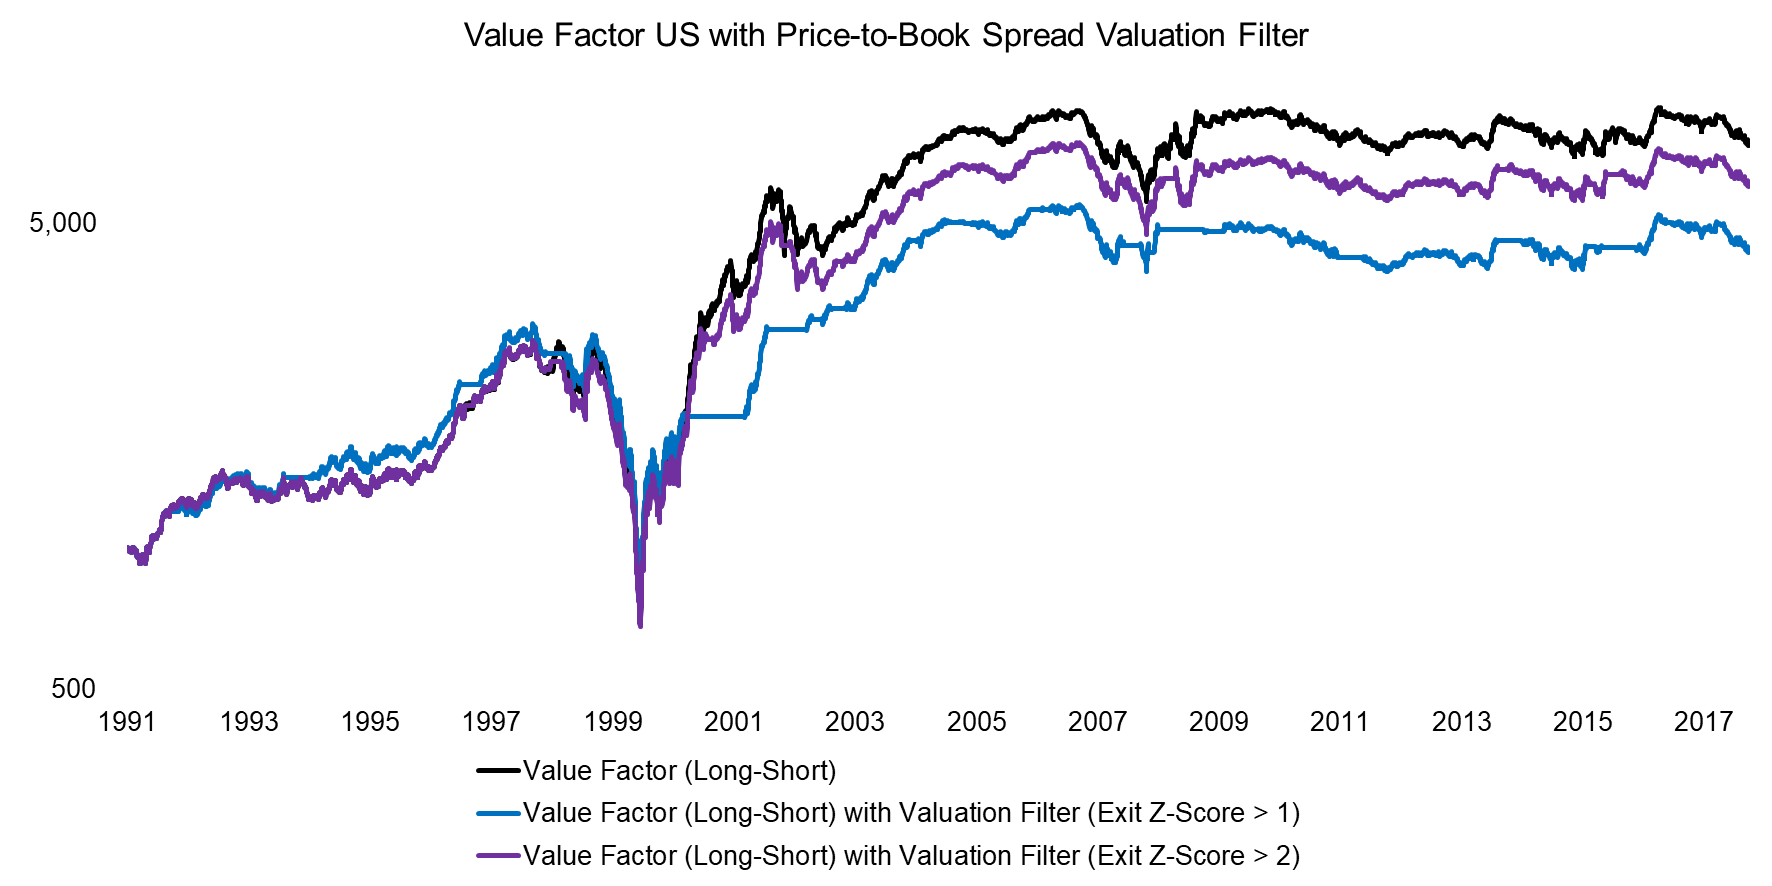
Investors concerned about factor crowding can use the z-score-based fundamental valuation approach to reduce factor exposure when valuations are unattractive. The analysis below highlights this approach applied to the Value factor, one scenario where the exposure is reduced to zero if the z-score is above 1, which occurs 25% of the time, and above 2, which occurs only 5% of the time. We can observe that both scenarios generate a similar profile to the unadjusted long-short Value factor. The significant drawdown during the Tech bubble in 2000 is not reduced, which is expected as the Value factor was not particular expensive or crowded prior to that period.
Source: FactorResearch
EQUITY FACTORS WITH VALUATION FILTERS
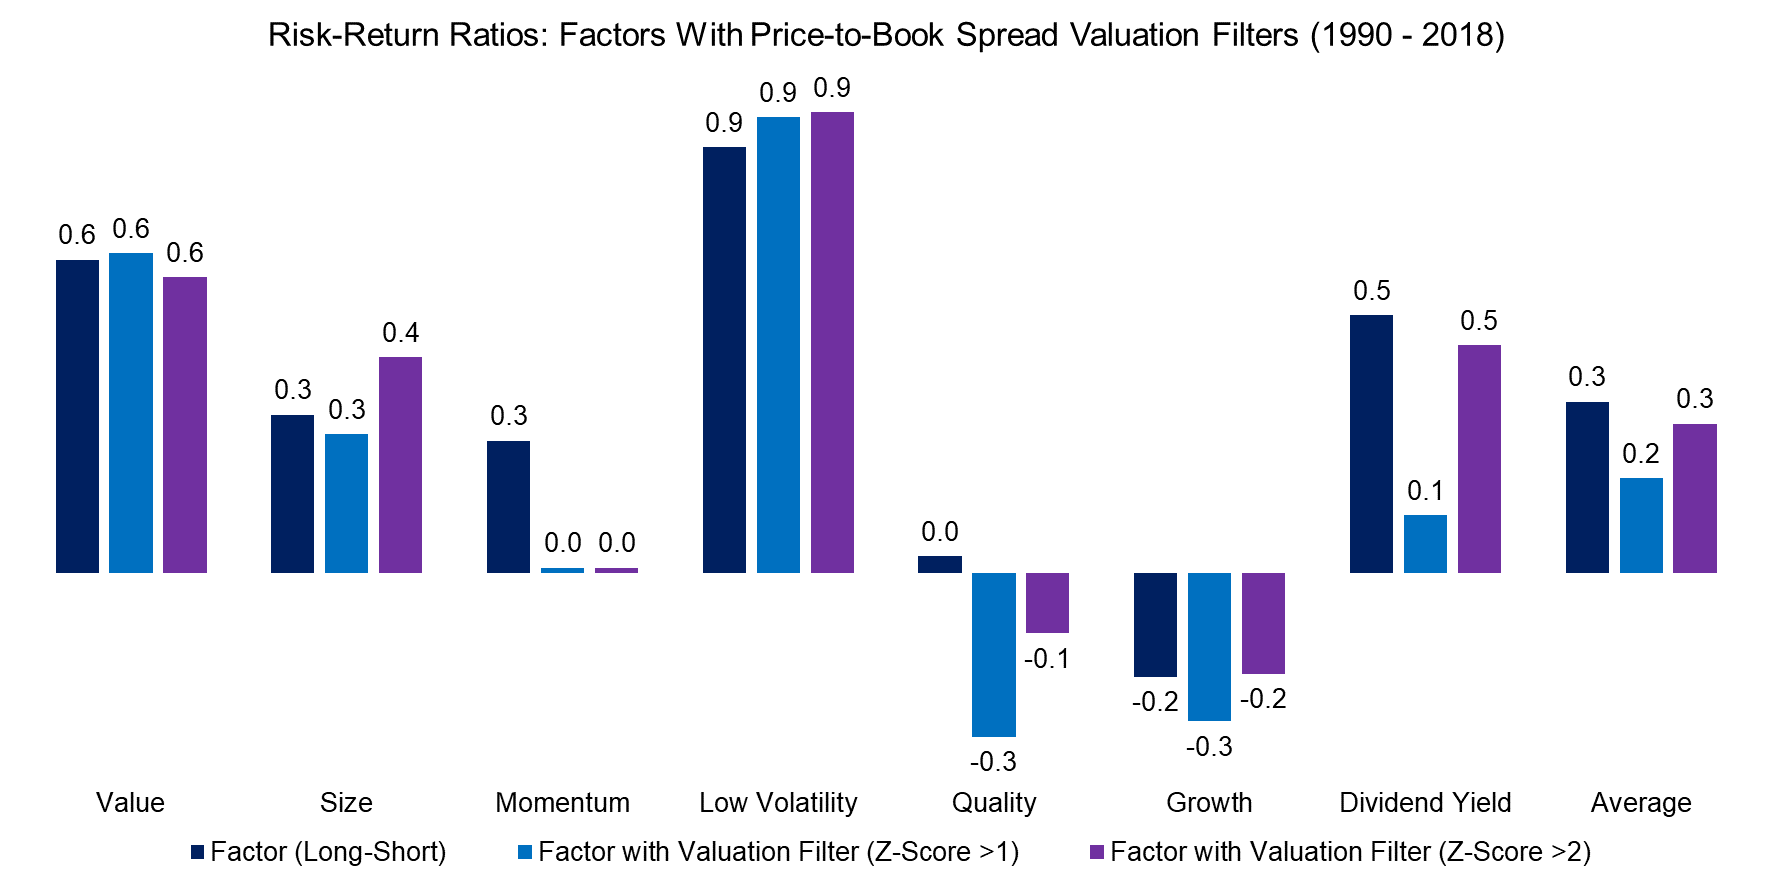
Given that applying a fundamental valuation filter to identify crowding in the Value factor did not generate attractive results, it is worth testing this approach on other factors. The analysis below highlights the risk-return ratios of common equity factors in the US and scenarios where the same valuation filters have been applied. We can observe that on average applying a valuation filter to avoid periods of crowded factors did not improve the risk-return ratios.
Source: FactorResearch
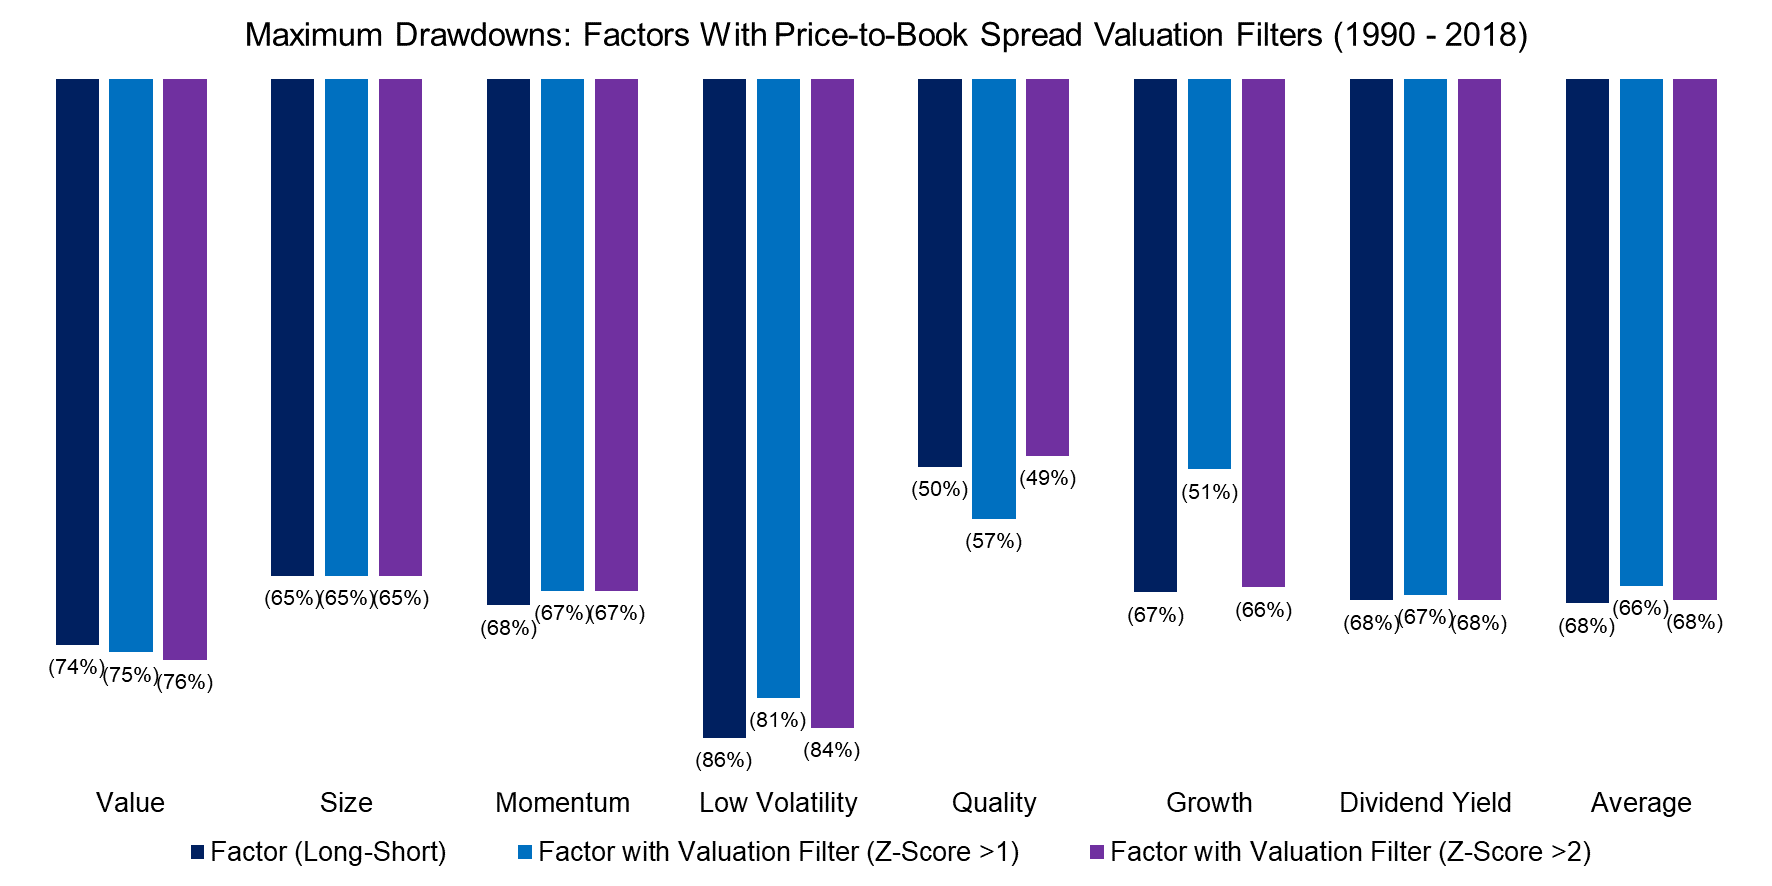
The chart below highlights the maximum drawdowns of common equity factors from 1990 to 2018 and clearly shows that beta-neutral long-short factors require a sound risk management framework given the magnitude of drawdowns. Measuring factor crowding should be a component of such a framework, which has the general objective of improving risk-return ratios and reducing drawdowns. However, as the analysis shows the approach to use fundamental valuation filters did not achieve that objective.
Source: FactorResearch
FURTHER THOUGHTS
This short research note highlights that applying a fundamental valuation filter to avoid factor crowding does not improve the risk metrics of common equity factors in the US. There are several thoughts and follow-on research areas:
- Factors do require inflows as otherwise there is no positive performance, so crowding per se is not negative.
- Factor drawdowns are not necessarily associated with crowding and can occur when the factor is uncrowded.
- Identifying periods where the factor is uncrowded and attractive is challenging, e.g. as highlighted by the Value factor in 2000, which reached levels of cheapness not seen in the prior decade.
- We applied a tactical approach and a more long-term, strategic approach for identifying crowded or uncrowded factors might be more successful. However, analysing factor valuations from a strategic perspective is as difficult as analysing stock markets from a valuation perspective, e.g. they might be expensive for years and not revert to long-term valuation means.
- A multi-metric approach to measure factor crowding is likely more successful than using a single metric like fundamental valuations.
ABOUT THE AUTHOR
Nicolas Rabener is the CEO & Founder of Finominal, which empowers professional investors with data, technology, and research insights to improve their investment outcomes. Previously he created Jackdaw Capital, an award-winning quantitative hedge fund. Before that Nicolas worked at GIC and Citigroup in London and New York. Nicolas holds a Master of Finance from HHL Leipzig Graduate School of Management, is a CAIA charter holder, and enjoys endurance sports (Ironman & 100km Ultramarathon).
Connect with me on LinkedIn or X.

