Value, Momentum & Carry Across Asset Classes
Farming is a Profession of Hope (Brian Brett). Investing, too.
January 2019. Reading Time: 10 Minutes. Author: Nicolas Rabener.
SUMMARY
- Cross-asset multi-factor exposure might be an attractive diversifier for an equity portfolio
- Factors share trends across asset classes, indicating common drivers
- However, relationships are time-varying, increasing complexity and risks
INTRODUCTION
There is a 72% probability of the San Franciso Bay Area getting hit by at least one earthquake of a magnitude of 6.7 or stronger between today and 2043 according to the United States Geological Survey, which is a scientific agency of the U.S. government. An earthquake of that magnitude is likely to cause major damage in populated areas, especially if accompanied by a tsunami.
Given high valuations, record levels of debt, and poor demographics investors are likely to get hit by financial earthquakes with almost a 100% probability before 2043. The two core approaches for minimizing financial damage are hedging strategies and portfolio diversification, or a combination of both.
Long-short factor investing strategies are typically structured beta-neutral, which would provide diversification for a classic equity-bond portfolio. Academic research supports that factor returns can be harvested from equities as well as from other asset classes, where they are usually called risk or style premia. Institutional investors have bought more than $500 billion in risk premia products from investment banks, highlighting the interest in uncorrelated strategies that may preserve capital.
In this short research note we will investigate Value, Momentum and Carry factors across asset classes as well as the benefit of adding an allocation of these to a classic equity-bond portfolio.
METHODOLOGY
Equity factor performance is derived from beta-neutral long-short portfolios comprising the top and bottom 10% of stocks. Portfolios are created on a country level and then aggregated to a global portfolio by weighting allocations by market capitalization. Only stocks with market capitalizations larger than $1 billion are included. Portfolios are rebalanced monthly and each transaction incurs costs of 10 basis points.
Currency, commodity and fixed income factor data is sourced from HFRX, which aggregates more than 1,000 long-short factor indices from investment banks. The indices are weighted by inverse-volatility and are net of costs. Only live indices are included and data is available for most factors since 2009.
It is worth noting that factor definitions differ widely across investment banks and the number of indices available for each factor varies significantly. If the number and variety of factors in equities have been compared to a factor zoo, then factors across asset classes represent a factor jungle. Although the jungle is a pleasant topic for a documentary, traversing a jungle is often a deadly business.
VALUE FACTOR ACROSS ASSET CLASSES
Value is defined as buying cheap and selling expensive assets. In equities, we use a combination of price-to-book and price-to-earnings multiples for ranking stocks, although other metrics like EV/EBITDA can also be considered. Similarly, defining Value in other asset classes is open to a wide range of possibilities and different for each product provider (read Value Factor – Comparing Valuation Metrics).
Most equity investors will be painfully aware of how poorly the Value factor has performed in the last decade. However, the factor has also generated negative to flat returns in currencies and fixed income. Only Value in commodities generated positive returns since 2009.
More interestingly, there seem to be some shared trends in factor performance, e.g. Value in equities and currencies exhibited similar downward trends between 2009 and 2012, which perhaps can be explained by common performance drivers. The cross-asset class portfolio allocates equally to all four assets classes and accordingly shows a flat performance over the last decade.
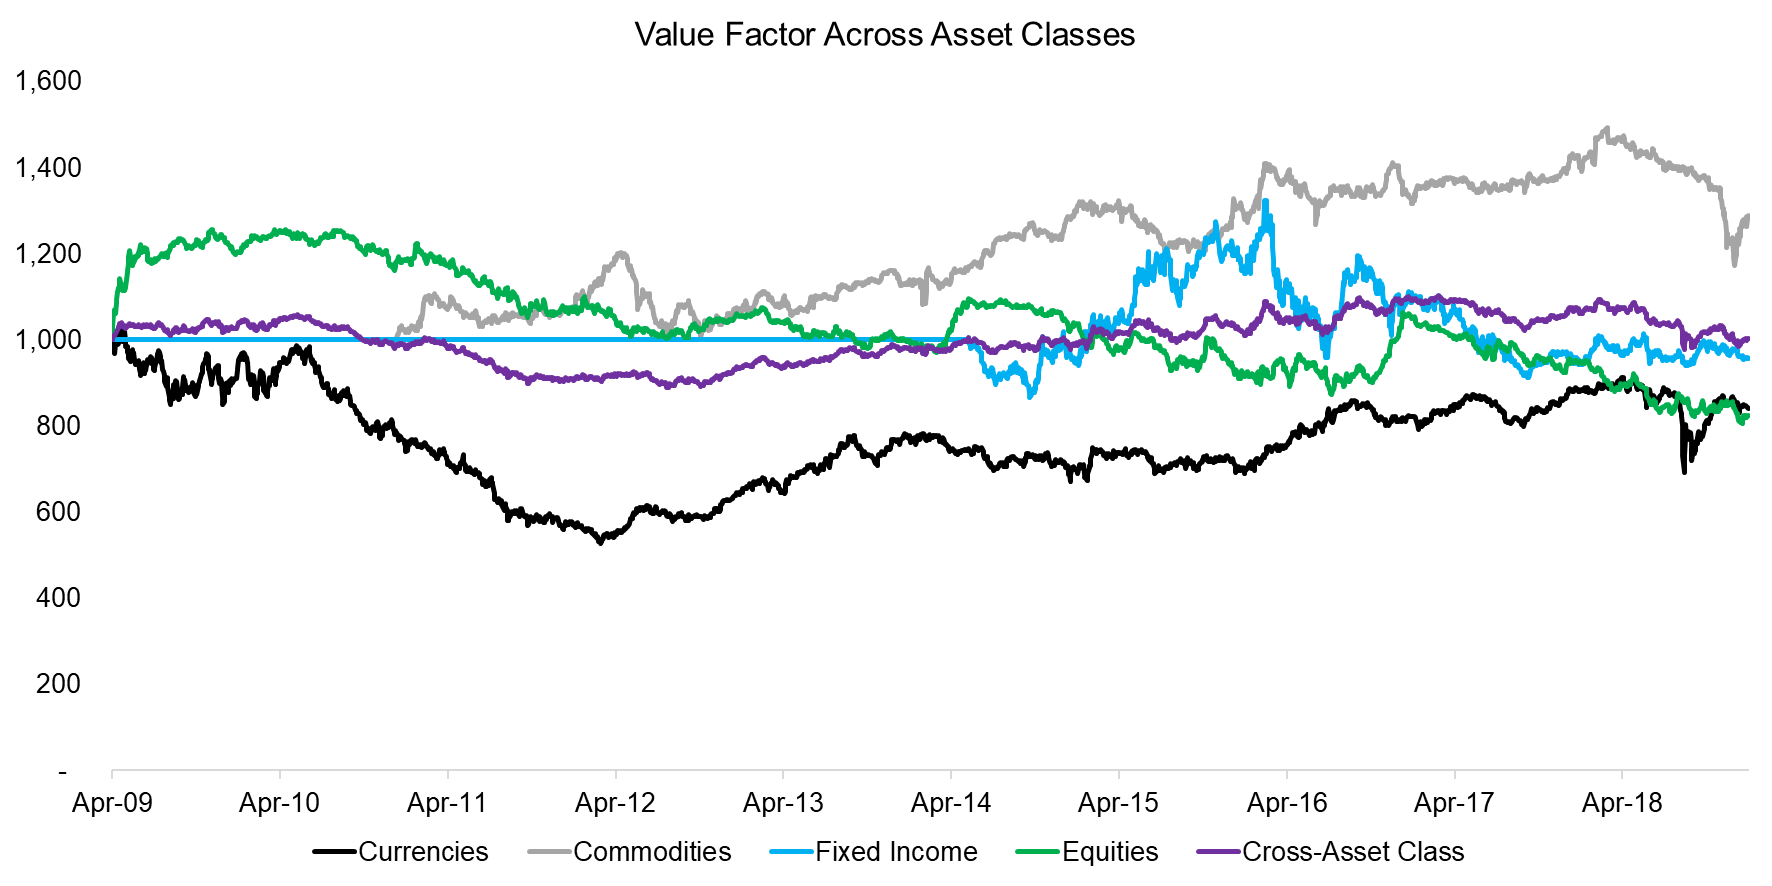
Source: FactorResearch, HFRX (Fixed Income data is only available from 2014 onward)
MOMENTUM ACROSS ASSET CLASSES
Momentum is defined as buying winners and shorting losers, which is typically measured by the 12-month performance and therefore results in more homogenous factor definitions than for Value (read Momentum Factor: Intra vs Cross-Sector). We observe that the Momentum factor in fixed income generated exceptional performance since 2009, which can perhaps be explained by the central bank policies that resulted in massive bond-buying programmes. Momentum was negative in currencies and commodities while positive in equities since 2009. Reading charts is subjective and therefore dangerous, but there seem to be some shared trends in the Momentum factor across asset classes between 2014 and 2017.
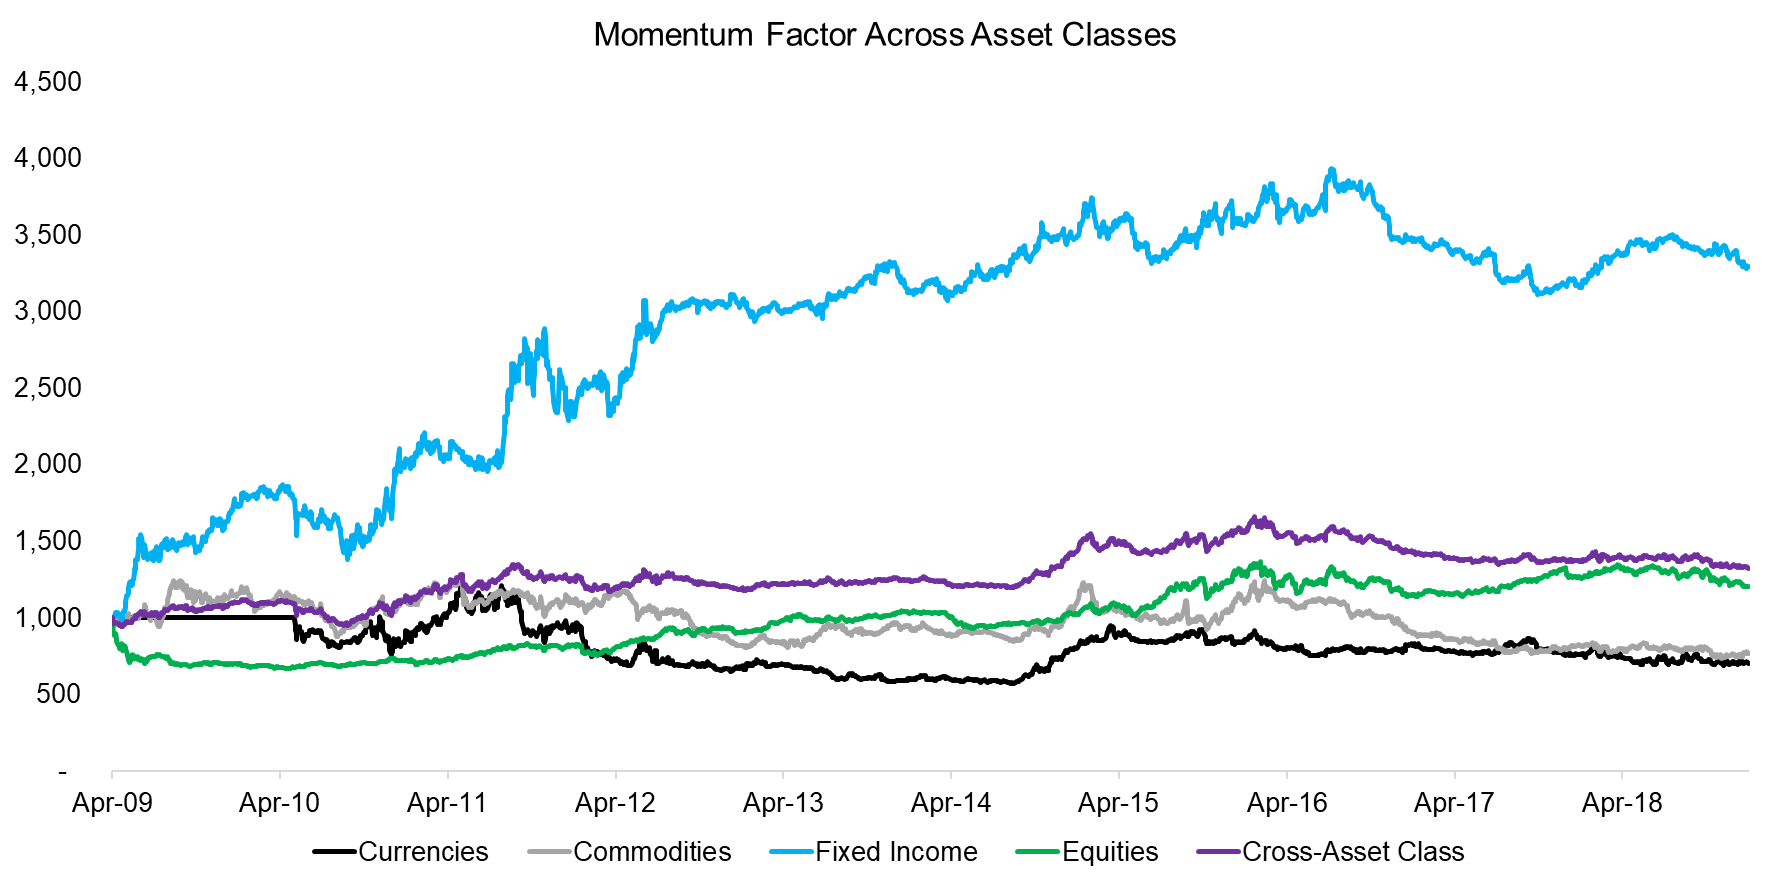
Source: FactorResearch, HFRX
CARRY FACTOR ACROSS ASSET CLASSES
The Carry factor is related to the Value factor as it is defined as buying high-yielding, which are often cheap, and selling low-yielding assets, which are typically expensive. The most common factor definitions are dividend yield in equities, short-term cash rates in currencies, the slope of the futures curve in commodities, and bond yields in fixed income.
We observe a diverse range of performances across asset classes, although some common trends appear. The direction of Carry in currencies is declining while flat in equities, but they seem to be correlated. Even Carry in commodities post 2012 bears a resemblance to Carry in currencies and equities. The only truly uncorrelated Carry factor appears to be in fixed income.
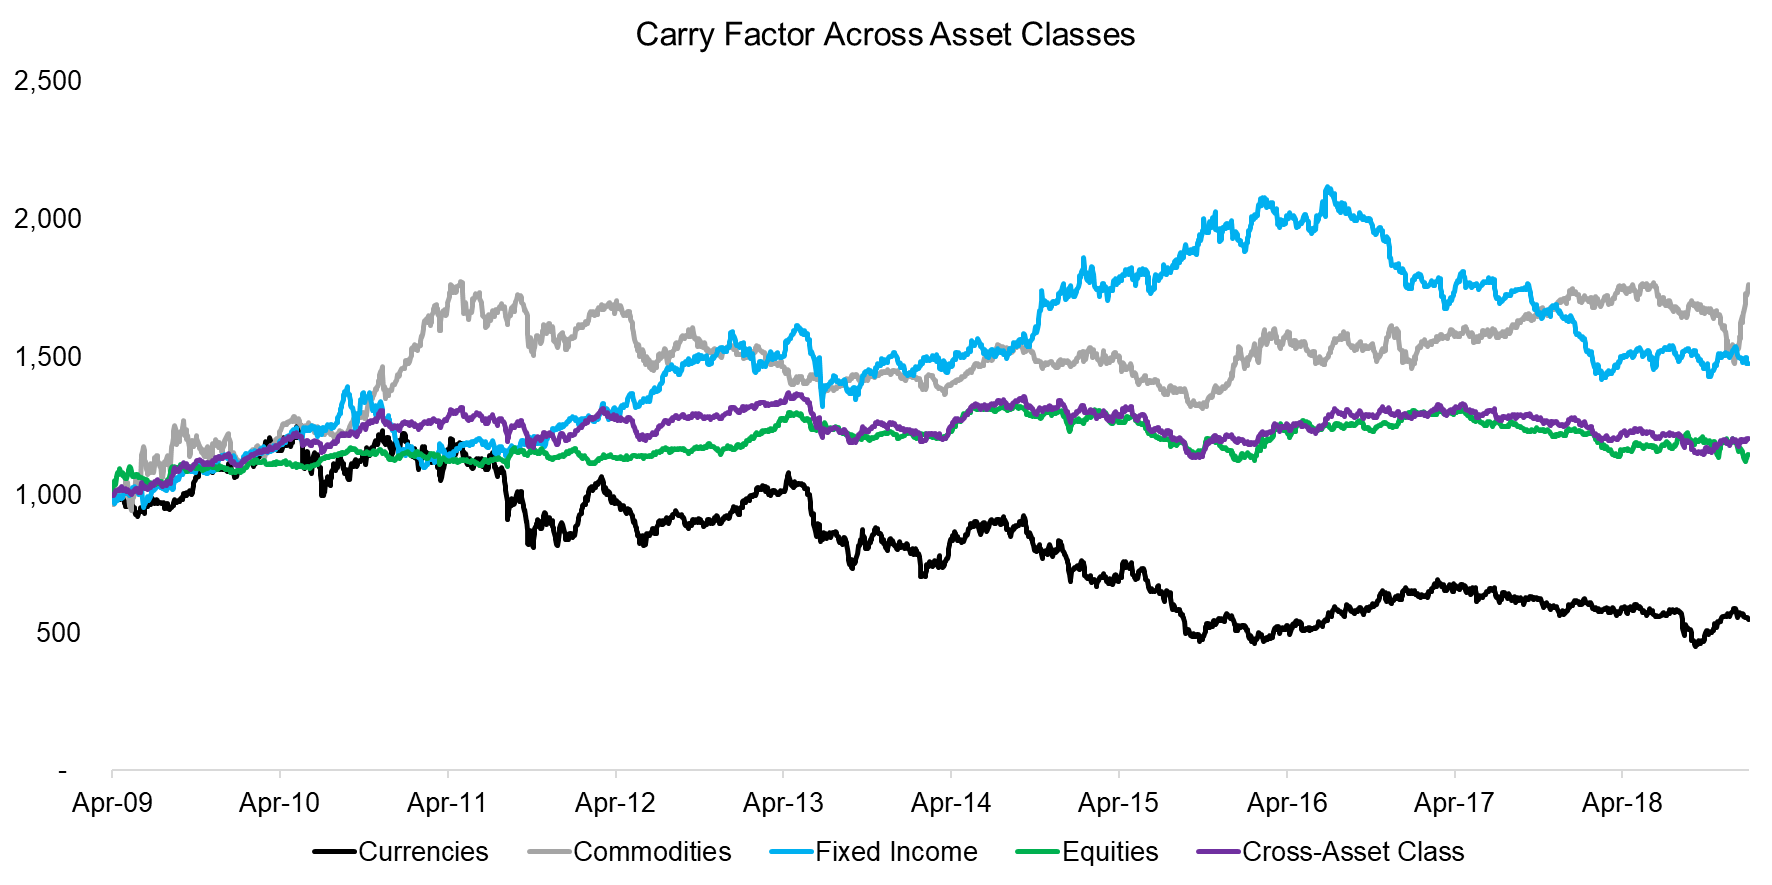
Source: FactorResearch, HFRX
Analyzing the correlations highlights that the currency and commodity Carry factors exhibited long periods of high correlations to the equity Carry factor. Given that the correlations are time-varifying, average correlations would likely be misleading. The high correlations represent risk for investors as they are primarily seeking uncorrelated returns. Investors might question if these factors essentially represent the same risk.
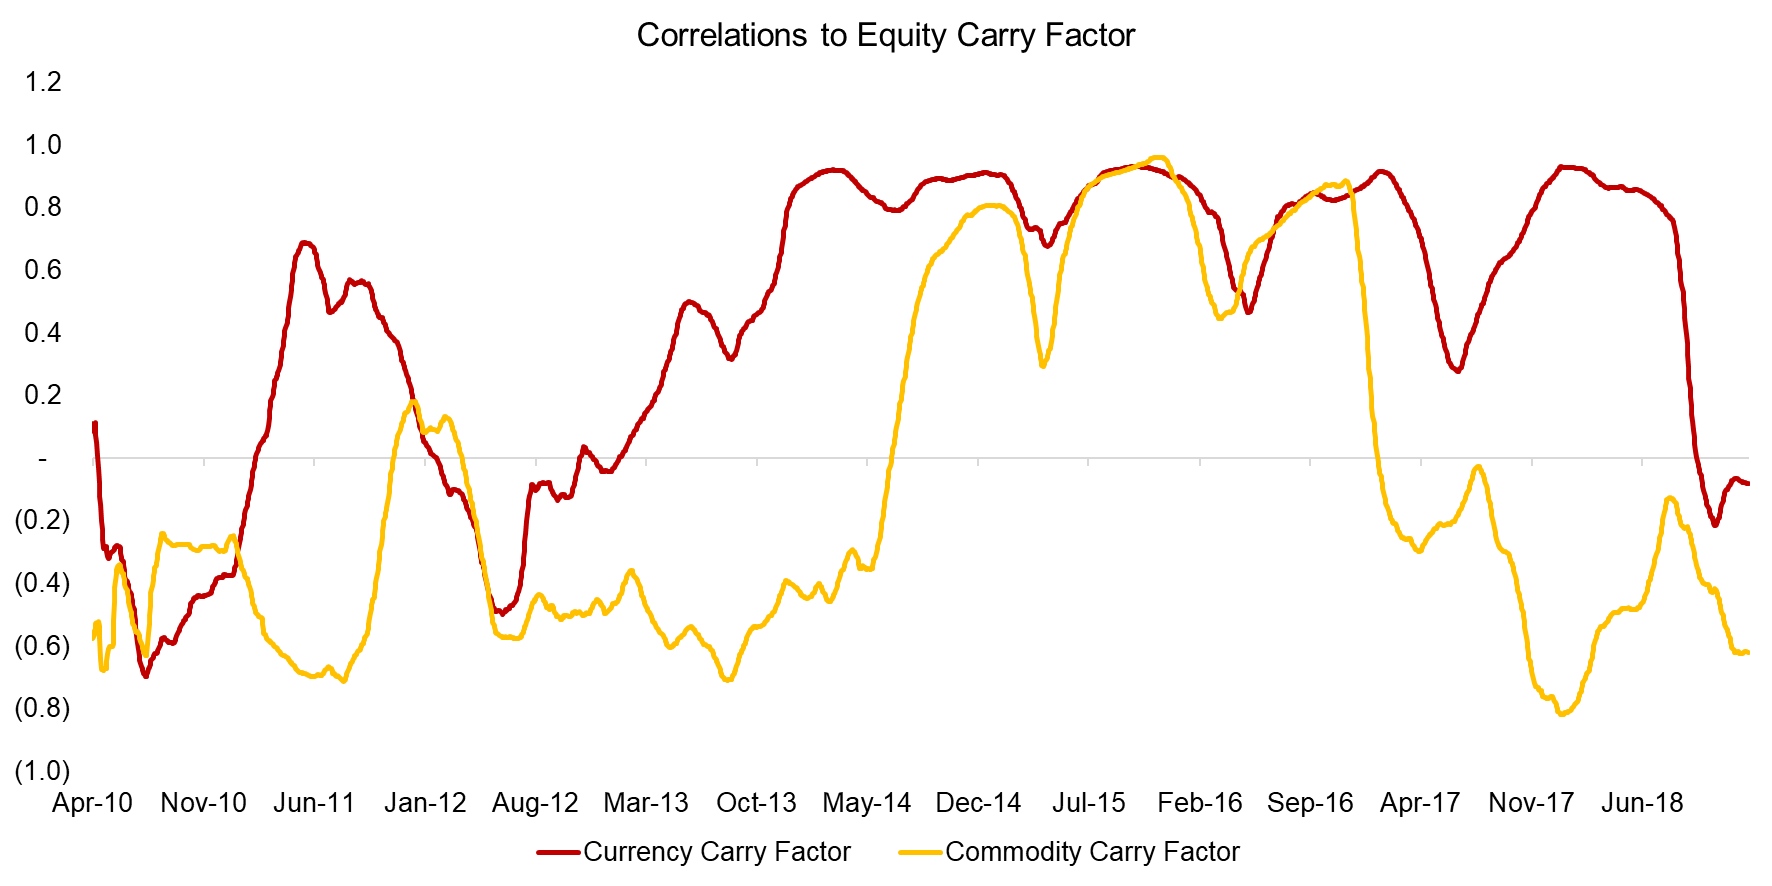
Source: FactorResearch
CROSS-ASSET CLASS VALUE, MOMENTUM & CARRY FACTORS
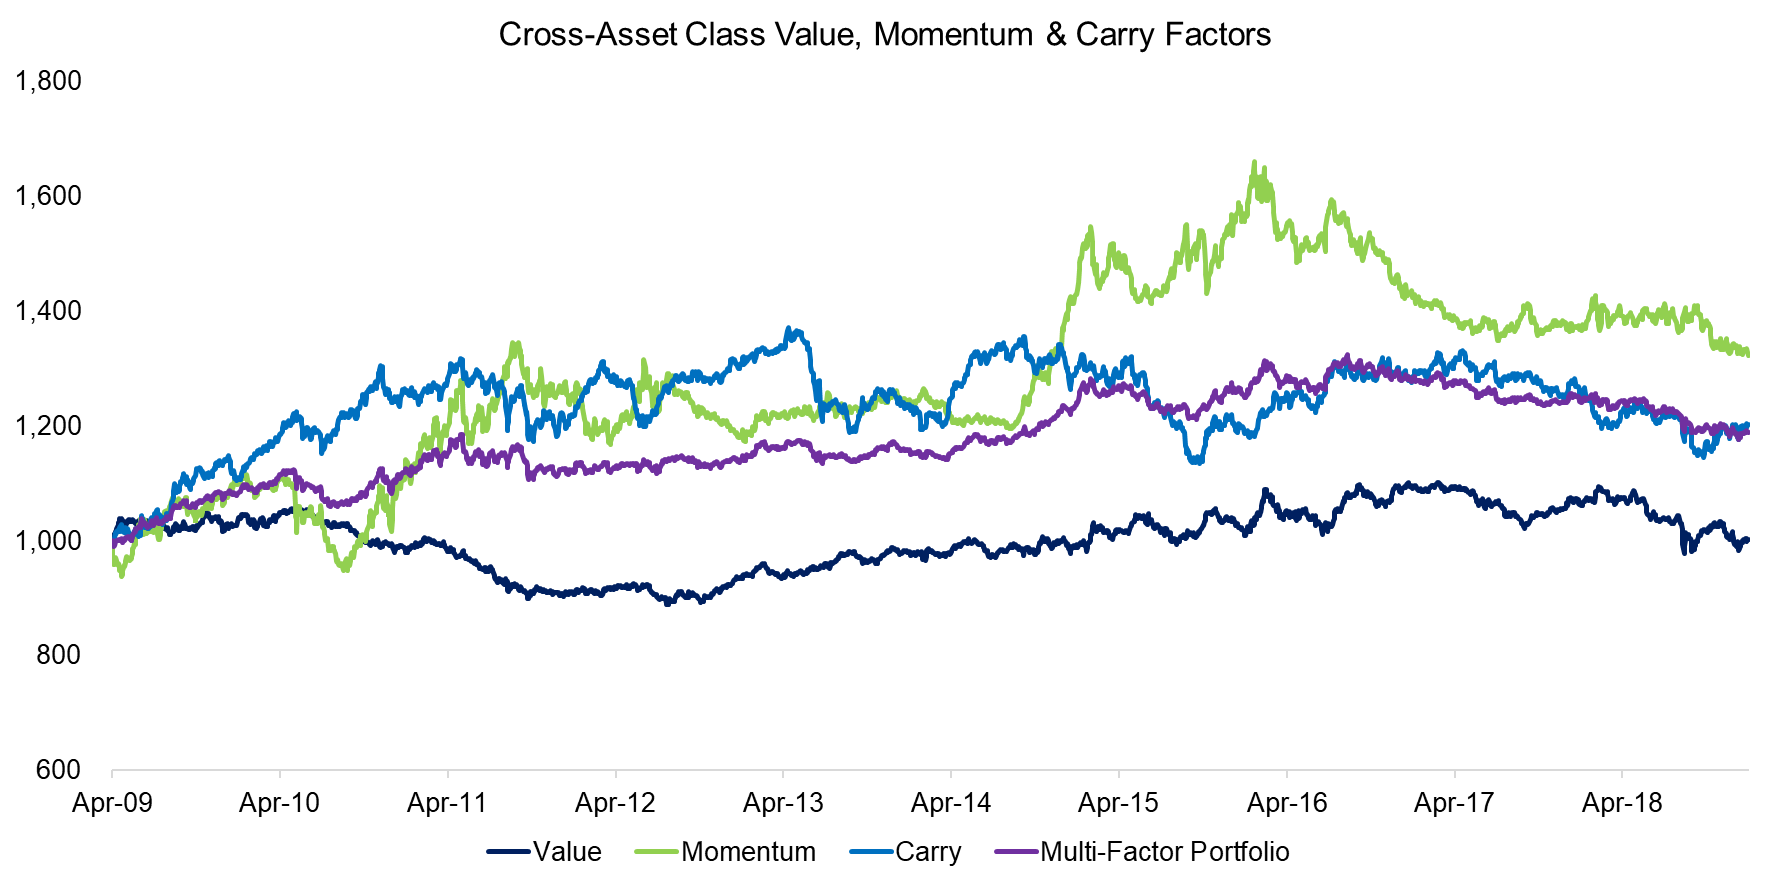
Next, we compare the three cross-asset class factors and combine them into one multi-factor portfolio. Given different volatility profiles investors might want to consider a risk parity model for allocations in practice, but for simplicity, we allocate equally to the three factors. We observe that the multi-factor portfolio generated consistently positive returns with low volatility from 2009 to 2016 and then slightly declining returns thereafter.
Source: FactorResearch
MULTI-FACTOR PORTFOLIOS AS DIVERSIFIERS
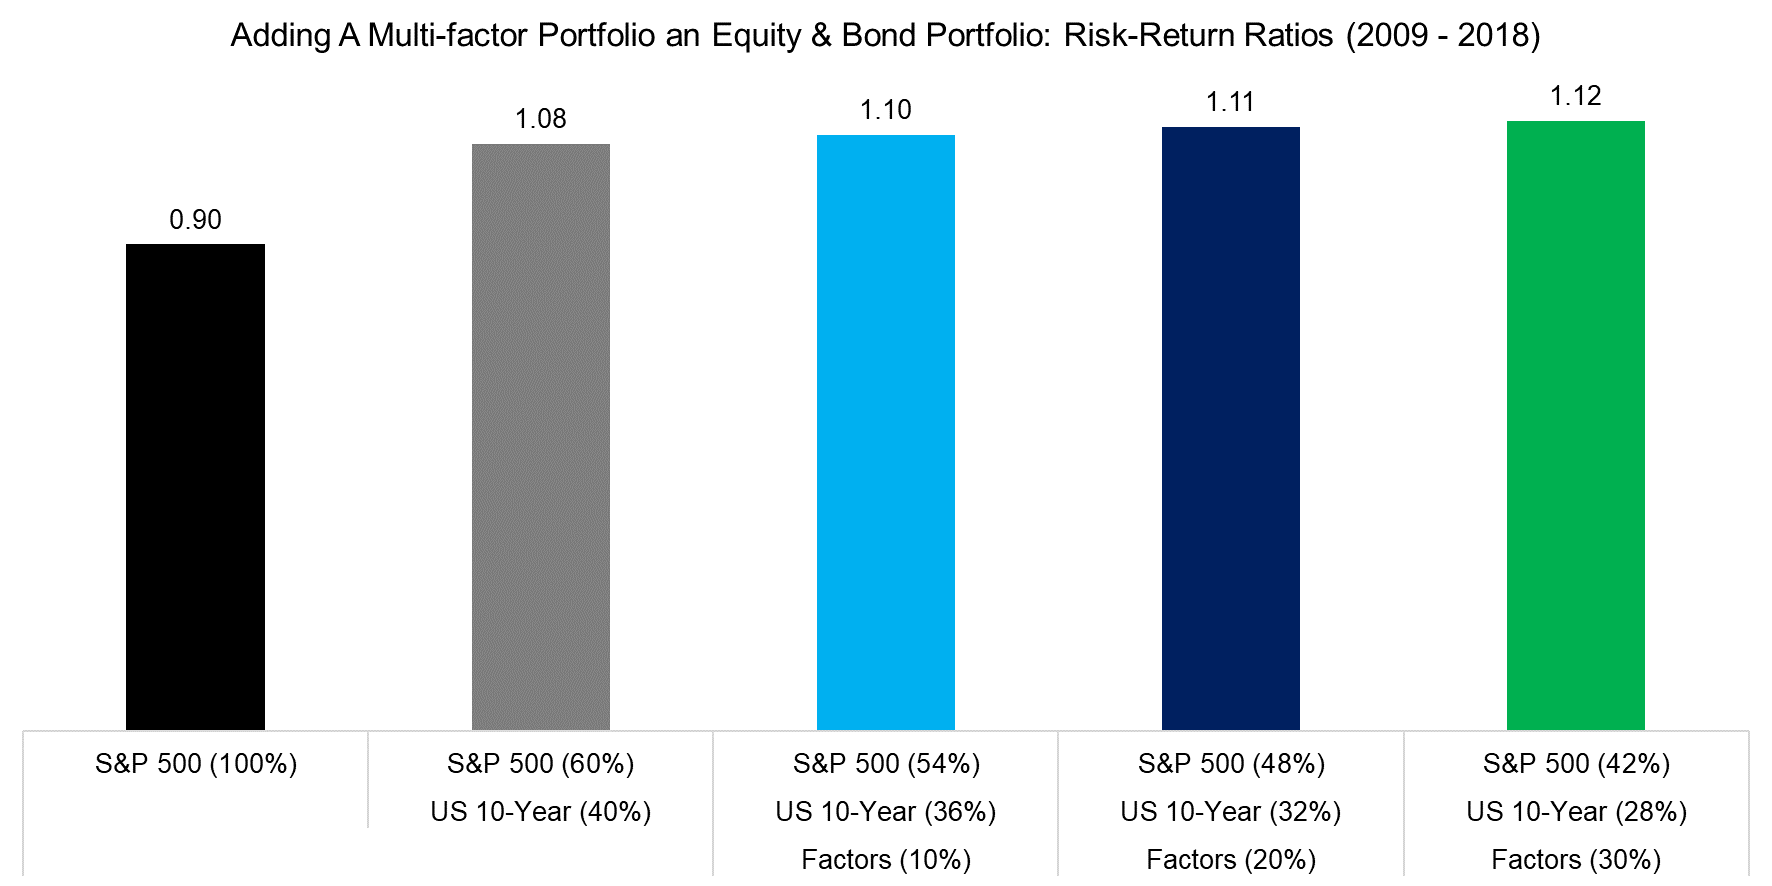
Given the relatively consistent performance of the cross-asset class multi-factor portfolio, it might be attractive for diversifying a classic equity-bond portfolio. The S&P 500 generated a risk-return ratio of 1.08 since 2009, which is abnormally high compared to a long-term average of 0.35 and can be explained by the starting point of the analysis in 2009, which was the bottom of the global financial crisis. The starting point was chosen because of the availability of factor data in currencies, commodities and fixed income.
Adding a 40% allocation to the US 10-year government bond to an equity portfolio would have increased the risk-return ratio significantly. Interestingly, adding exposure to the long-short multi-factor portfolio would not have resulted in significantly higher risk-adjusted returns. The volatility of the combined portfolio continues to decrease the higher the allocation to the multi-factor portfolio, but returns decrease linearly. US stock and bond markets boomed over the last decade, which has been difficult to compete with. We suspect that the multi-factor portfolio would have provided higher diversification benefits during the global financial crisis pre 2009.
Source: FactorResearch
FURTHER THOUGHTS
This short research note highlights the performance of the Value, Momentum, and Carry factors across asset classes. Investors might assume that the same factors are uncorrelated across asset classes and therefore provide attractive diversification benefits, but this does not seem to be entirely the case. Carry in equities, currencies, and commodities exhibited multi-year periods of high correlations, which would indicate common factor drivers. Identifying these drivers is challenging, but will empower investors to make better allocation decisions.
ABOUT THE AUTHOR
Nicolas Rabener is the CEO & Founder of Finominal, which empowers professional investors with data, technology, and research insights to improve their investment outcomes. Previously he created Jackdaw Capital, an award-winning quantitative hedge fund. Before that Nicolas worked at GIC and Citigroup in London and New York. Nicolas holds a Master of Finance from HHL Leipzig Graduate School of Management, is a CAIA charter holder, and enjoys endurance sports (Ironman & 100km Ultramarathon).
Connect with me on LinkedIn or X.

