Factor Optimization
Pure versus Dirty Factors
December 2018. Reading Time: 15 Minutes. Author: Nicolas Rabener.
SUMMARY
- Equity factors exhibit sector biases and exposures to other common factors
- A factor optimisation process allows investors to create pure factors
- Risk-adjusted returns do not increase, but pure factors are attractive from analytical, risk and allocation perspectives
INTRODUCTION
When large quantities of organisms like zooplankton and algae are buried underneath sedimentary rock and subjected to intense heat and pressure, petroleum is created. It is a substance that is usually brown or black and contains a mixture of gas, liquids and solid hydrocarbons.
The Chinese were the first to start refining petroleum into fuel about 2,000 years ago. Being able to refine petroleum into oil and gasoline has been instrumental in accelerating the growth of human civilization as these have become primary energy sources.
In factor investing, single factor portfolios can be considered the equivalent of petroleum as they are essentially unrefined. Creating a Value factor portfolio consists of ranking stocks on single or multiple valuation metrics like price-to-book or price-to-earnings multiples. However, the resulting portfolio will by nature feature biases to certain sectors and exposure to other common equity factors.
In this white paper, we will introduce a factor optimization process that maximises the exposure to a target factor and minimises the exposure to non-target factors. We will initially focus on the Value factor in the US, then expand to other common equity factors in the US, and finally conclude with multi-factor portfolios across markets (read Stock Portfolio Optimization).
METHODOLOGY
We focus on five factors namely Value, Size, Momentum, Low Volatility, and Quality in the US, European, and Japanese stock markets. The factor definitions are in line with industry standards and the factor performance is calculated by constructing beta-neutral long-short portfolios by taking the top and bottom 10% of the stock universe ranked by the factor. Only stocks with market capitalisations of larger than $1 billion are considered. Portfolios are rebalanced monthly and 10 basis points of costs per transaction are included. The analysis covers the period from 2001 to 2018.
MODEL OBJECTIVE
The objective of the optimisation process is to maximise the exposure to a single target factor and minimise the exposure to defined non-target factors. The optimisation process impacts the stock selection process and leads to different portfolio composition, which may have positive or negative consequences on factor performance.
RAW VERSUS PURE VALUE FACTOR IN THE US
The long-short Value factor is defined as buying cheap and shorting expensive stocks. Specifically, we use a combination of price-to-book and price-to-earnings multiples for the stock selection process (read Value Factor – Comparing Valuation Metrics) .
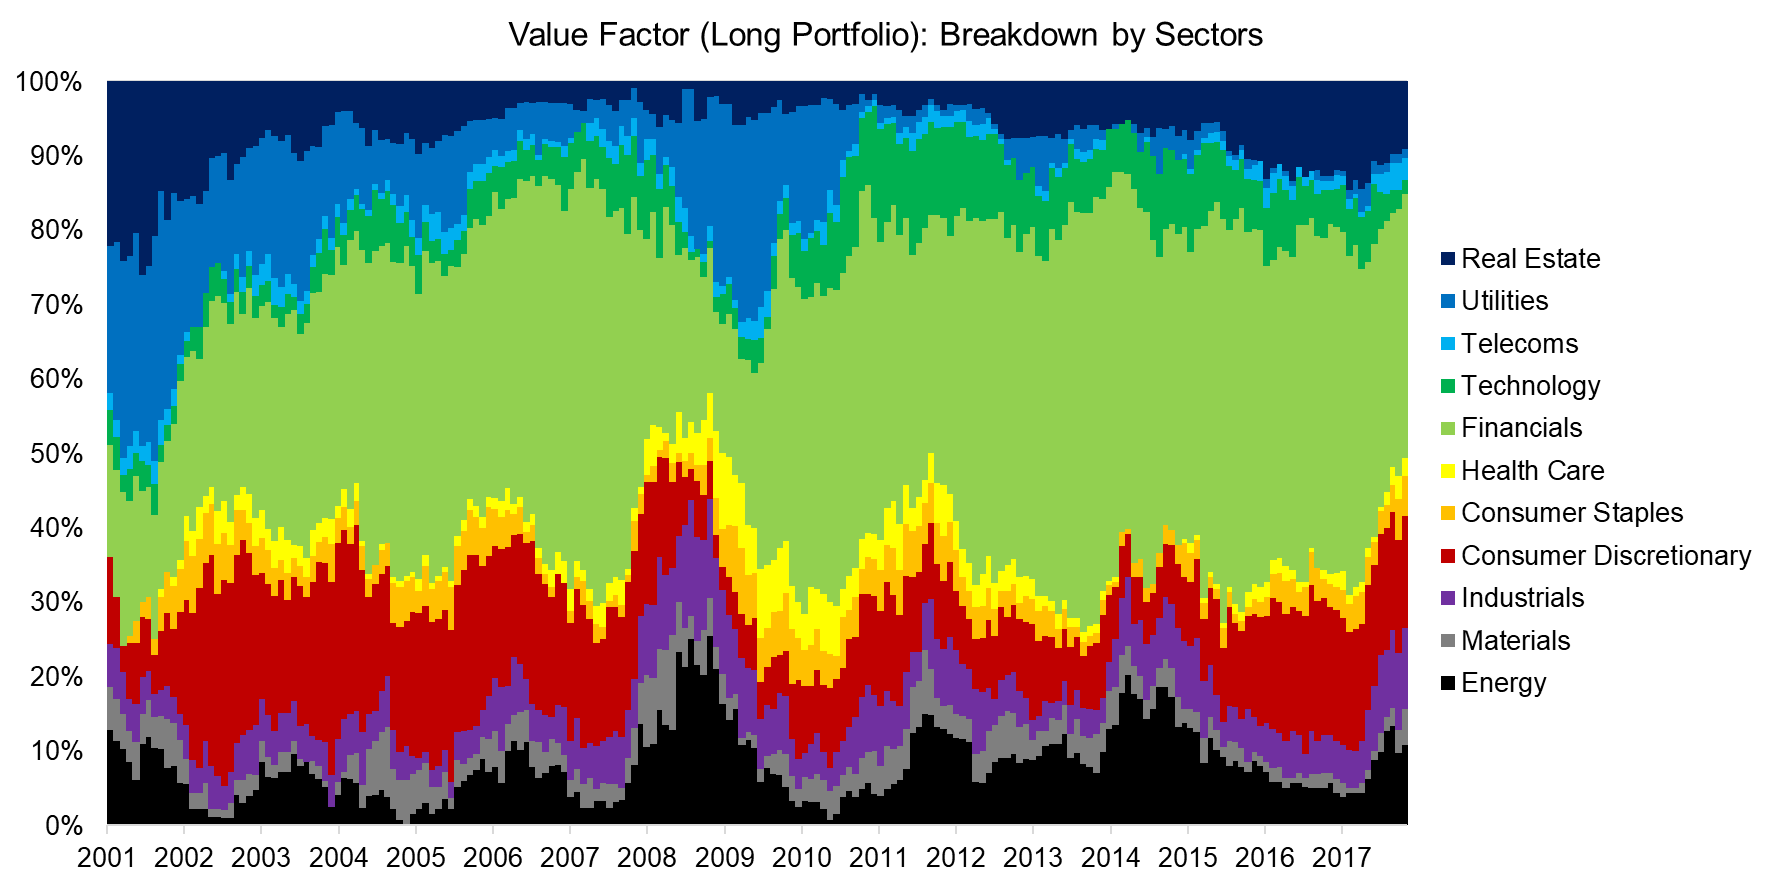
The analysis below highlights that the resulting long portfolio of the Value factor in the US had strong sector biases over time. We observe that most cheap stocks were contributed by the financial sector, which implies that the returns of the Value factor were strongly influenced by the performance of the financial sector.
Source: FactorResearch
Factor investing aims at systematically harvesting factor returns that exist due to behavioural biases or other reasons. Betting on certain sectors can be considered risky as it is a different game. Fortunately, long-short factor portfolios can be constructed sector-neutral, which eliminates any sector biases and allows investors to harvest factor returns independent of sector trends.
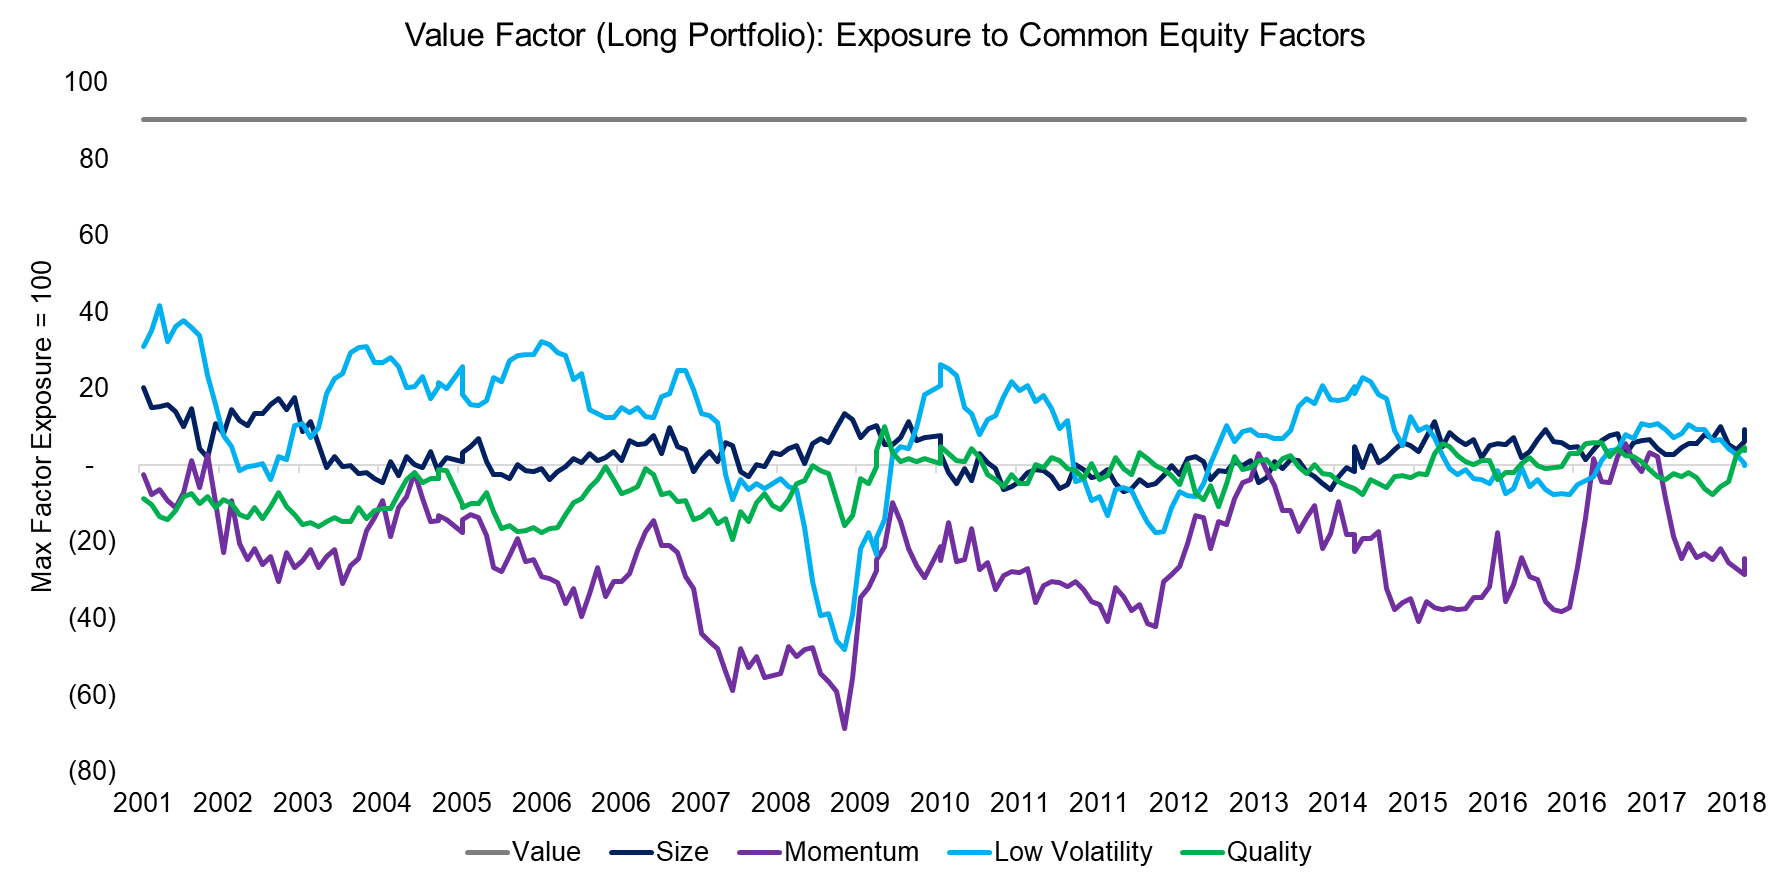
However, a Value portfolio also exhibits exposure to other common equity factors, even if structured sector-neutral. For example, cheap stocks typically have small market capitalisations, rank low on quality metrics, and feature declining stock prices as these companies are characterised by temporary or structural issues.
A factor exposure analysis reveals that the long portfolio of the Value factor had slightly positive exposure to the Size and Low Volatility factors while negative exposure to the Momentum and Quality factors. The analysis below highlights that a Value investor has indirectly been shorting the Momentum factor, which may be considered unintended and undesirable.
Source: FactorResearch
We can utilize an optimisation process during the stock selection process that maximises the exposure to the Value factor while minimising the exposure to other common equity factors. As a result, the optimised portfolio will feature slightly different stocks and weights compared to the original portfolio. The algorithm underlying the optimisation process will consider the factor scores of each stock at the rebalancing date and then provide the optimal weights to achieve the defined objectives.
Although we are only considering common equity factors, the optimisation process can be applied to any financial variable, e.g. foreign exchange or interest rates. Investors can use such a process to create highly tailored portfolios that provide specific exposures.
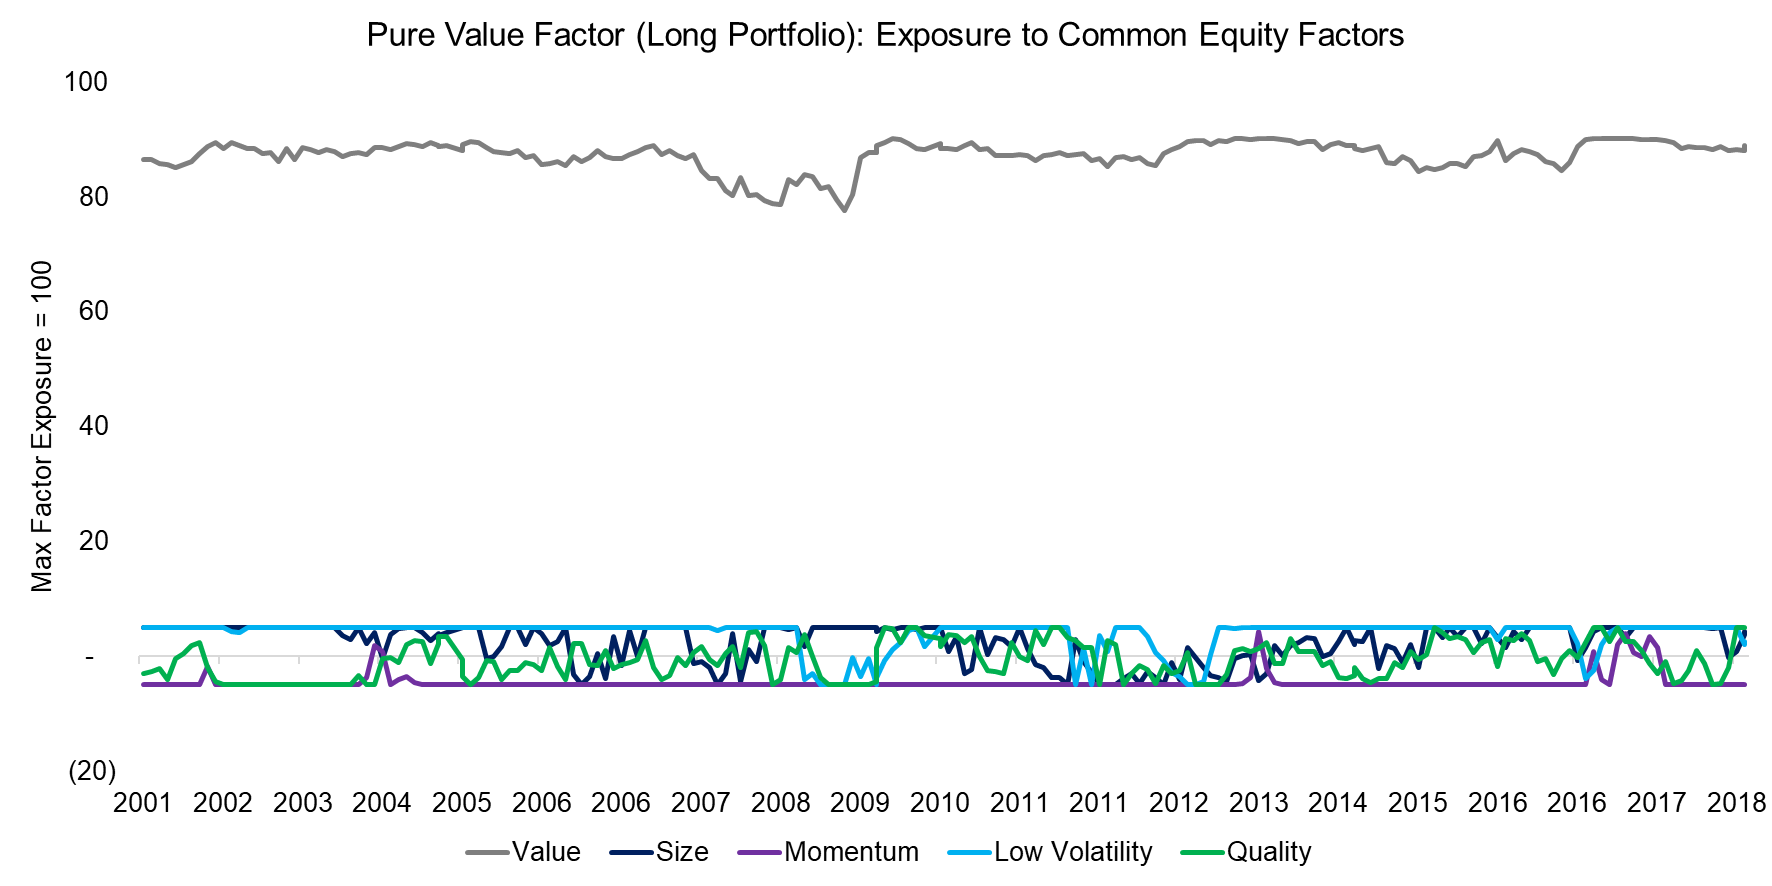
A factor exposure analysis of the long portfolio of the Value factor post the optimisation process, which therefore is labelled Pure Value factor, shows high exposure to the Value factor and minimal exposure to other factors.
Source: FactorResearch
The optimisation process therefore allows investors to harvest the returns of the Value factor with limited risk to other factors. However, the stock portfolios of the raw and pure factor are different, which will impact factor performance.
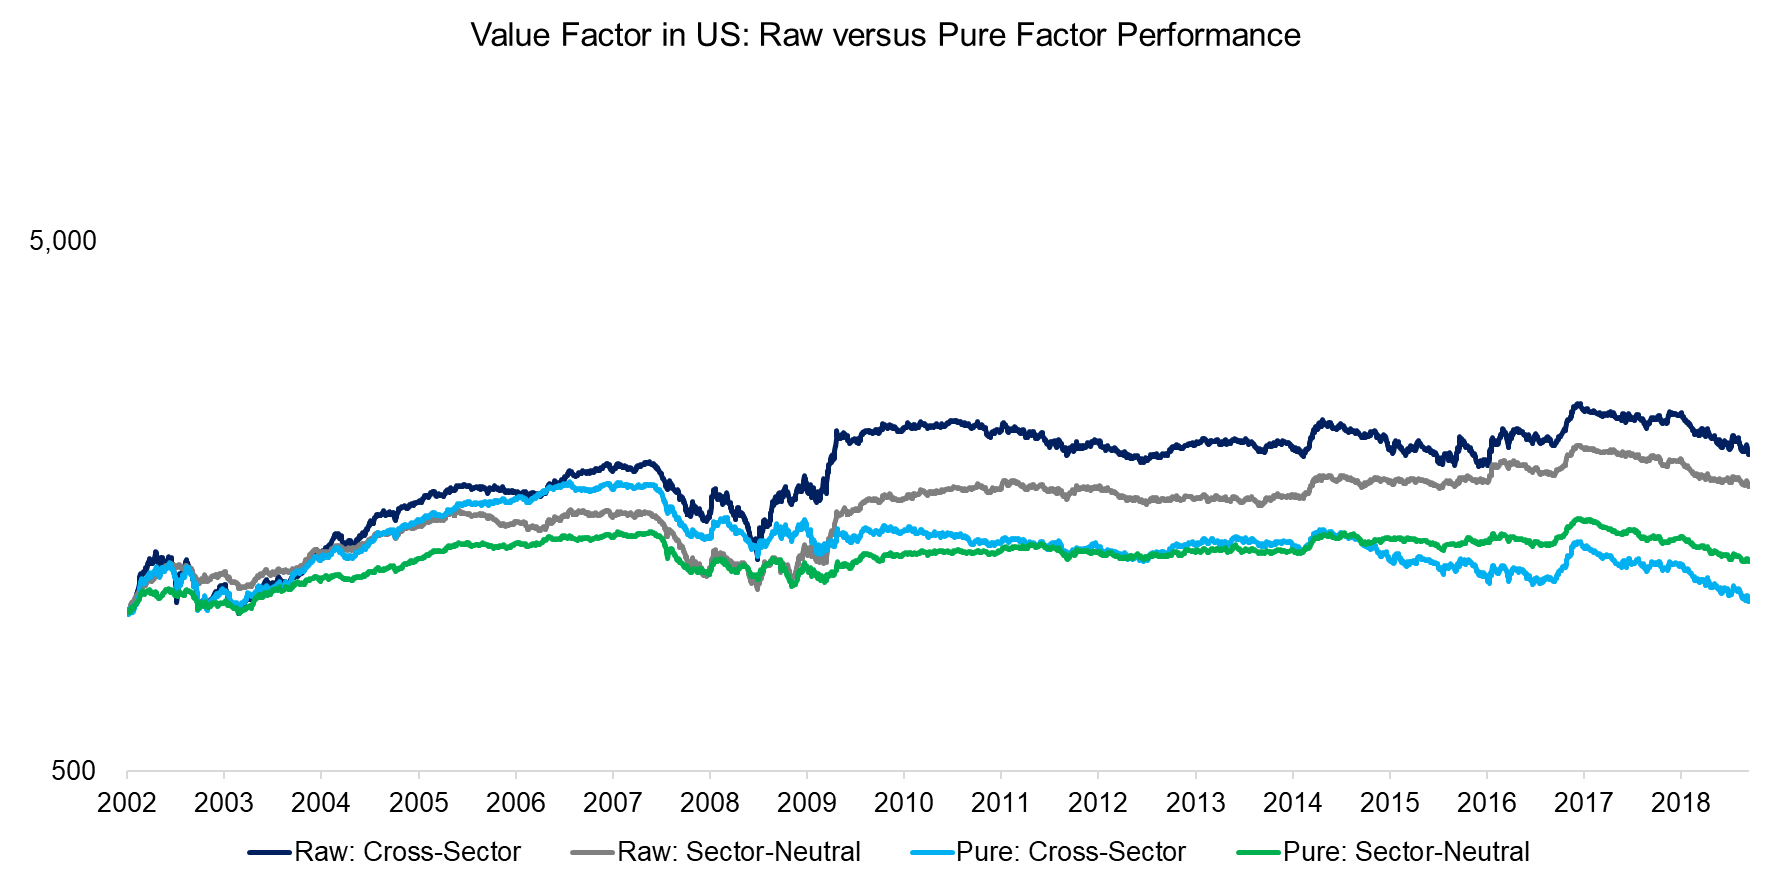
The analysis below shows the performance of the cross-sector and sector-neutral Raw and Pure Value factors. The cross-sector Raw Value factor, which is the most unconstrained portfolio, generated the highest returns. The sector-neutral Pure Value factor, which is the most constrained version of the Value factor, was similar in trend but was effectively flat since 2002.
Source: FactorResearch
It is worth noting that the objective of the optimisation process is to remove undesired risk, not to increase returns. The results therefore simply highlight the contribution of other factors to the performance of the Value factor.
RAW VERSUS PURE FACTORS IN THE US
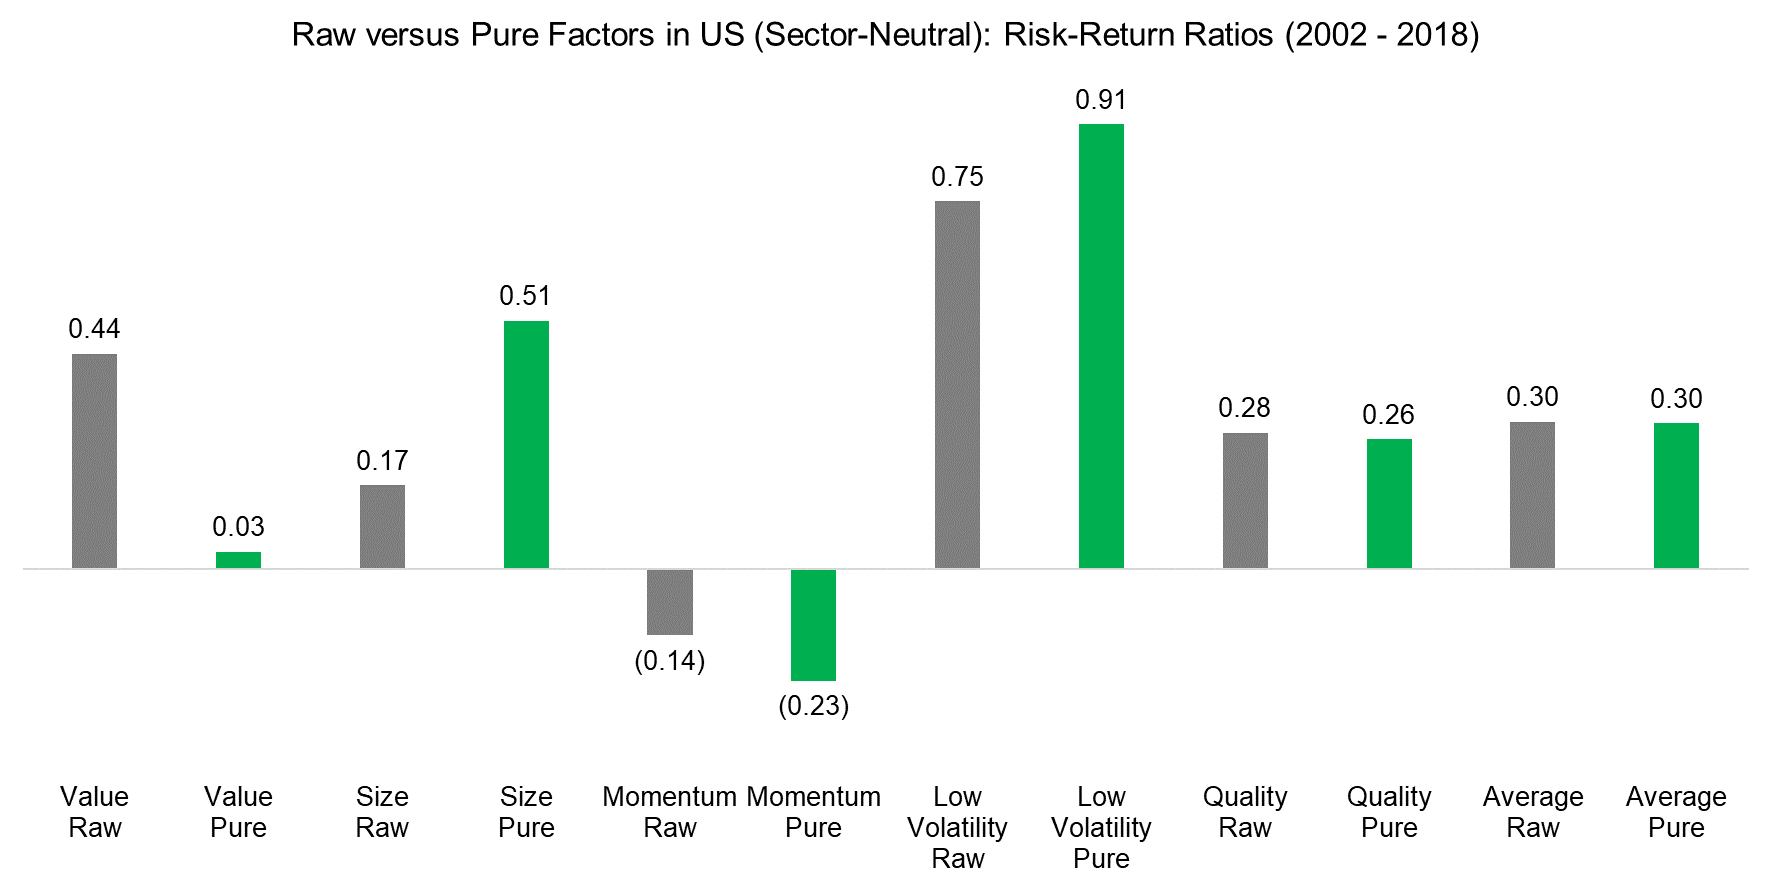
Next, we expand the analysis to other common equity factors in the US stock market and focus on risk-adjusted returns. Raw and pure factors are both constructed sector-neutral to show the impact of the optimisation process. Each of the pure factors has been optimised to maximise the exposure to the target factor and minimise the exposure to non-target factors.
We observe in the analysis below that the risk-return ratios improved for some factors and deteriorated for others. Investors might have expected that the optimisation process reduces risk by eliminating exposures to other factors and therefore leads to higher risk-return ratios, but factor purification is more alike to crystallising than to reducing risk.
Source: FactorResearch
RAW VERSUS PURE FACTORS ACROSS MARKETS
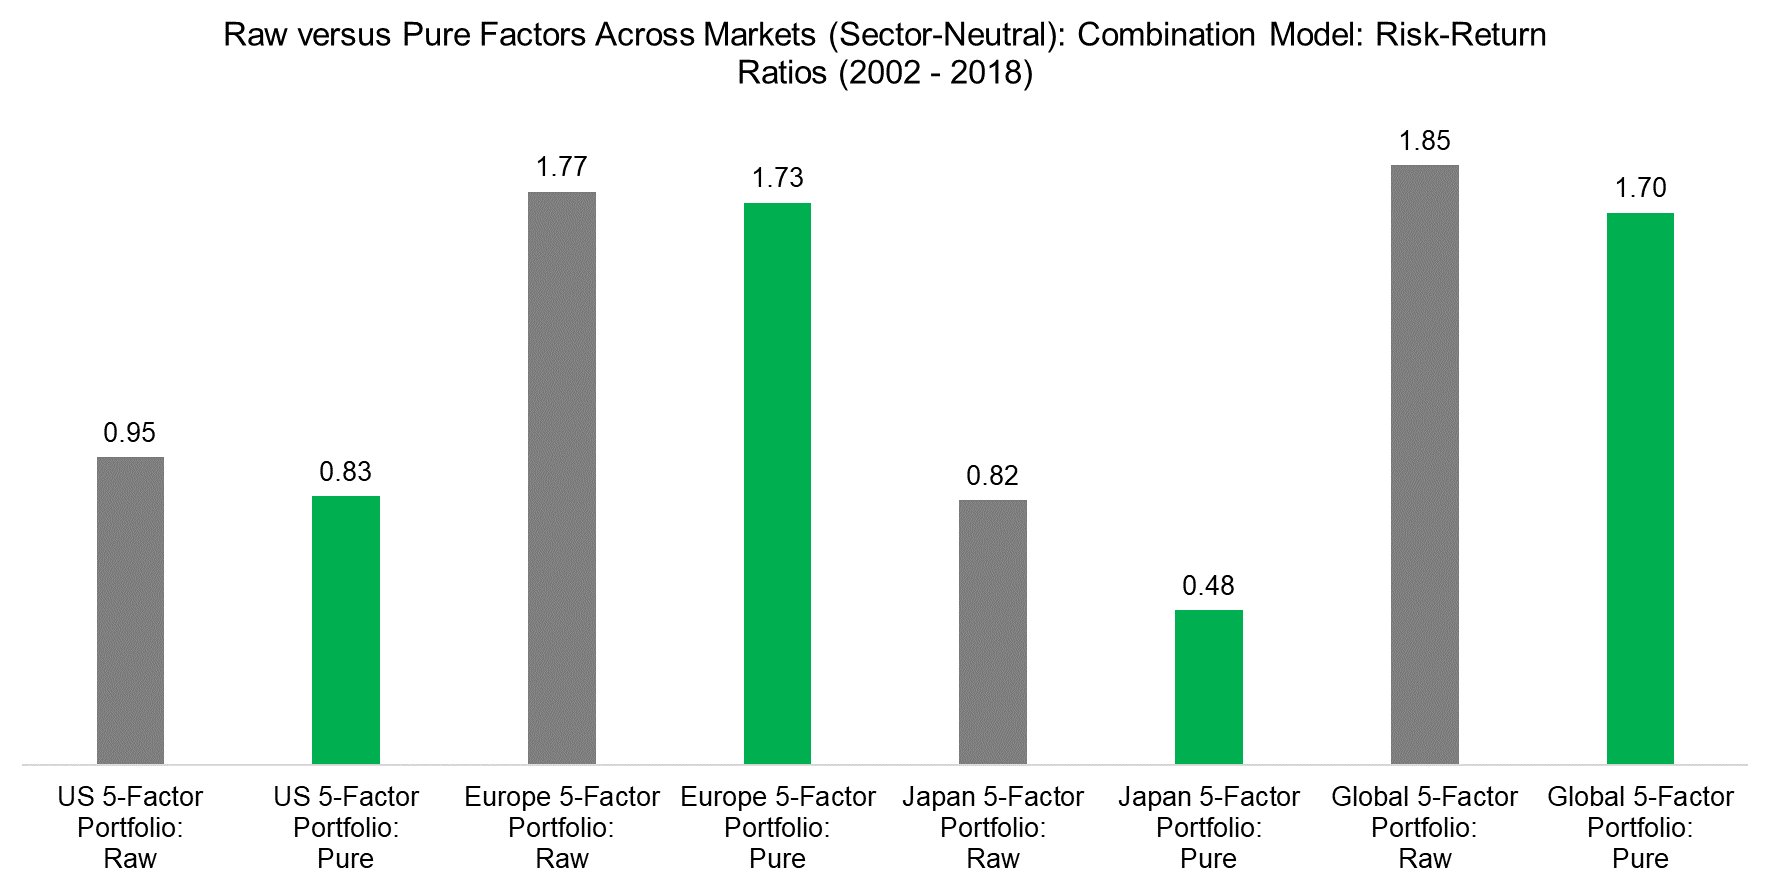
Finally, we optimise factors in US, European, and Japanese stock markets and create multi-factor portfolios, which allocate equally to five factors that are all created sector-neutral. These are the Value, Size, Momentum, Low Volatility, and Quality factors. Specifically, we use two methodologies to create multi-factor portfolios:
- Combination model: This approach calculates single-factor performance and then combines these in one multi-factor portfolio
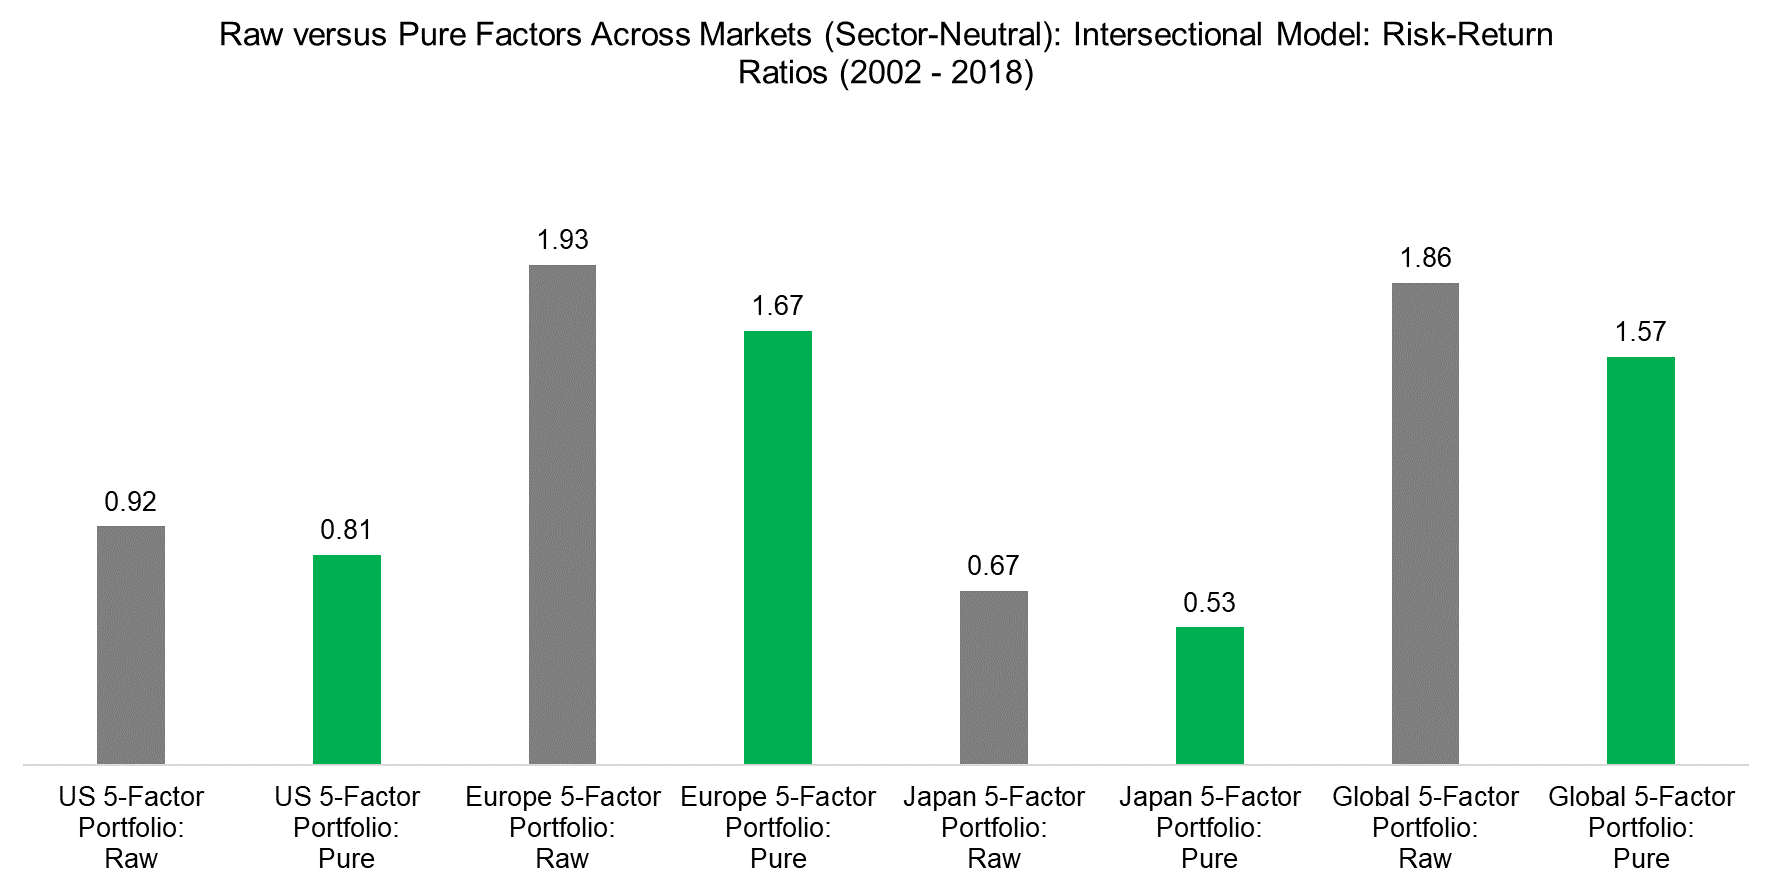
- Intersectional model: This model ranks stocks by several factors simultaneously and then derives one multi-factor portfolio
The multi-factor portfolios created via the combination model exhibit slightly lower risk-return ratios across markets after applying the optimisation process. The differences are not meaningful in the US and Europe, but significant in Japan.
Source: FactorResearch
Similarly, the risk-return ratios of multi-factor portfolios created via the intersectional model also decreased compared to raw multi-factor portfolios. It is worth noting that the results of the combination and intersectional models are relatively comparable. Please see our other white paper Multi-factor Models 101 for further details.
Source: FactorResearch
RESULTS DISCUSSION
The analysis highlights that constraining factors via an optimisation process has consequences for performance. The risk-adjusted returns were slightly lower for pure factors across markets. Investors might therefore argue that the raw factors are more attractive.
However, pure factors have desirable features from the following perspectives:
- Refined analytics: Pure factors empower investors to improve their understanding of factor performance, i.e. how much of the factor performance can be explained by other factors.
- Higher diversification benefits: Raw factors exhibit sector biases and exposure to other factors, therefore may represent duplicate risk exposure for a portfolio. Sector-neutral pure factors are less correlated and therefore provide higher diversification benefits for a portfolio.
- Tailored factor portfolios: Investors often focus on specific factors from a philosophical perspective, but will indirectly have exposure to other factors. Pure factors feature minimal exposure to other equity factors and allow investors to create portfolios that are tailored to their investment philosophies.
- Improved factor allocation:
- Risk parity: Investors using risk parity models to allocate to factors require volatility as an input for calculating allocation weights. Pure factors provide less diluted factor volatility and likely improve the allocation process.
- Tactical models: Investors who tactically allocate to factors typically want to avoid exposure to other factors as they have specific reasons for allocating to a target factor. For example, some factors might be considered crowded and therefore unattractive for an allocation. Pure factors allow to minimise the exposure to non-target factors.
Raw factors require fewer calculations than pure factors, but effectively resemble multi-factor portfolios with sector biases. Conversely, sector-neutral pure factors provide an undiluted perspective on factor performance.
FURTHER THOUGHTS
Two decades ago the outperformance of a fund manager was called alpha. Supported by better data and new technologies investors today realise that there is very little alpha and that most excess returns can be explained by exposure to sectors or systematic factors.
In factor investing the next frontier is to isolate the pure factors returns and identify the underlying factor drivers, which then can be used to create better allocation models. Ultimately it is a search for truth, which may not be pleasant, but will make us better investors.
RELATED RESEARCH
White paper: Factor Allocation Models
White paper: Multi-factor Models 101
APPENDIX
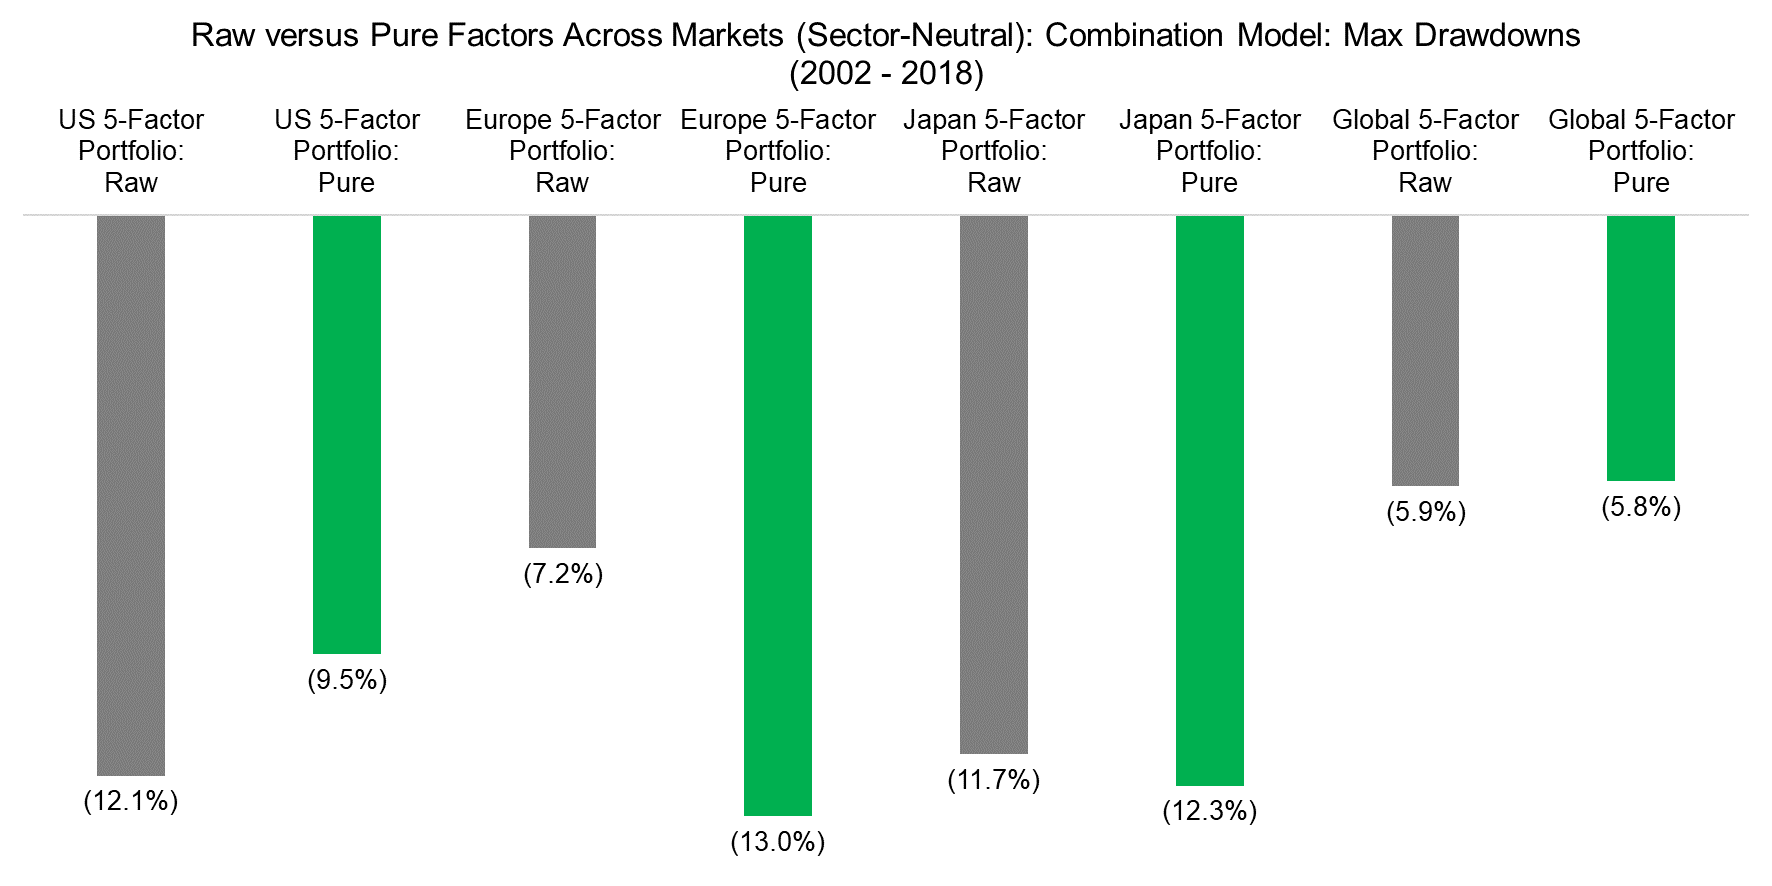
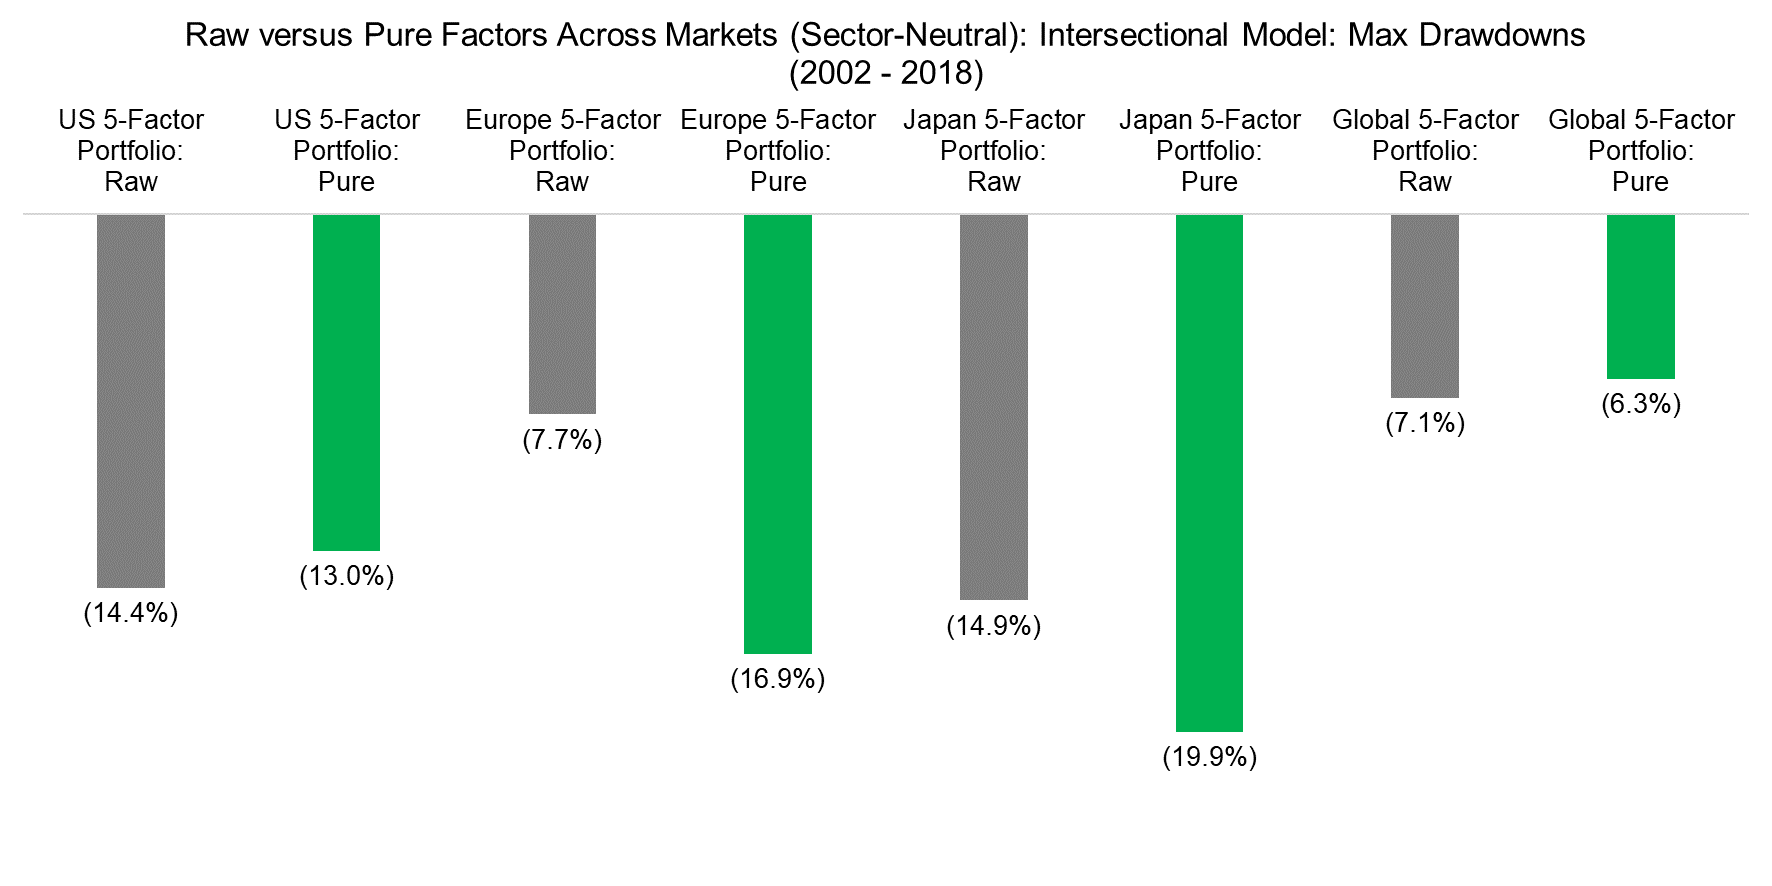
Investors might also be interested in the maximum drawdowns, which are shown for multi-factor portfolios for the period from 2002 to 2018. The maximum drawdowns reached were comparable when using sector-neutral raw and pure factors, regardless if the combination or intersectional model was employed for creating the multi-factor portfolios.
Source: FactorResearch
ABOUT THE AUTHOR
Nicolas Rabener is the CEO & Founder of Finominal, which empowers professional investors with data, technology, and research insights to improve their investment outcomes. Previously he created Jackdaw Capital, an award-winning quantitative hedge fund. Before that Nicolas worked at GIC and Citigroup in London and New York. Nicolas holds a Master of Finance from HHL Leipzig Graduate School of Management, is a CAIA charter holder, and enjoys endurance sports (Ironman & 100km Ultramarathon).
Connect with me on LinkedIn or X.

