Growth: Factor Investing Sinning?
Paying for Emotional Happiness?
July 2019. Reading Time: 10 Minutes. Author: Nicolas Rabener.
SUMMARY
- Growth stocks outperformed the US stock market since 1992
- However, the higher returns are explained by higher betas
- The long-short factor performance was negative, even if adjusted for other factor exposure
INTRODUCTION
Given a choice between investing in a fast-growing company with great management versus one with declining sales and too much leverage, most investors would likely pick the former. Rephrasing the question between buying a Growth versus a Value stock, however, would likely lead to most investors choosing the later, which highlights inconsistent investment behavior.
Hundreds of research papers have been published on the Value factor highlighting positive excess returns across stock markets and asset classes. In contrast, there is almost no literature, aside from marketing materials, supporting the Growth factor.
However, there is a significant difference between how Growth stocks are defined in academic research versus selected in portfolios of systematic investment products like smart beta ETFs. In research, Growth stocks are typically viewed as expensive stocks, which represents the short portfolio of the Value factor. If the Value factor generates positive abnormal returns over time, then excess returns from Growth stocks must be negative (read Factors: Correlation Check).
In contrast to research, most investment products focused on Growth stocks select stocks based on various backward-looking accounting metrics like sales or earnings growth, which does not necessarily equate to selecting the most expensive stocks.
In this short research note, we will analyze the Growth factor as seen in systematic investment products.
METHODOLOGY
We focus on the Growth factor in the US stock market, which we define by a combination of the three-year sales-per-share and earnings-per-share growth. Only stocks with a minimum market capitalization of $1 billion are included. Portfolios are rebalanced monthly and each transaction incurs costs of 10 basis points.
BREAKDOWN BY SECTORS
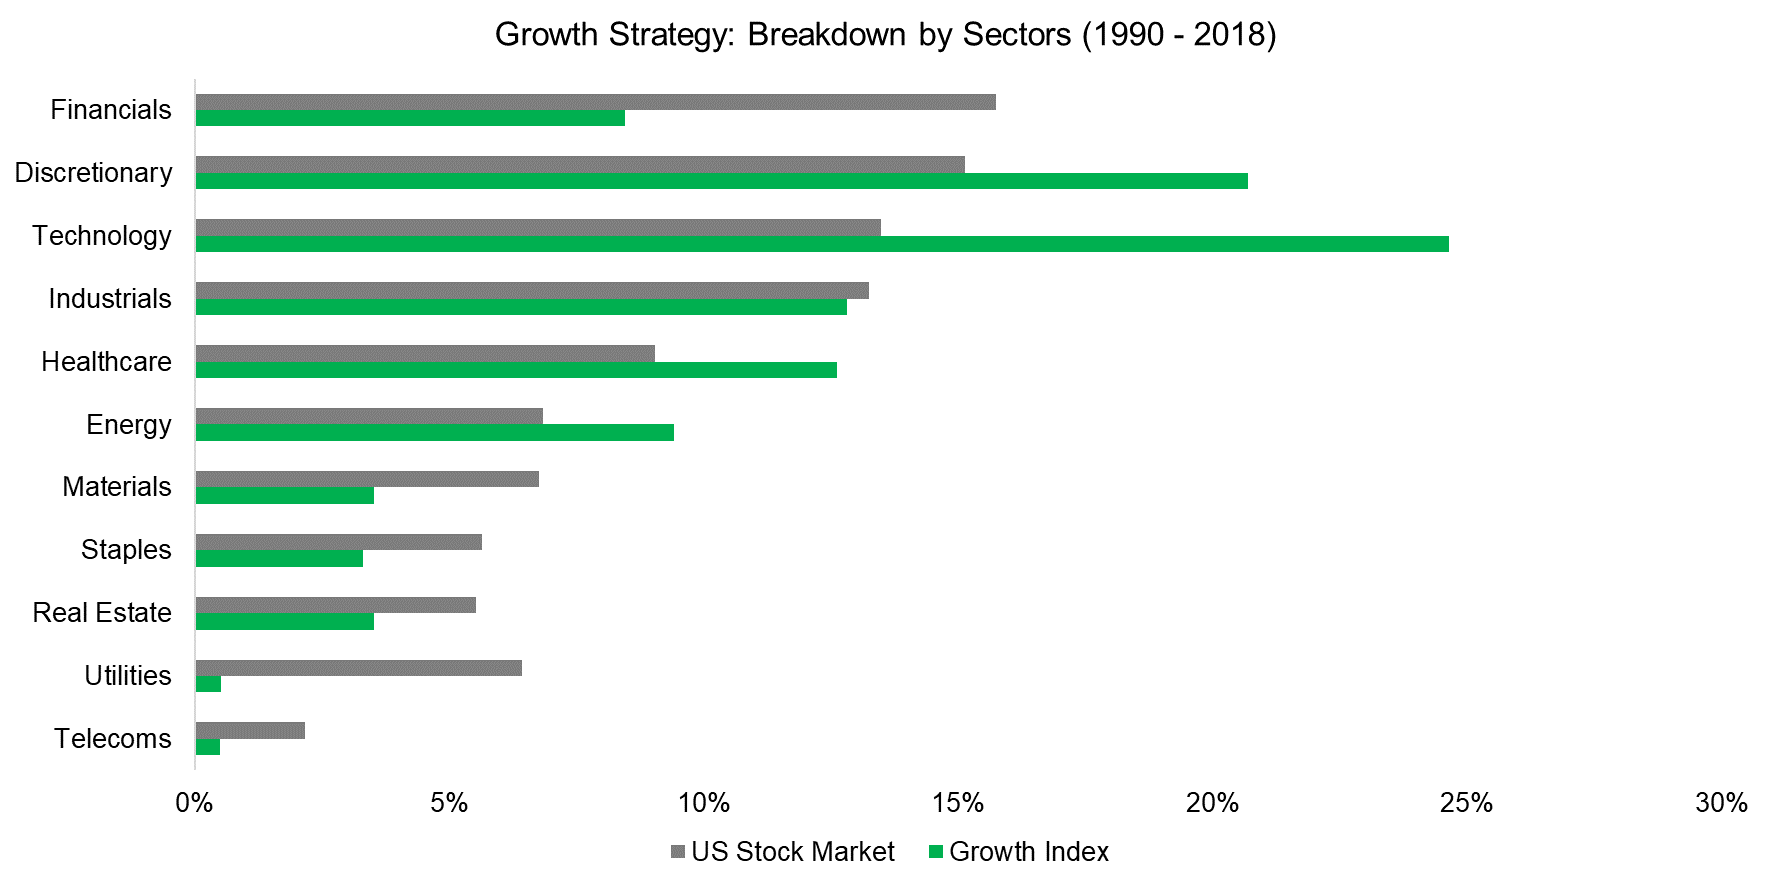
Many investors use Growth and technology stocks interchangeably. And indeed, the technology sector contributed approximately 25% of the stocks to the Growth portfolio since 1990, compared to only 13% to the overall stock market. The second largest contributor was the consumer discretionary sector, followed by industrials and healthcare.
As expected, sectors like real estate, telecoms or utilities that are comprised of companies featuring low growth in sales and earnings were underweighted. The composition of a Growth portfolio was markedly different from that over the stock market.
Source: FactorResearch
PERFORMANCE OF GROWTH STOCKS
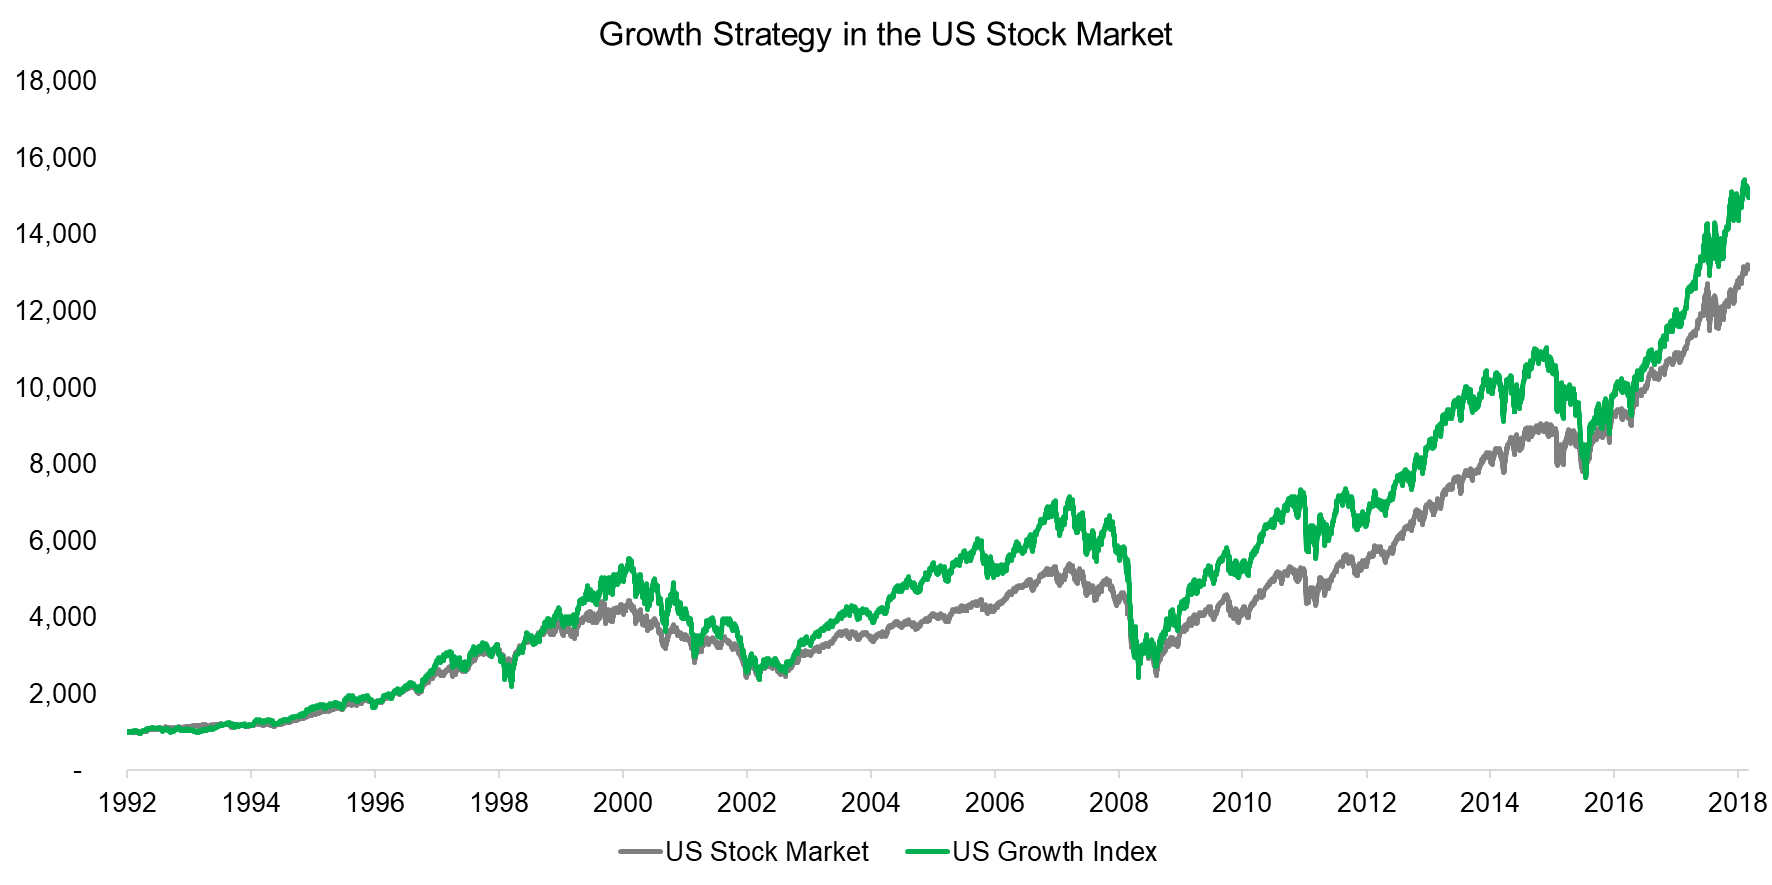
We observe that an index comprised of the top 10% of fastest-growing companies in the US outperformed the stock market since 1992. However, the US Growth index only outperformed in certain periods and underperformed in market downturns like during the global financial crisis between 2008 and 2009. These performance characteristics are explained by Growth stocks featuring a beta of 1.2 on average, which effectively made Growth akin to a leveraged bet on the stock market.
Source: FactorResearch
GROWTH STOCKS & VALUATIONS
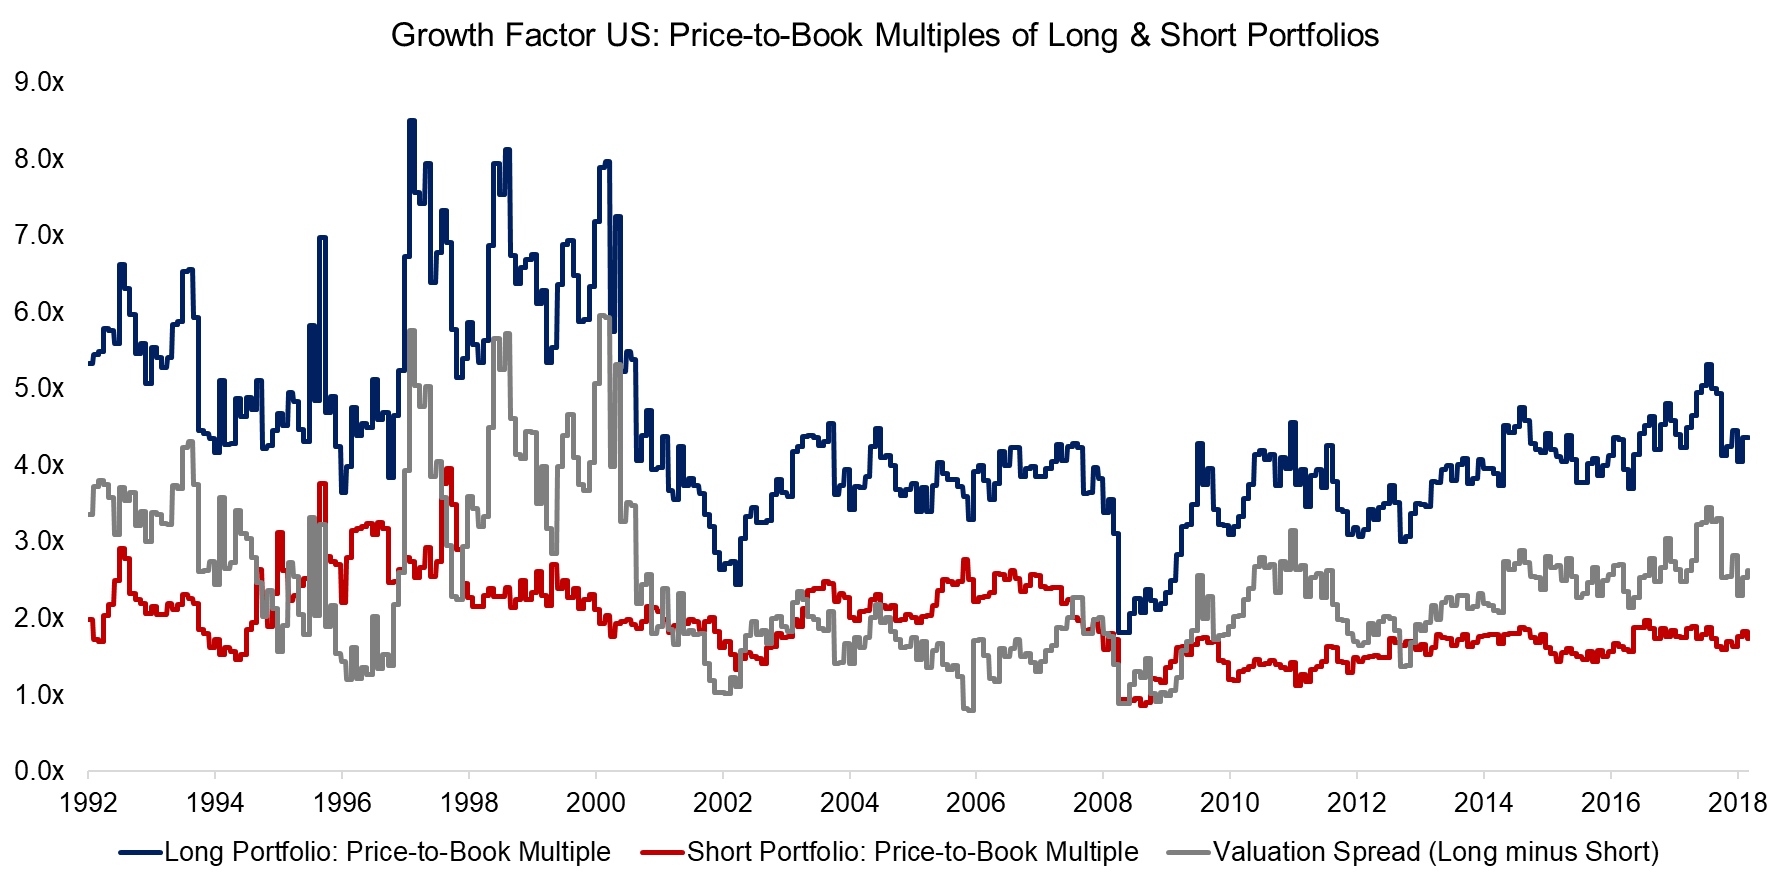
Investors value fast-growing companies at higher multiples than slow-growing companies, although the difference is highly time-varying. We observe that the valuation spread, i.e. the difference between the long and short portfolio as measured via price-to-book multiples, was at extreme levels during the tech bubble.
Although market participants have been concerned about high valuations of Growth stocks in recent years, the valuation spread is far from the historical peak levels reached between 1998 and 2000.
Source: FactorResearch
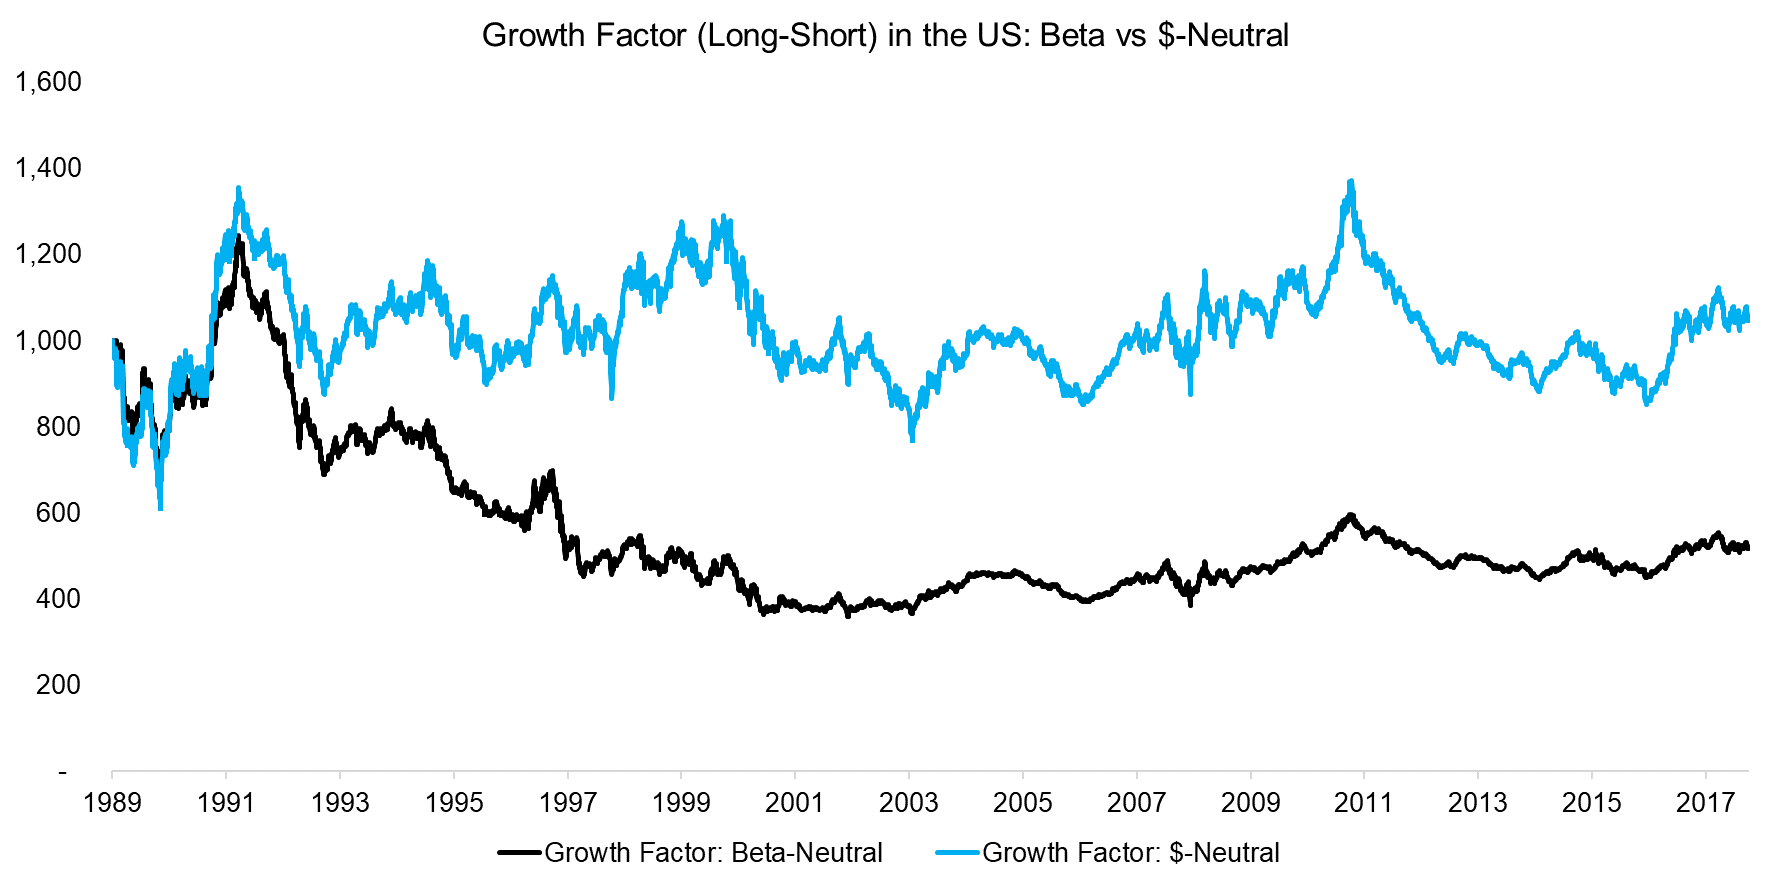
Next, we analyze the performance of the long-short Growth factor, which is defined as buying fast-growing and selling slow-growing companies. We observe that the dollar-neutral portfolio generated slightly positive returns, but that is explained by the structurally positive net beta and a rising stock market since 1989. If the portfolio is structured beta-neutral, then the returns were highly unattractive.
Source: FactorResearch
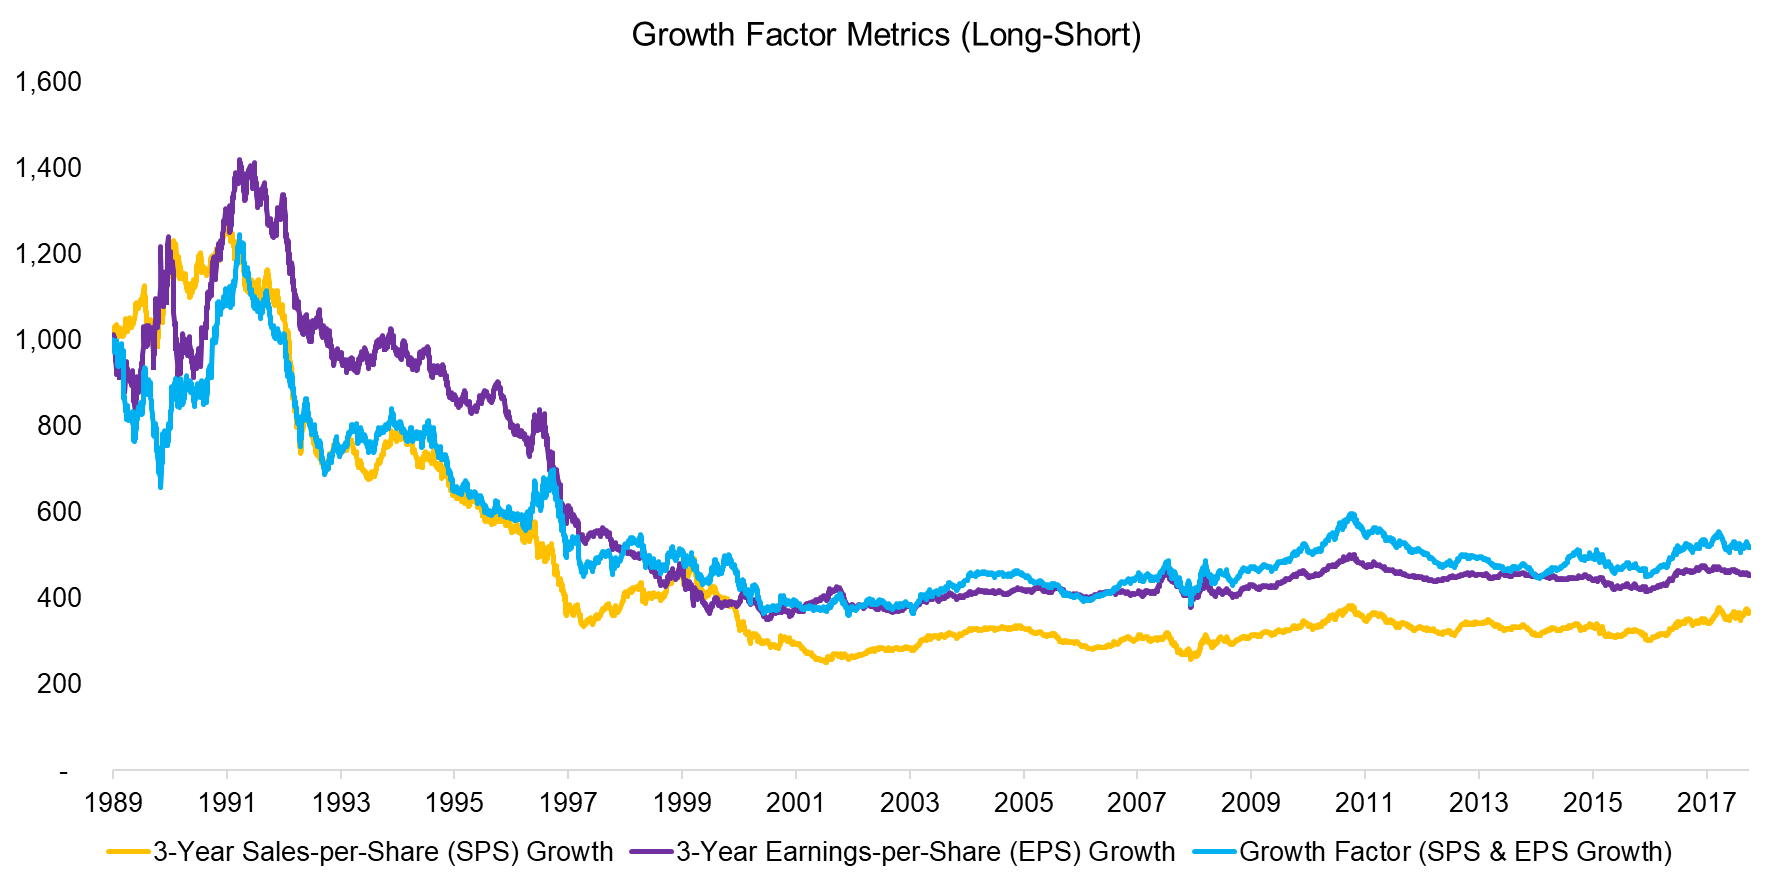
Investors might question how dependent the performance is on the factor definition. Interestingly, it does not seem to matter if Growth is measured by the change in sales-per-share or earnings-per-share. We also tested various lookback periods and the difference between measuring Growth over one, three, or five years is marginal.
Source: FactorResearch
FACTOR EXPOSURE ANALYSIS OF THE GROWTH FACTOR
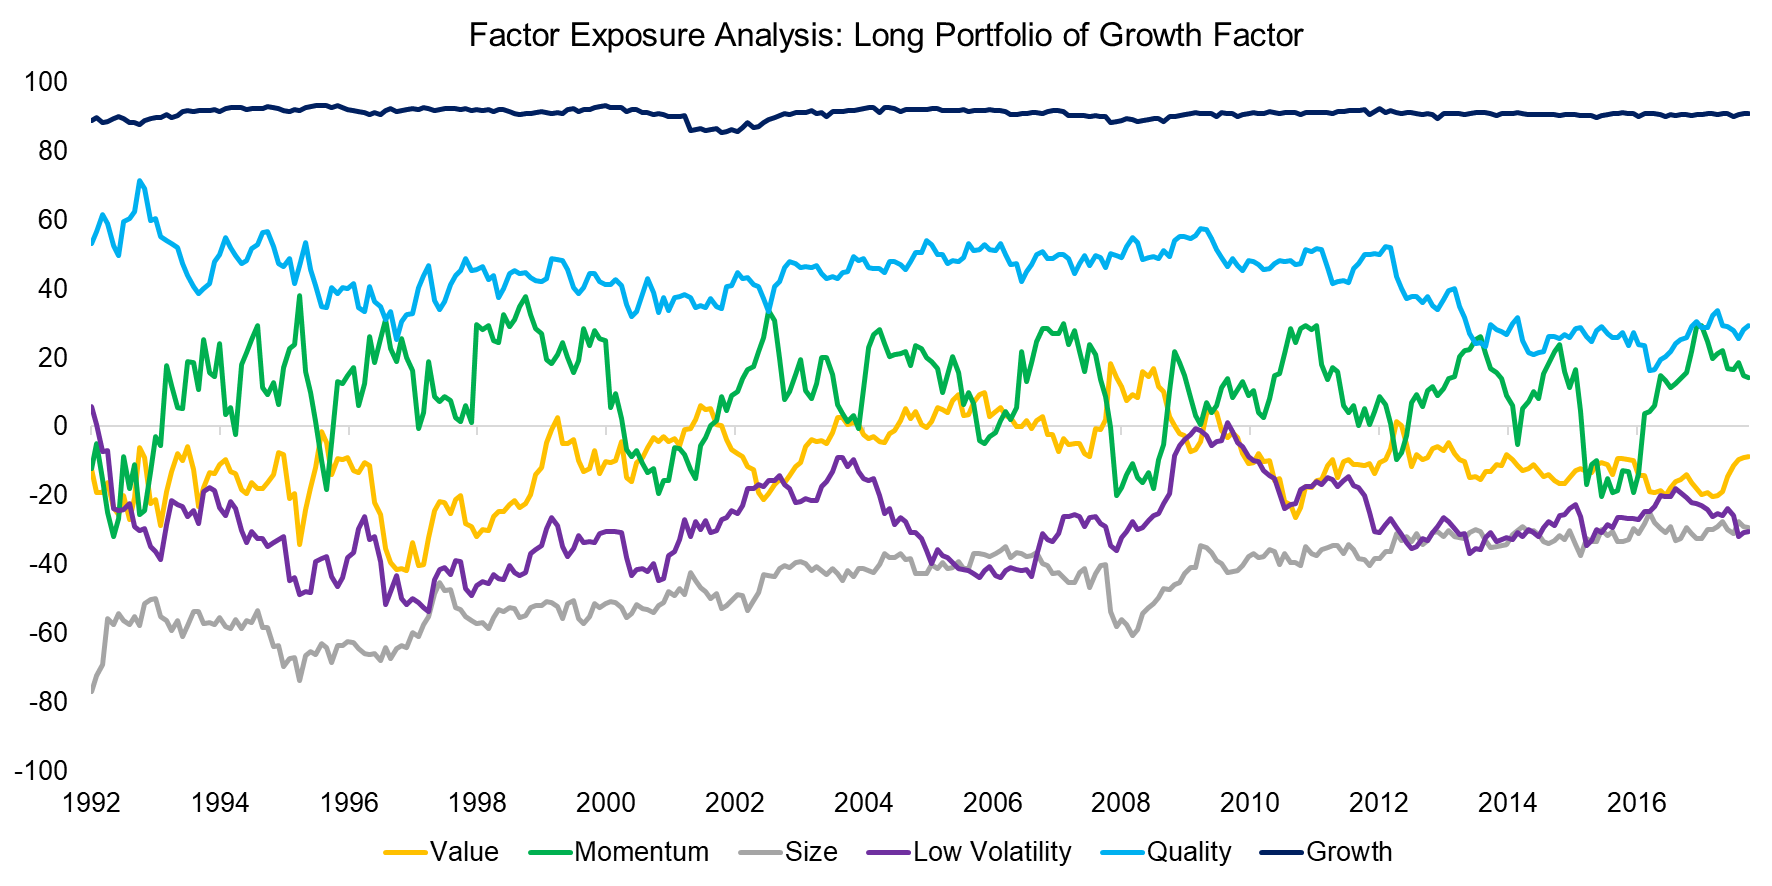
Although Growth stocks are not simply defined as the most expensive stocks in investible products like smart beta ETFs, fast-growing companies still trade at higher valuation multiples than slow-growing firms. Investors might therefore expect that the long portfolio of the Growth factor has negative exposure to Value, however, a factor exposure analysis reveals only slightly negative exposure since 1992.
We observe that stocks with high growth are characterized by featuring positive exposure to Quality and Momentum and negative exposure to Value, Low Volatility, and Size factors. Stated differently, high growth stocks tend to have low leverage, high profitability, strong stock performance, slightly expensive valuation, large market capitalization, and high share price volatility.
Source: FactorResearch
RESIDUAL GROWTH FACTOR PERFORMANCE
Investors might question if the exposure to other factors explains the poor performance of the long-short Growth factor. For example, the negative exposure to the Low Volatility factor, which has been the best performing factor in the US since 2000, was unlikely accretive (read Low Volatility Factor: Interest Rate Sensitivity & Sector-Neutrality).
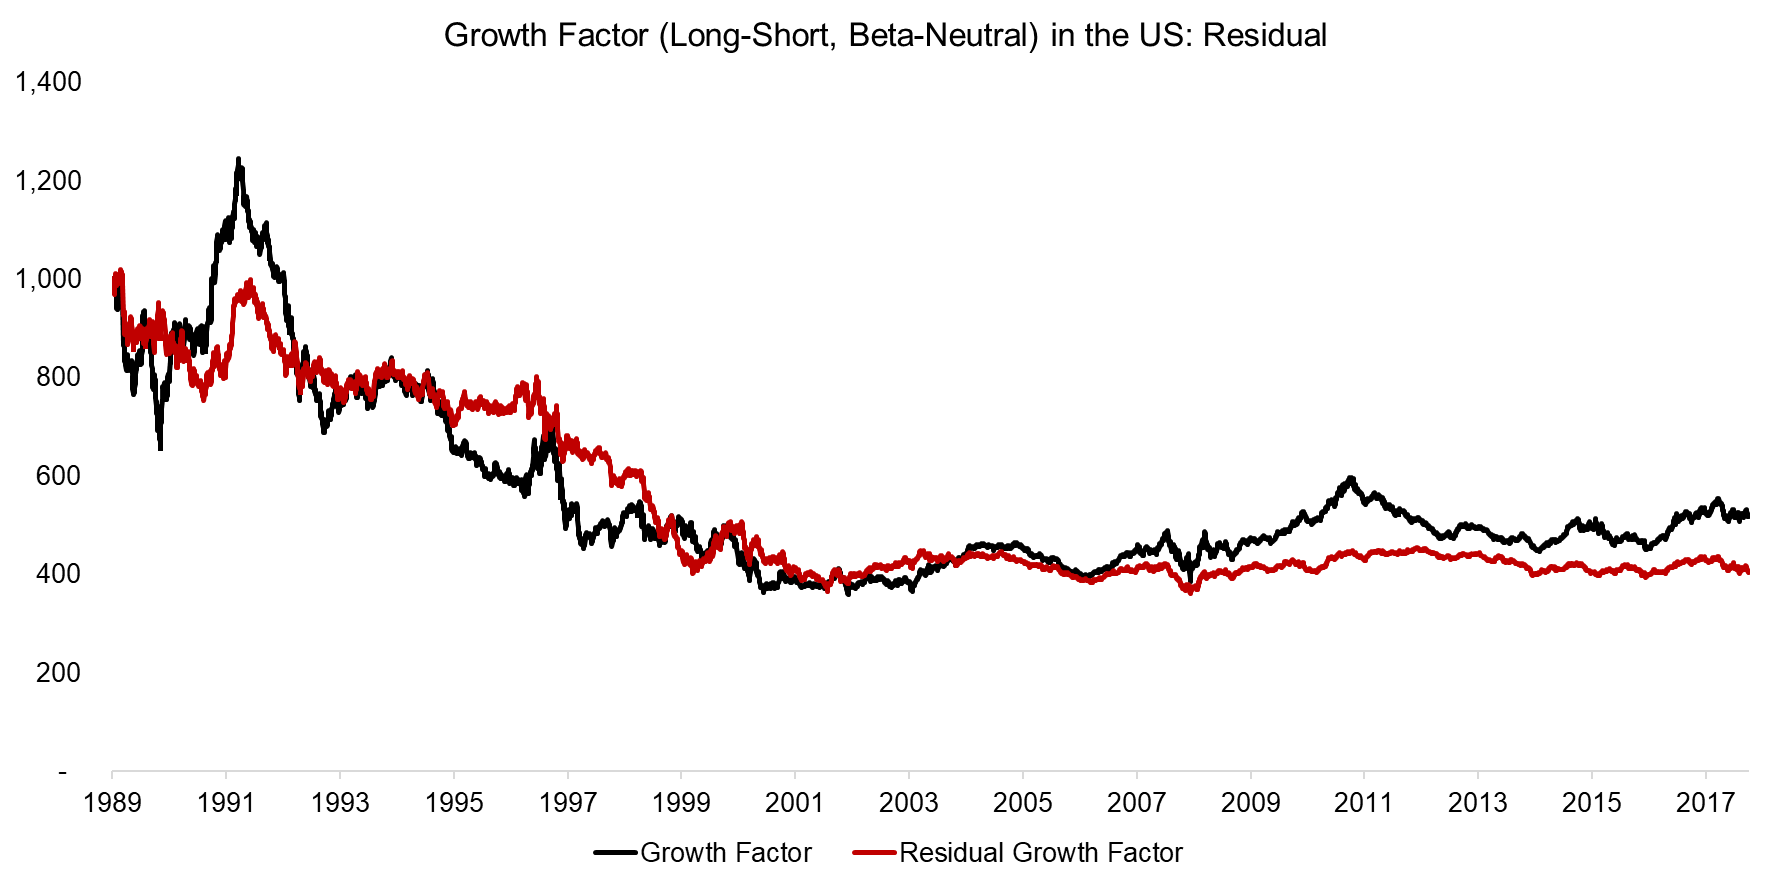
We therefore calculate the residual factor by maximizing the exposure to Growth and minimizing the exposure to all other factors. However, the results highlight a similarly unattractive performance of the residual factor.
Source: FactorResearch
FURTHER THOUGHTS
This short research note highlights that the Growth factor generated negative returns over the last 30 years, which is intuitive. Growth stocks are emotionally appealing given attractive business and industry characteristics, but it is challenging to derive a rationale why investors should be earning positive excess returns for holding these stocks.
Our analysis can be challenged by our choice of backward-looking metrics for stock selection. Investors might argue that using forward-looking data like expected earnings growth might result in better factor performance. Although this might be the case, it is worth highlighting that stock analysts have a poor track record in accurately forecasting fundamental data, which casts some doubt on forward-looking data being more useful than historical data.
RELATED RESEARCH
ABOUT THE AUTHOR
Nicolas Rabener is the CEO & Founder of Finominal, which empowers professional investors with data, technology, and research insights to improve their investment outcomes. Previously he created Jackdaw Capital, an award-winning quantitative hedge fund. Before that Nicolas worked at GIC and Citigroup in London and New York. Nicolas holds a Master of Finance from HHL Leipzig Graduate School of Management, is a CAIA charter holder, and enjoys endurance sports (Ironman & 100km Ultramarathon).
Connect with me on LinkedIn or X.

