Convexity as a Factor
Finally, a Free Lunch?
November 2024. Reading Time: 10 Minutes. Author: Abhik Roy, CFA.
SUMMARY
- Convex stocks provided tail risk protection over the last 20 years
- However, a long-short convexity index would have underperformed the stock market
- The hedging characteristic is limited to the short side of the portfolio
INTRODUCTION
Higher returns in finance are generally associated with higher risk and vice versa. As a straightforward example, we have previously researched leverage as a tool to increase performance but it comes with a higher risk and a deteriorating Sharpe (read Outperformance via Leverage). Similarly, buffered ETFs offer lower risk but underperform markets over a long period and can simply be replicated using a diluted equity exposure.
How about convexity? Convexity is often discussed in the context of bond markets, where a bond with higher convexity provides a higher upside and lower downside than a lower convexity bond. But generally, this is priced into the yields and consequently, a higher convexity bond offers a lower yield. Since equity pricing is very subjective, we might just find an uncompensated advantage in stocks.
In this research article, we compare the performance of stocks with different convexities and evaluate if there is any edge in these stocks.
WHAT IS CONVEXITY?
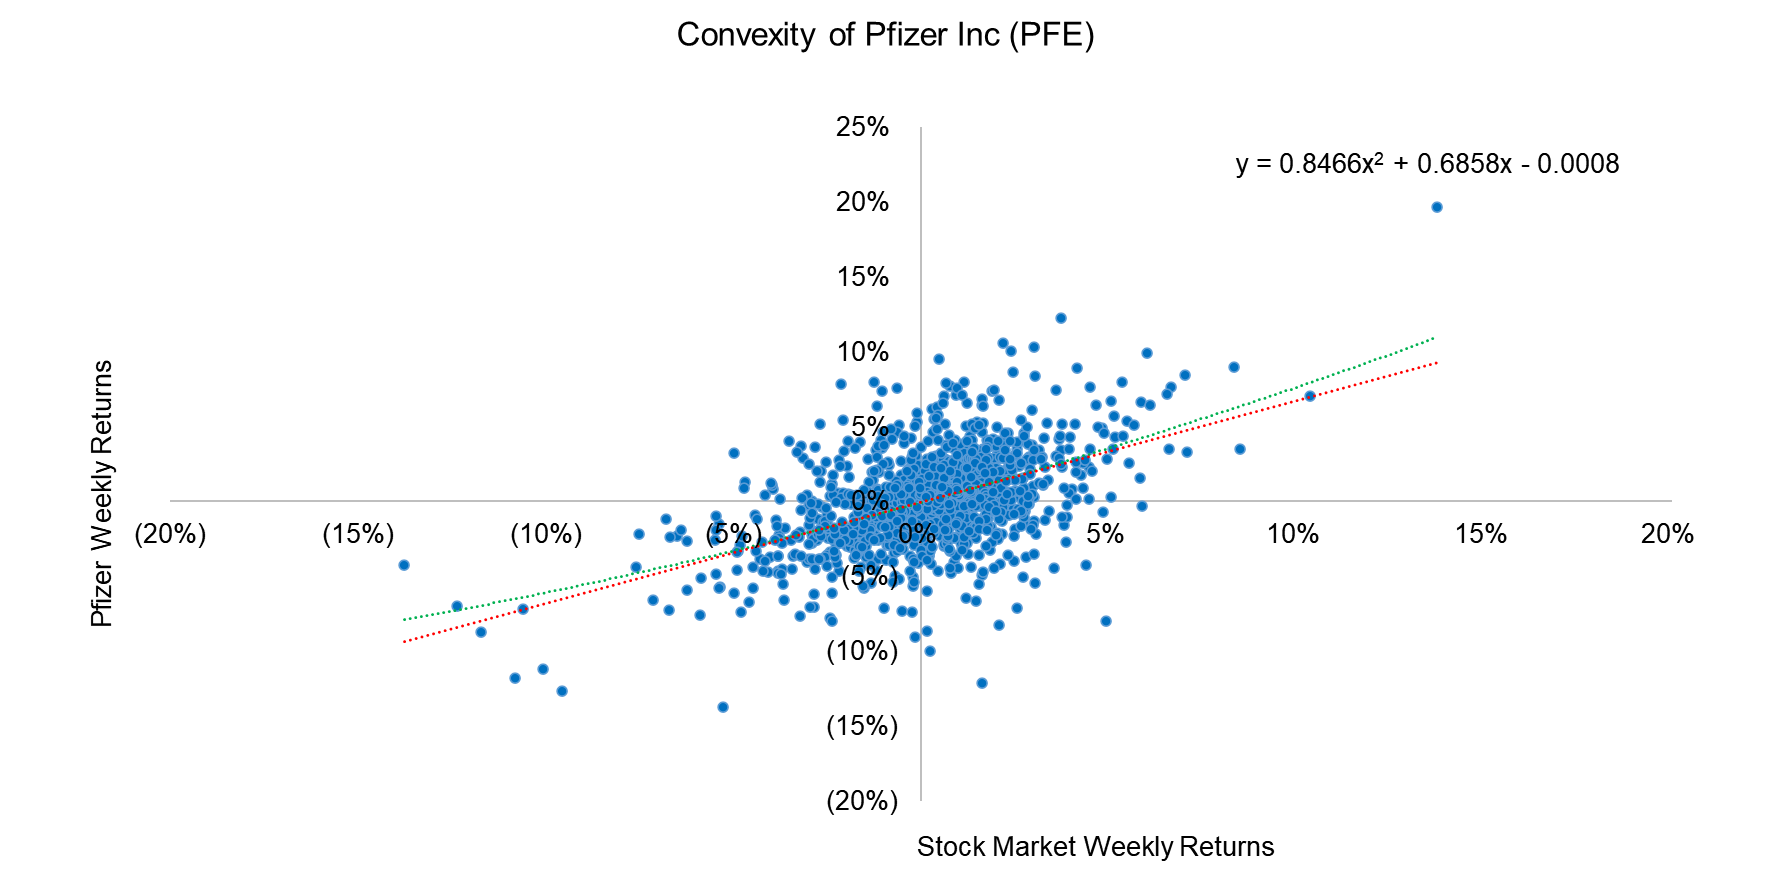
Convexity is a measure of the curvature of the relationship between an asset’s price and an underlying factor. In bonds, convexity is measured with respect to changes in interest rates. For equities, we investigate the relationship between stock prices and market returns.
We take the example of Pfizer Inc. (PFE), where we plot the weekly returns against the market and fit a linear and quadratic curve to the distribution. The red dot line shows the linear fit while the green curve indicates a quadratic fit in the chart below. We observe a convex quadratic curve i.e. the coefficient of the quadratic term is positive for the stock so; Pfizer Inc. can be considered as a stock with positive convexity, i.e. it outperformed the market in extreme upward or downward moves.
Source: Finominal
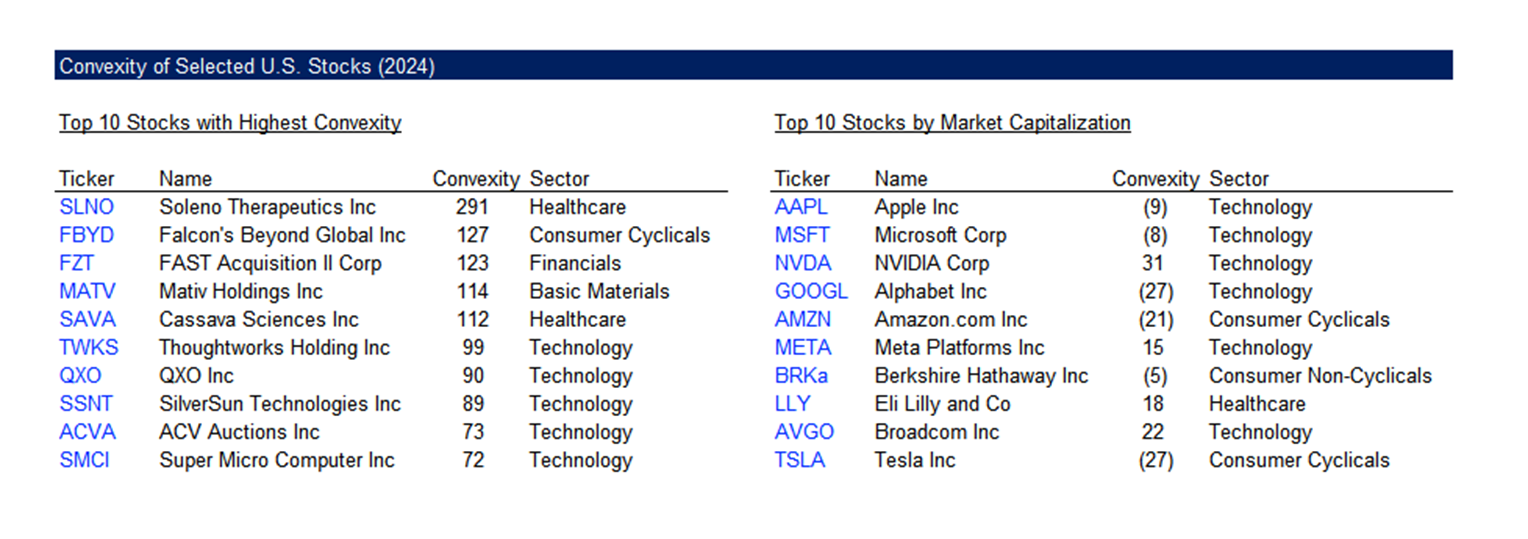
We list the top 10 stocks with the highest convexity over the last year and the convexities of the largest stocks trading in the U.S. stock market. We notice quite a variation in the values which indicates that convexity is not a sector-specific attribute.
Source: Finominal
LONG-SHORT CONVEXITY FACTOR
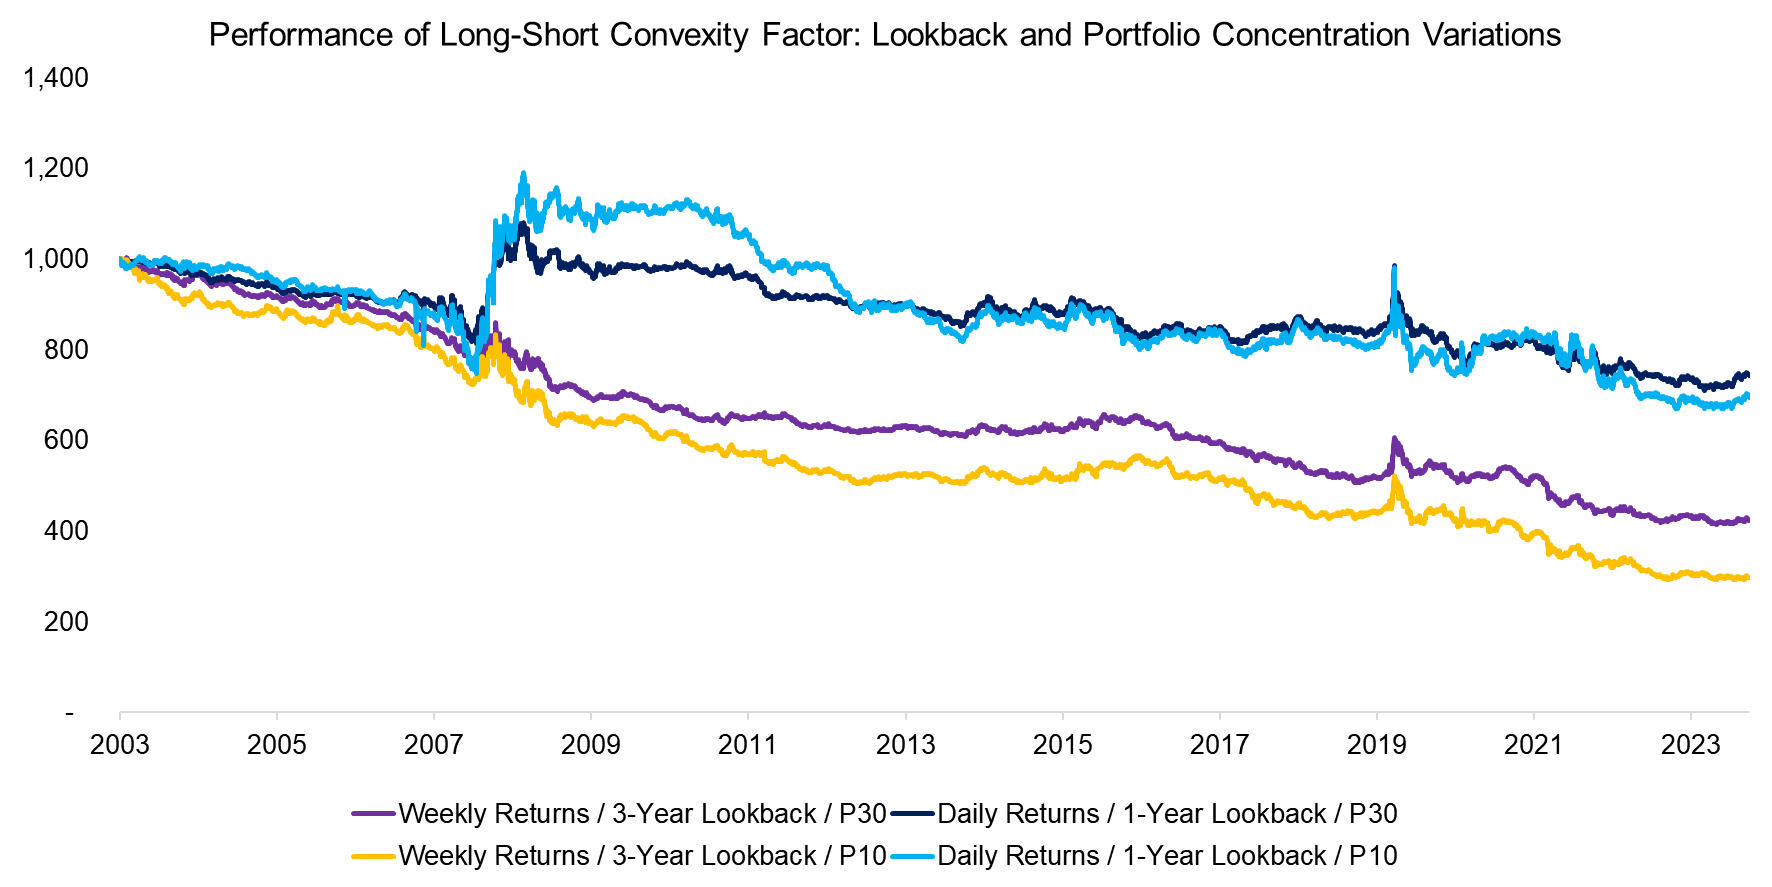
Next, we create a few long-short indices to measure the efficacy of the convexity factor. The portfolio is created by going long the most convex and going short the least convex stocks, which is adjusted to achieve beta-neutrality. We run a few variations of the factor where we consider different lookbacks i.e. 1-year versus 3-year, different timeframes, i.e. weekly versus daily returns for the distributions, and the universe, i.e. the top and bottom 10% versus 30% of stocks (P10 & P30).
Source: Finominal
We observe that all the indices exhibit a gradual decay in performance but offer upward spikes during stress periods, notably during the GFC in 2009 and the Covid-19 crisis in 2020. The 1-year lookback indices feature a lower decay and more pronounced hedging characteristics for the P10 index, hence we will focus on the portfolio based on daily returns, a 1-year lookback, and top and bottom 10% of stocks for the remainder of the research.
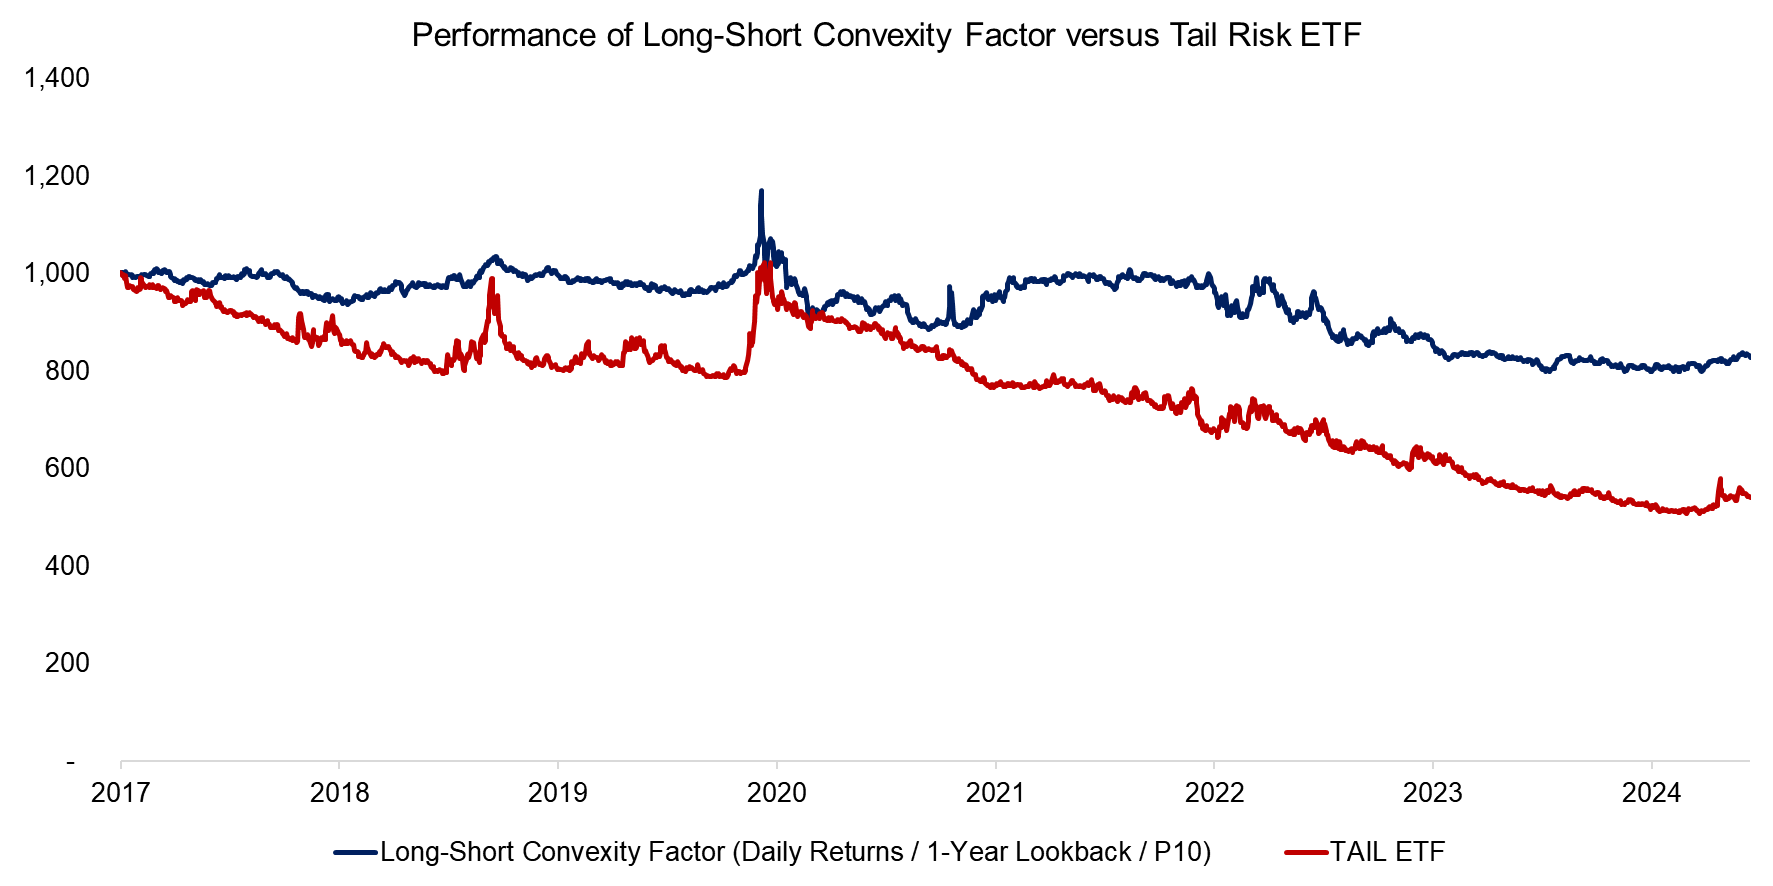
The performance of this index is strikingly similar to tail risk funds, so we compare the convexity index with the Cambria Tail Risk ETF (TAIL). TAIL has underperformed the convexity index, but provided better downside protection during market downturns as evident from the higher spikes in the 2018 and 2020 periods. In both cases, the downside protection comes at the price of long-term negative returns.
Source: Finominal
LONG VERSUS SHORT CONVEXITY
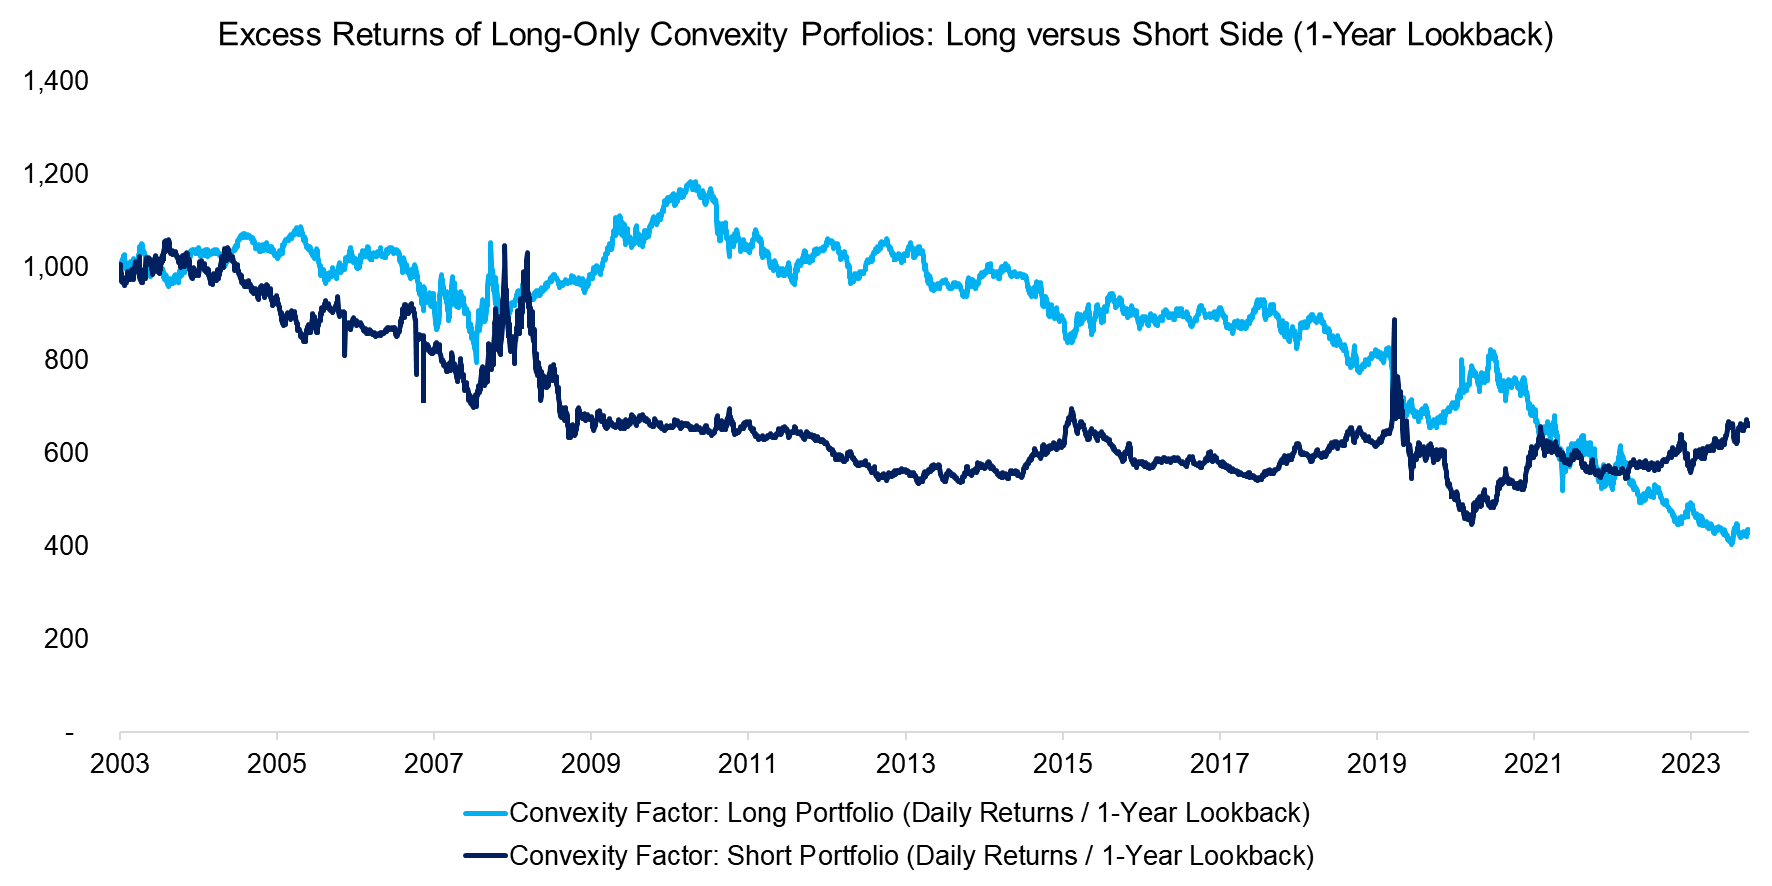
Next, we evaluate whether the hedging and gradual underperformance characteristics is a function of the long side or the short. So, we create excess return indices using market returns for the long and short side separately. Interestingly, all the hedging characteristic came from the short-side while the long-side underperformed the markets continuously. Overall, both legs have underperformed the market over the last 20 years.
Source: Finominal
BREAKDOWN BY SECTORS
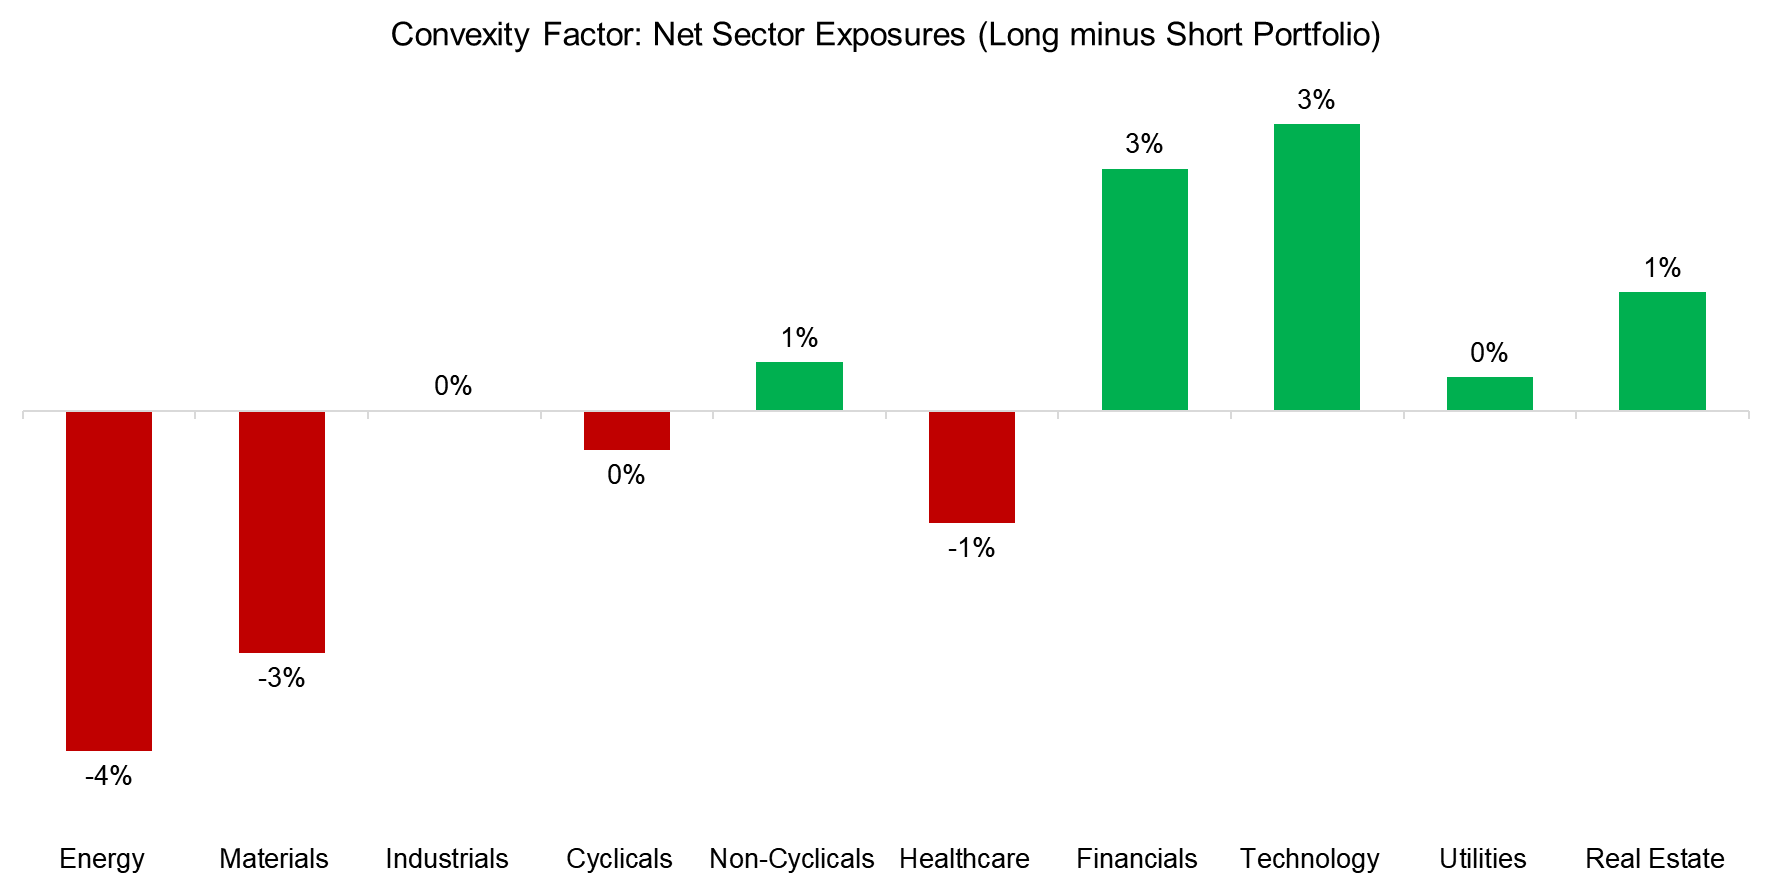
Although convex stocks can be found across all sectors, we evaluate whether there is any structural bias for any of the sectors. We calculate the net sector exposure by subtracting the short portfolio sector weights from the long.
We find the largest underweight in the energy sector which is perhaps due to its underperformance over certain periods in the last decade i.e. from 2015 to 2018 and during the Covid-19 period (negative convexity can be due to underperformance during both market crashes and bull market rallies).
In contrast, the largest overweight is in technology due to its higher resilience than other sectors during the COVID-19 period. But readers should be cautious about this as the back-test period does not contain the dot-com bubble where technology companies suffered the biggest drawdowns.
Source: Finominal
FURTHER THOUGHTS
So, do convex stocks deserve an allocation in your portfolio?
Although the long-short convexity factor provides hedging characteristics, it comes at the cost of long-term performance. Almost all investors struggle with strategies that consistently lose small amounts of money, which makes this only suitable for a tactical allocation, but that requires impossible market timing skills.
Unfortunately, there is no hidden edge in convex stocks and so the famous quote by Nobel Prize laureate Harry Markowitz still holds true – “Diversification is the only free lunch in investing.”
RELATED RESEARCH
Hedging Bear Markets & Crashes with Tail Risk ETFs
Tail Risk Hedge Funds
What´s Better than the S&P 500?
Evaluating Inflation Hedges
Risk-Managed Equity Exposure
Skewness as a Factor
Duration as an Equity Factor
ABOUT THE AUTHOR
Abhik Roy, CFA is a Quantitative Researcher at Finominal, which empowers professional investors with data, technology, and research insights to improve their investment outcomes. Abhik holds a Masters in Economics and Bachelors in Engineering from BITS Pilani. Previously he worked at Kristal.AI, a Singapore based fintech firm as a Quantitative Analyst.
Connect with me on LinkedIn.

