Factor Exposure Analysis 108: Fixed Income Factors II
Style versus traditional fixed income factors
SUMMARY
- There are style factors like value and traditional fixed income factors like term premium
- The correlations of these factors has been low
- However, it is not clear which are better suited for a factor exposure analysis
INTRODUCTION
In our last research article, we compared fixed income factors from two asset managers, namely AQR Capital Management and Robeco, which highlighted different security selection and portfolio construction processes. Although these two data sets included the same factors, eg value and momentum, these were completely uncorrelated, which raised the question of which data set is most suitable for running a factor exposure analysis on bond mutual funds (read Factor Exposure Analysis 107: Fixed Income Factors).
It is worth noting that these factors can be called style factors as they mimic how investors might select bonds, eg buying cheap, outperforming, or high-quality bonds. However, fixed income investors tend to use metrics like the term or credit spread when discussing bonds rather than highlighting a high exposure to the value factor.
In this research article, we will contrast style versus traditional fixed income factors.
TERM & CREDIT PREMIUM FACTORS
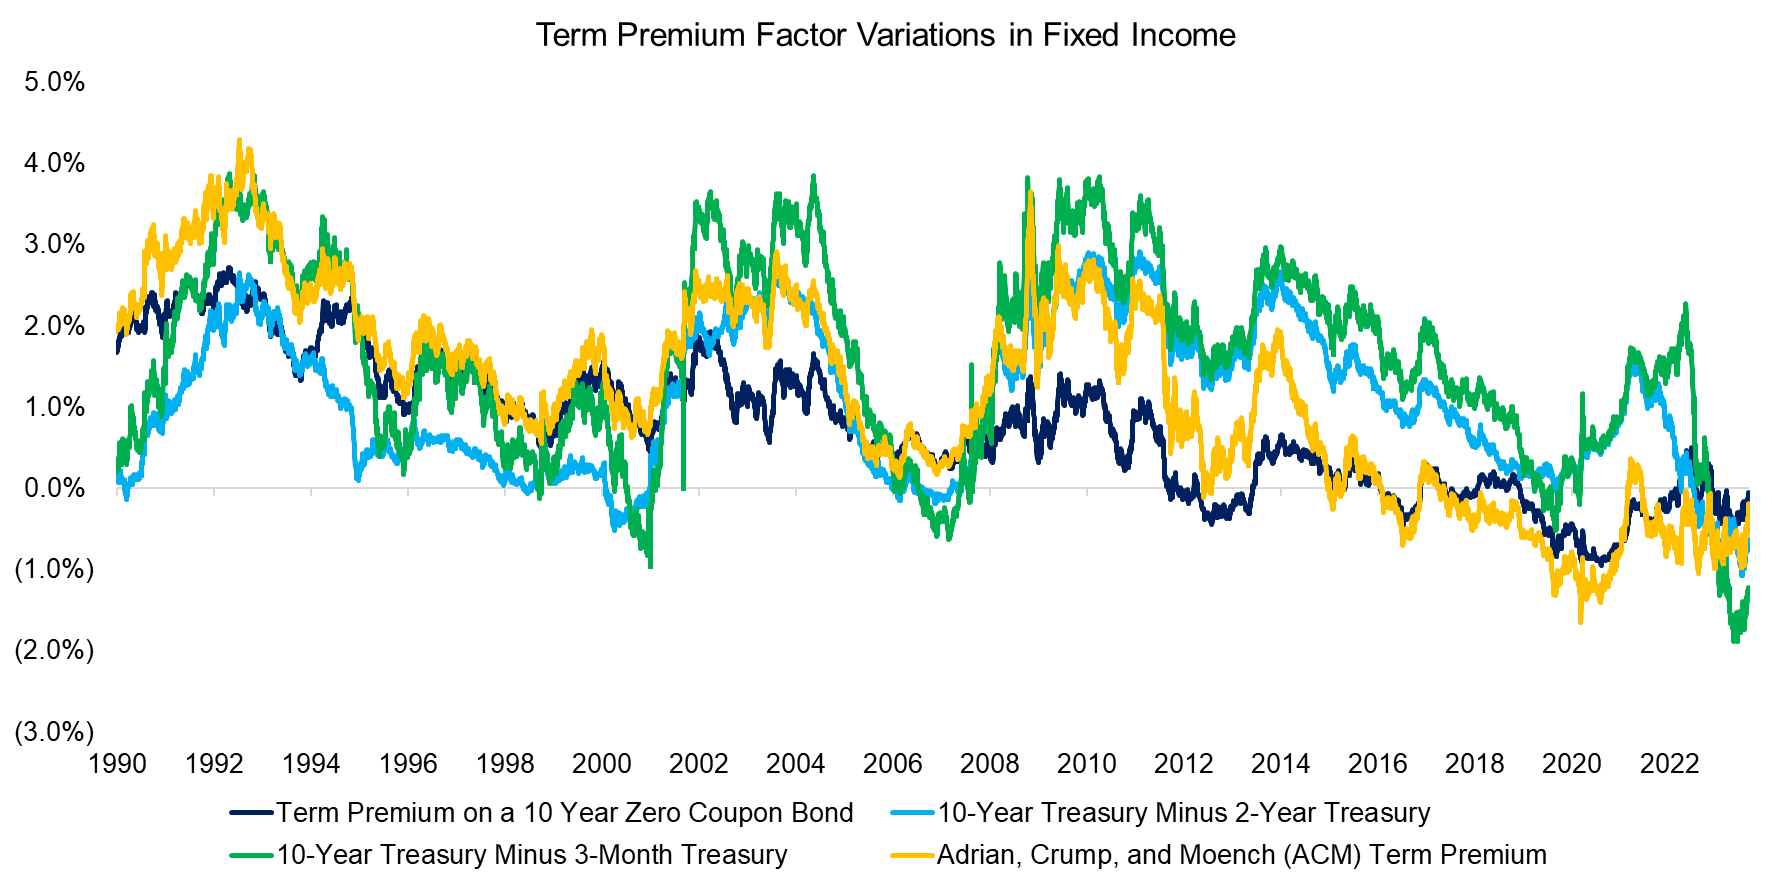
The term premium refers to the excess yield that investors get paid for holding long versus short-term bonds, assuming the same issuer risk. There are plenty of choices for measuring the term premium, for example, the 10-year US Treasury minus the 2-year US Treasury or the ACM Term Premium from Adrian, Crump, and Moench, who all worked at the Federal Bank of New York.
Comparing the four term premium factors in the period from 1990 to 2023 highlights similar trends across time, where correlations ranged between 0.3 and 0.9. The premium was positive on average for all four variations with the Term Premium on a 10-Year Zero Coupon Bond exhibiting the lowest premium at 0.8% and the ACM Term Premium the highest premium at 1.2%.
Certain variations of the term premium factor are also called the yield curve, where some research indicates that a negative yield spread foreshadows a recession as investors become more risk-averse and increase their allocation from short to long-term bonds. All four term premium variations have been negative over the last 12 months, which may indicate an economic downturn.

Source: FRED, Federal Reserve Bank of New York, Finominal
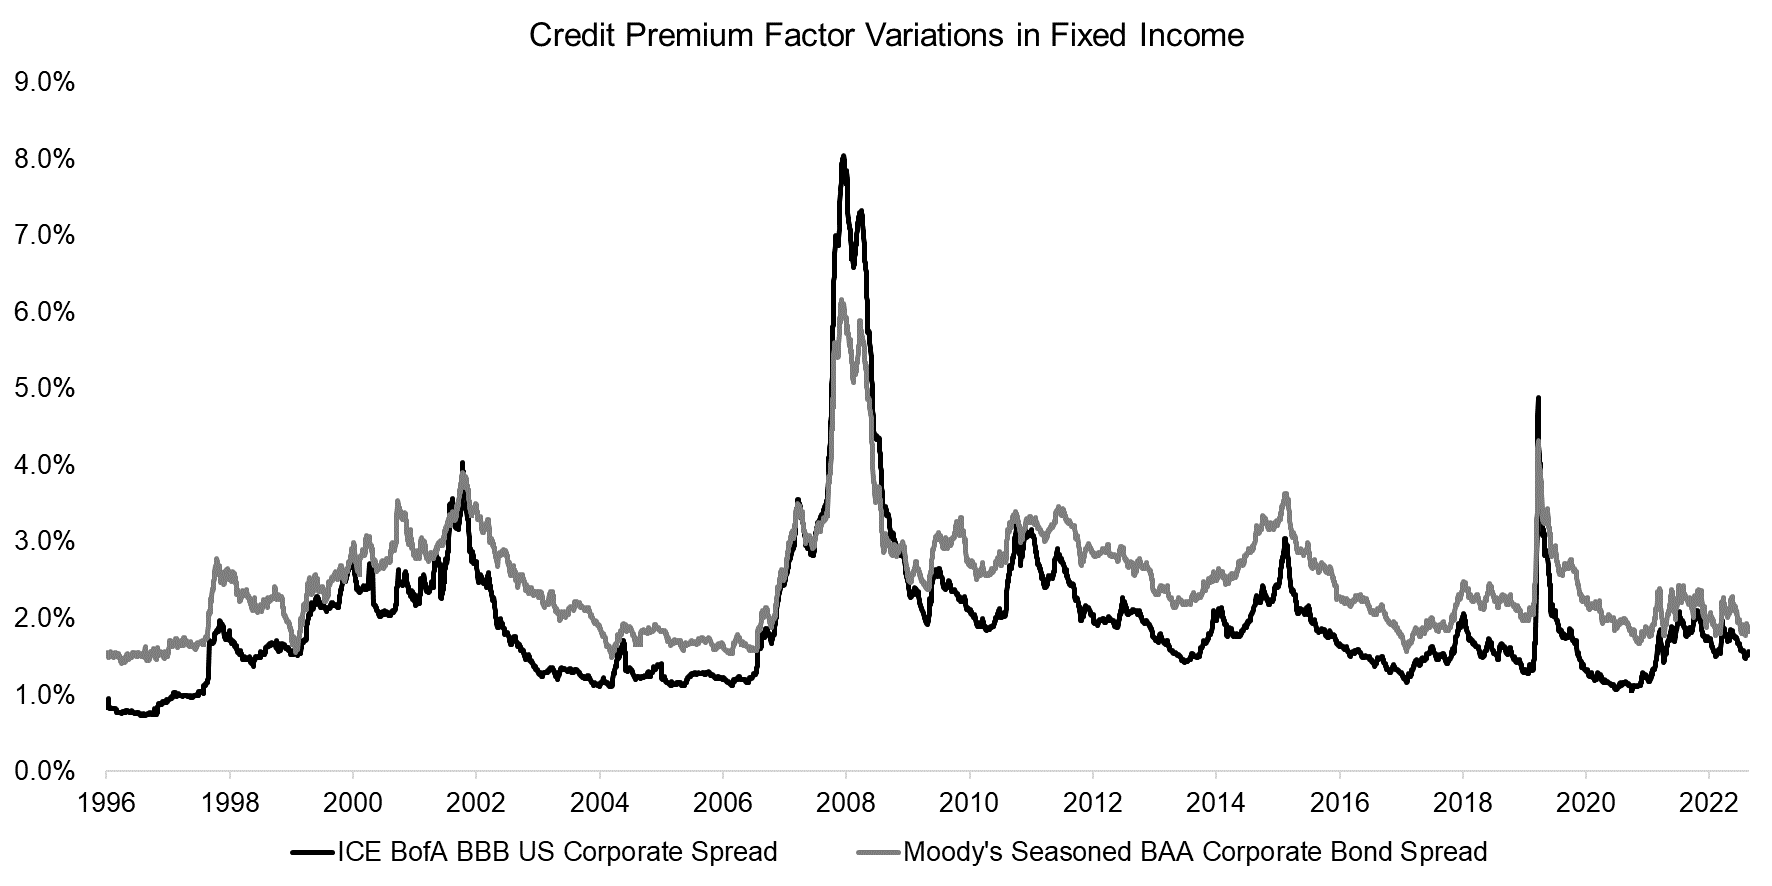
Similarly to the term premium, there are various options for measuring the credit premium, which represents the excess yield or spread investors earn for taking higher risks than with US Treasuries, eg by buying corporate or high yield bonds.
We show the ICE BofA BBB US Corporate Spread and Moody’s Seasoned BAA Corporate Bond Spread indices, which exhibited a 0.94 correlation between 1996 and 2023. In periods of economic stress like during the global financial crisis in 2009 or the COVID-19 crisis in 2020, the credit spread of corporate bonds to US Treasuries widened to two or three times higher than its 2% average.

Source: FRED, Finominal
CORRELATION ANALYSIS
Next, we compute the correlations between the style and traditional fixed income factors. The style factors, namely value, momentum, carry, and defensive, are sourced from AQR. We observe that none of the factors was highly correlated to the bond market as represented by the Bloomberg US Aggregate Bond Index, or to each other, which should make them suitable independent variables in a regression-based factor exposure analysis.
The carry and value factors exhibited the highest correlation at 0.5 as these are somewhat related factors. Both represent metrics for evaluating the cheapness or expensiveness of bonds. The value and momentum factors were negatively correlated at -0.4, which is also often observed in the equity space.

Source: Finominal
FACTOR EXPOSURE ANALYSIS
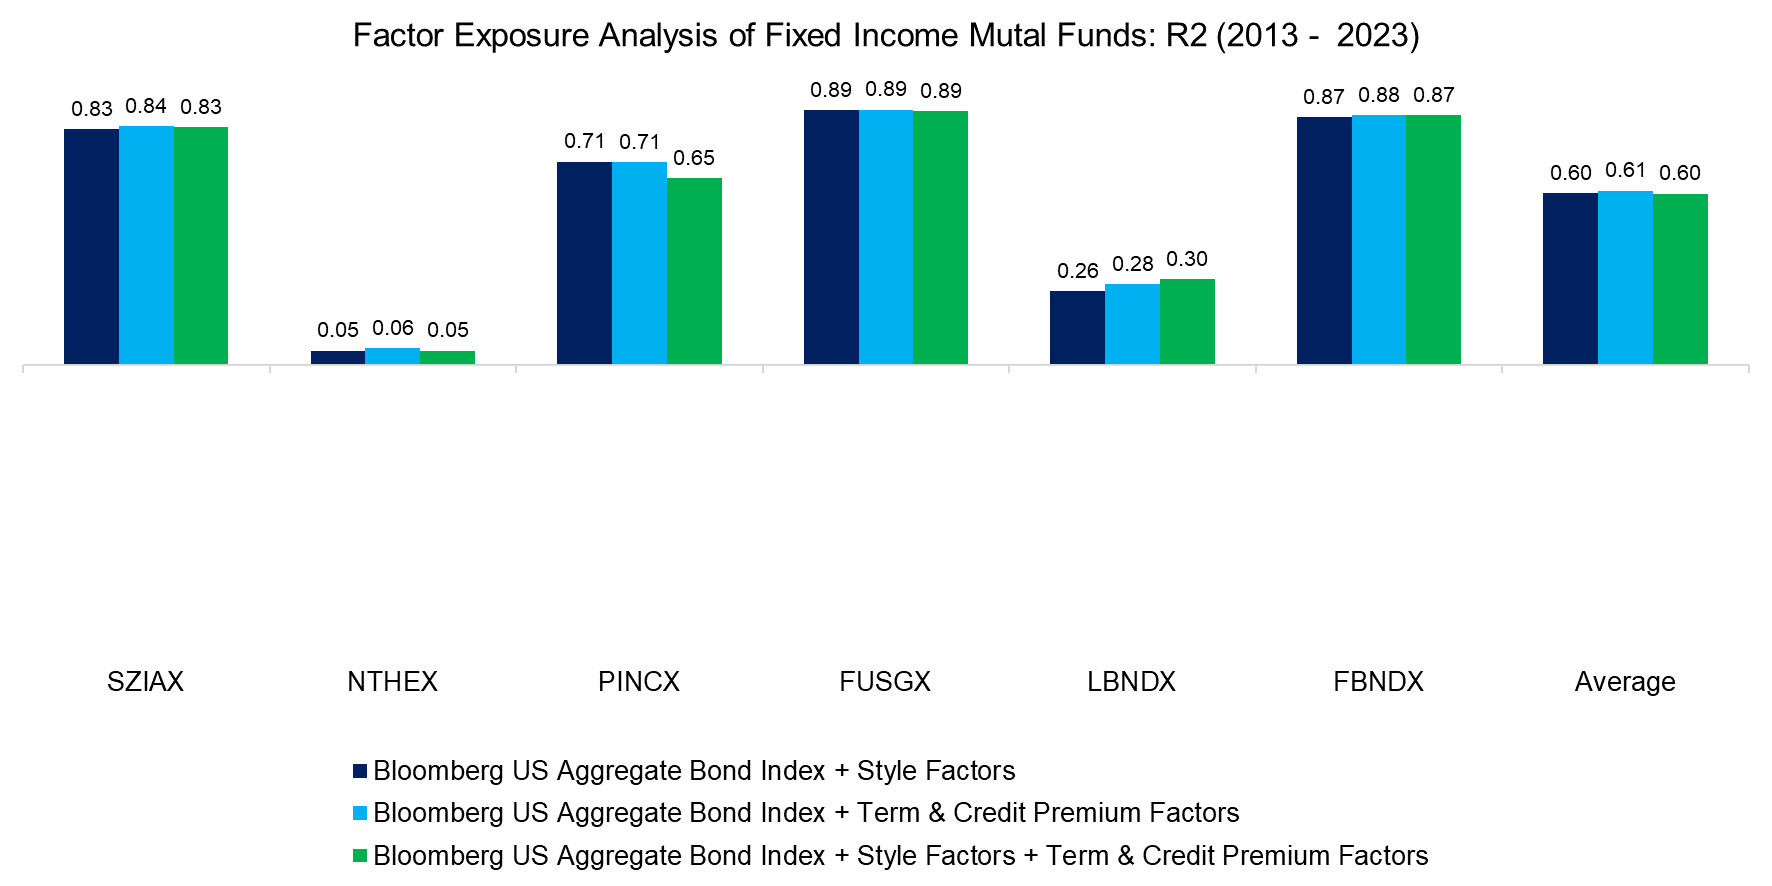
Following, we run a factor exposure analysis on six US bond mutual funds to see which factor data set will result in the achieving highest R2. We include the Bloomberg US Aggregate Bond Index for market beta exposure and observe that the R2 was almost identical when using the style, traditional fixed income, or all factors.
The R2 for some funds like the Northeast Investors Trust (NTHEX) or the Lord Abbett Bond-Debenture Fund (LBNDX) were low, which is explained by these investing primarily in high yield rather than investment grade bonds. Neither the Bloomberg US Aggregate Bond Index nor the factors is able to explain this exposure well.

Source: Finominal
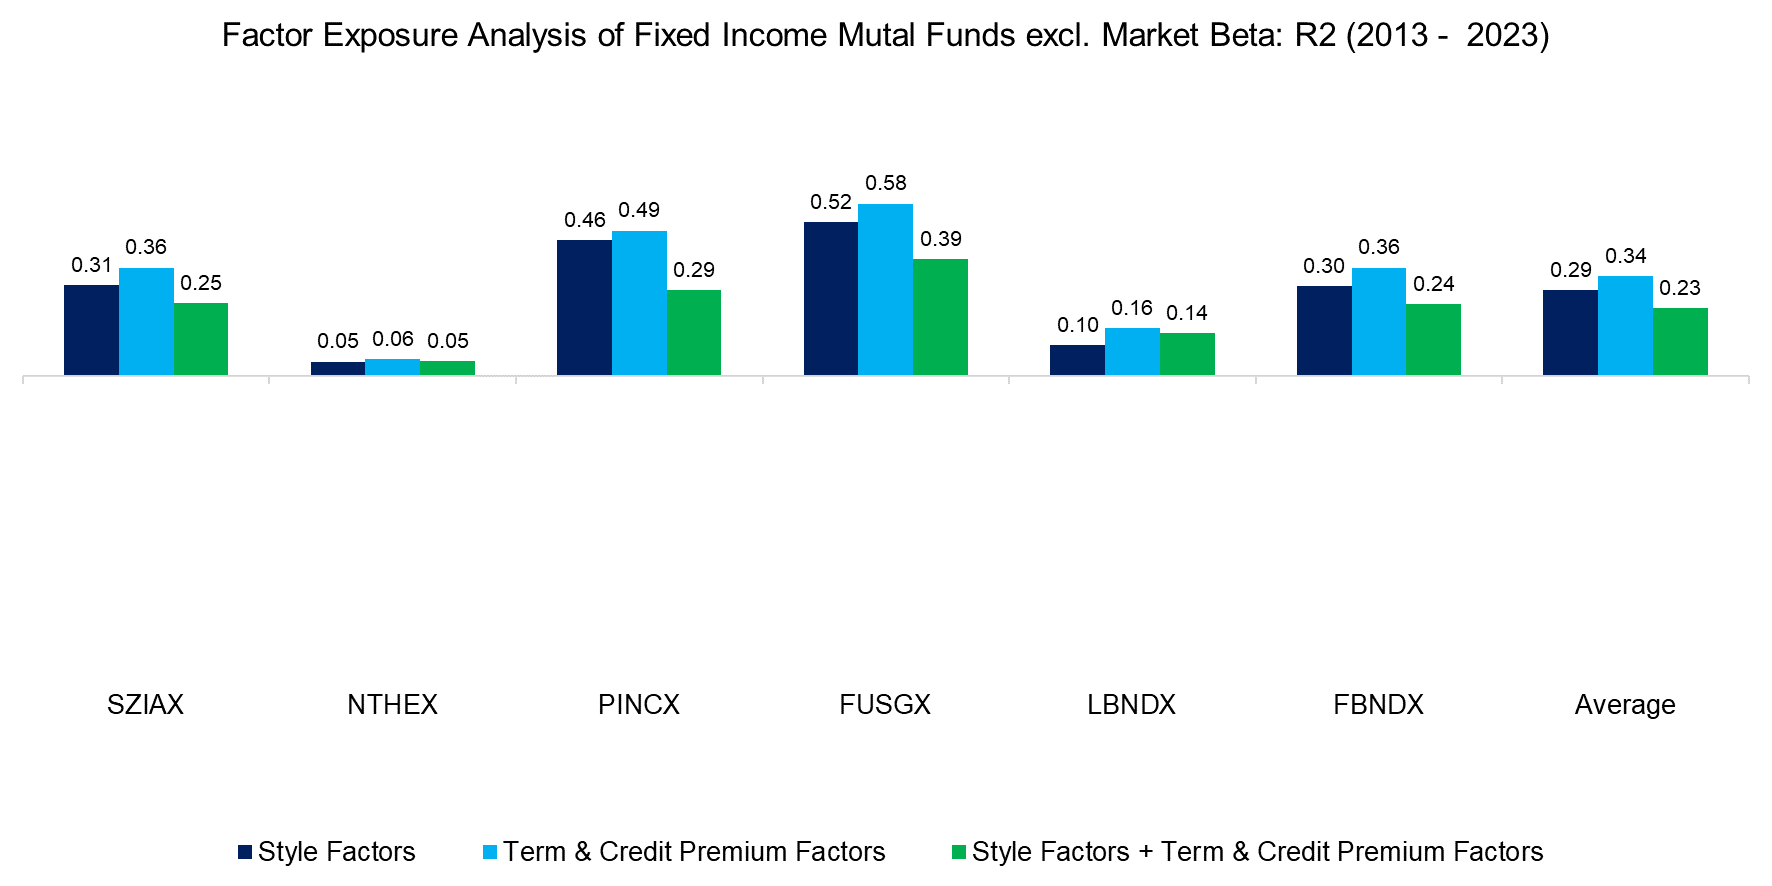
Finally, we remove the Bloomberg US Aggregate Bond Index and rerun the factor exposure analysis. Given that the market beta is removed, the average R2 decreases significantly to levels where the explanatory power of the model is poor, but that is expected given that all these fund offer long-only exposure to the bond market.
We observe that using the traditional fixed income factors results in the highest average R2, but the difference is marginal to the style factors. It is somewhat difficult to explain why using all factors generated the lowest average R2, given that the independent variables are uncorrelated.

Source: Finominal
FURTHER THOUGHTS
Factors are typically used to explain the performance of active fund managers. Most investors are searching for alpha or unexplained returns, but almost all are getting different factor exposures. In some years this enables fund managers to outperform, in others to underperform.
However, this analysis does not provide much clarity on whether fixed income investors should be using style, traditional fixed income factors, or a combination thereof. This factor complexity likely contributes to the low amount of assets under management in smart beta fixed income ETFs, which is a mere $20 billion and a fraction of the AUM of smart beta equity ETFs, where the Vanguard Value Index Fund ETF (VTV) alone manages $100 billion (read Smart Beta Fixed Income ETFs).
RELATED RESEARCH
Factor Exposure Analysis 107: Fixed Income Factors
Factor Exposure Analysis 106: Macro Variables
Factor Exposure Analysis 105: Sectors versus Factors
Factor Exposure Analysis 104: Fixed Income ETFs
Factor Exposure Analysis 103: Exploring Residualization
Factor Exposure Analysis 102: More or Less Independent Variables?
Factor Exposure Analysis 101: Linear vs Lasso Regression
Factor Exposure Analysis 100: Holdings vs Regression-Based
Smart Beta Fixed Income ETFs
Equity vs Bond Indices
Analyzing Floating Rate ETFs
How Much Can You Lose with Bonds?
60/40 Portfolios Without Bonds
Inflation-Linked Bonds for Inflationary Periods?
Bonds & The Invisible Thief
REFERENCED RESEARCH
ABOUT THE AUTHOR
Nicolas Rabener is the CEO & Founder of Finominal, which empowers professional investors with data, technology, and research insights to improve their investment outcomes. Previously he created Jackdaw Capital, an award-winning quantitative hedge fund. Before that Nicolas worked at GIC and Citigroup in London and New York. Nicolas holds a Master of Finance from HHL Leipzig Graduate School of Management, is a CAIA charter holder, and enjoys endurance sports (Ironman & 100km Ultramarathon).
Connect with me on LinkedIn or X.

