
Multi-Factor Investing: Sequential Model
Does the factor sequence matter?
September 2026. Reading Time: 10 Minutes. Author: Nicolas Rabener.
SUMMARY
- The sequential model allows investors to select stocks that fulfill all criteria
- Performance and fundamentals of different sequences were comparable
- The sequence of factors matters less than expected
INTRODUCTION
In our recent article Multi-Factor Investing: Intersectional vs Combination Models, we contrasted these two approaches to combining factors. However, a third approach exists: sequential models. This methodology addresses a key weakness of intersectional and combination models: they may select stocks with undesirable features. For example, when the intersectional model selects stocks based on momentum, value, and quality, some stocks can end up with expensive valuations if they have sufficiently high scores on momentum and quality. The same applies to the combination model, which includes expensive stocks from the momentum and quality portfolios.
The sequential model avoids this because it selects stocks through multiple filters applied in sequence. In the example above, the resulting stocks would be cheap, have outperformed, and show high-quality characteristics. A frequent question is whether the factor sequence matters, which we explore in this article.
SEQUENTIAL MULTI-FACTOR INVESTING
We will create multi-factor portfolios using value, momentum, and quality factors. We measure value via cash flow multiples, momentum via the 12-month lookback excluding the most recent month, and quality via return-on-equity. We consider all stocks trading in the U.S. with a market capitalization above $1 billion as the investable universe, which is approximately 2000 stocks. We sort this universe by the first factor and select the top 30% of stocks, then select the top 30% of the filtered universe by the second factor, and finally conduct the same operation with the third factor. This results in a concentrated portfolio of roughly 50 stocks, weighted by market capitalization.
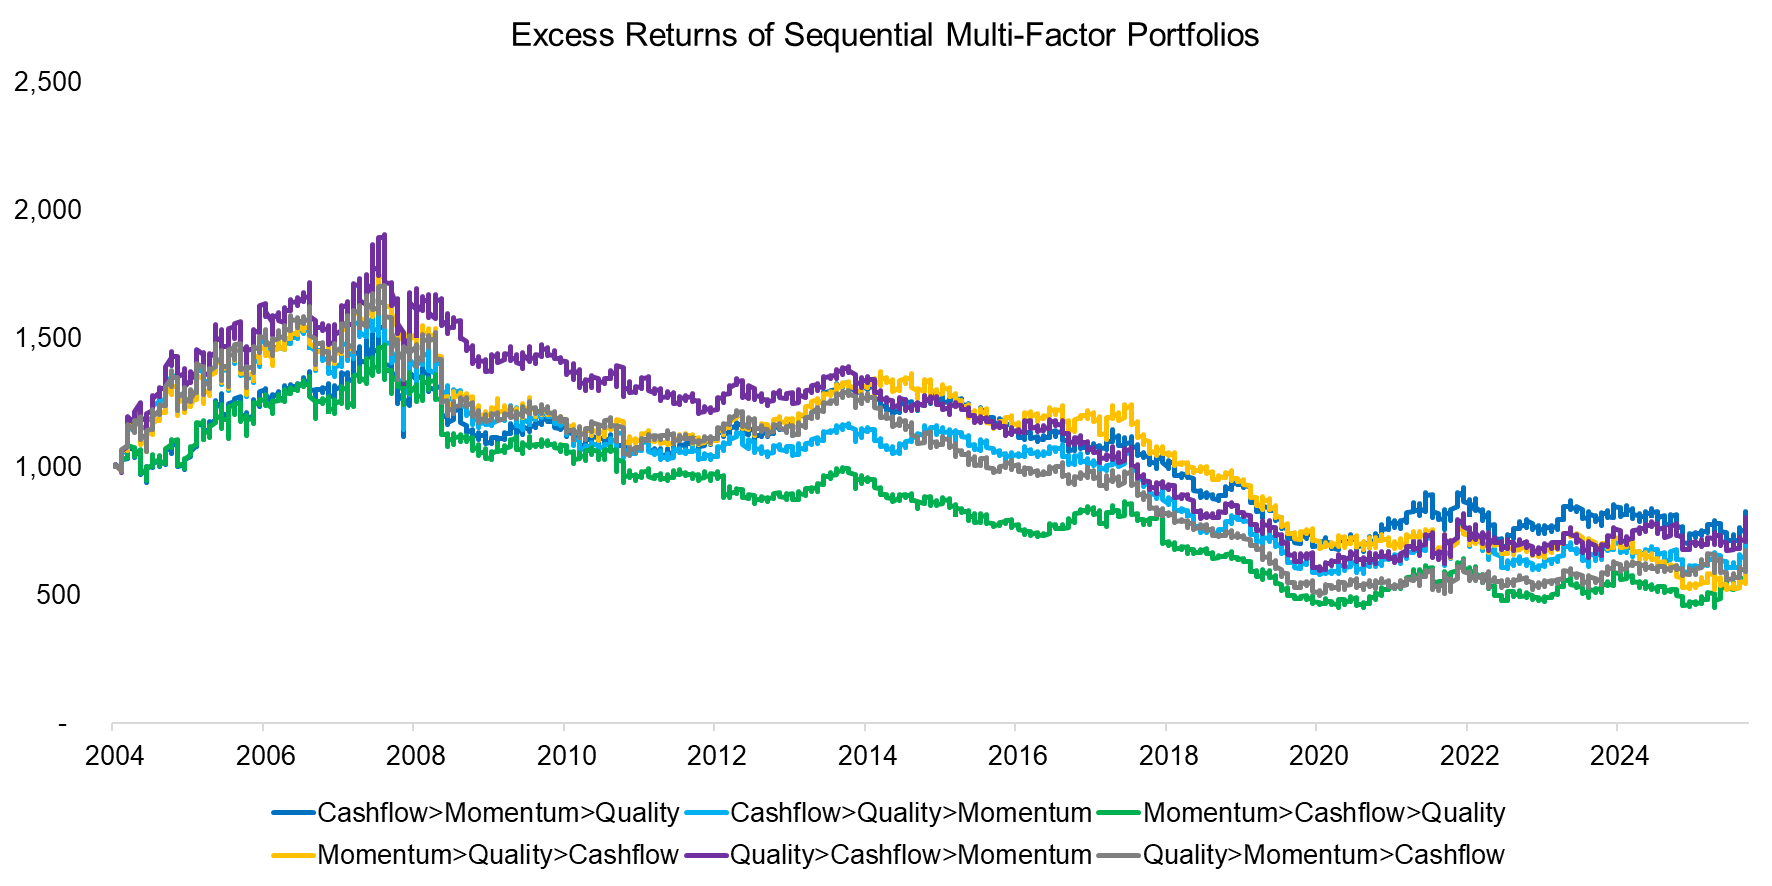
The sequential model offers six portfolios with three factors, one for each possible ordering. We compute excess returns relative to the U.S. stock market, which highlights a brief period of outperformance from 2004 to 2008, followed by consistent underperformance.
Source: Finominal
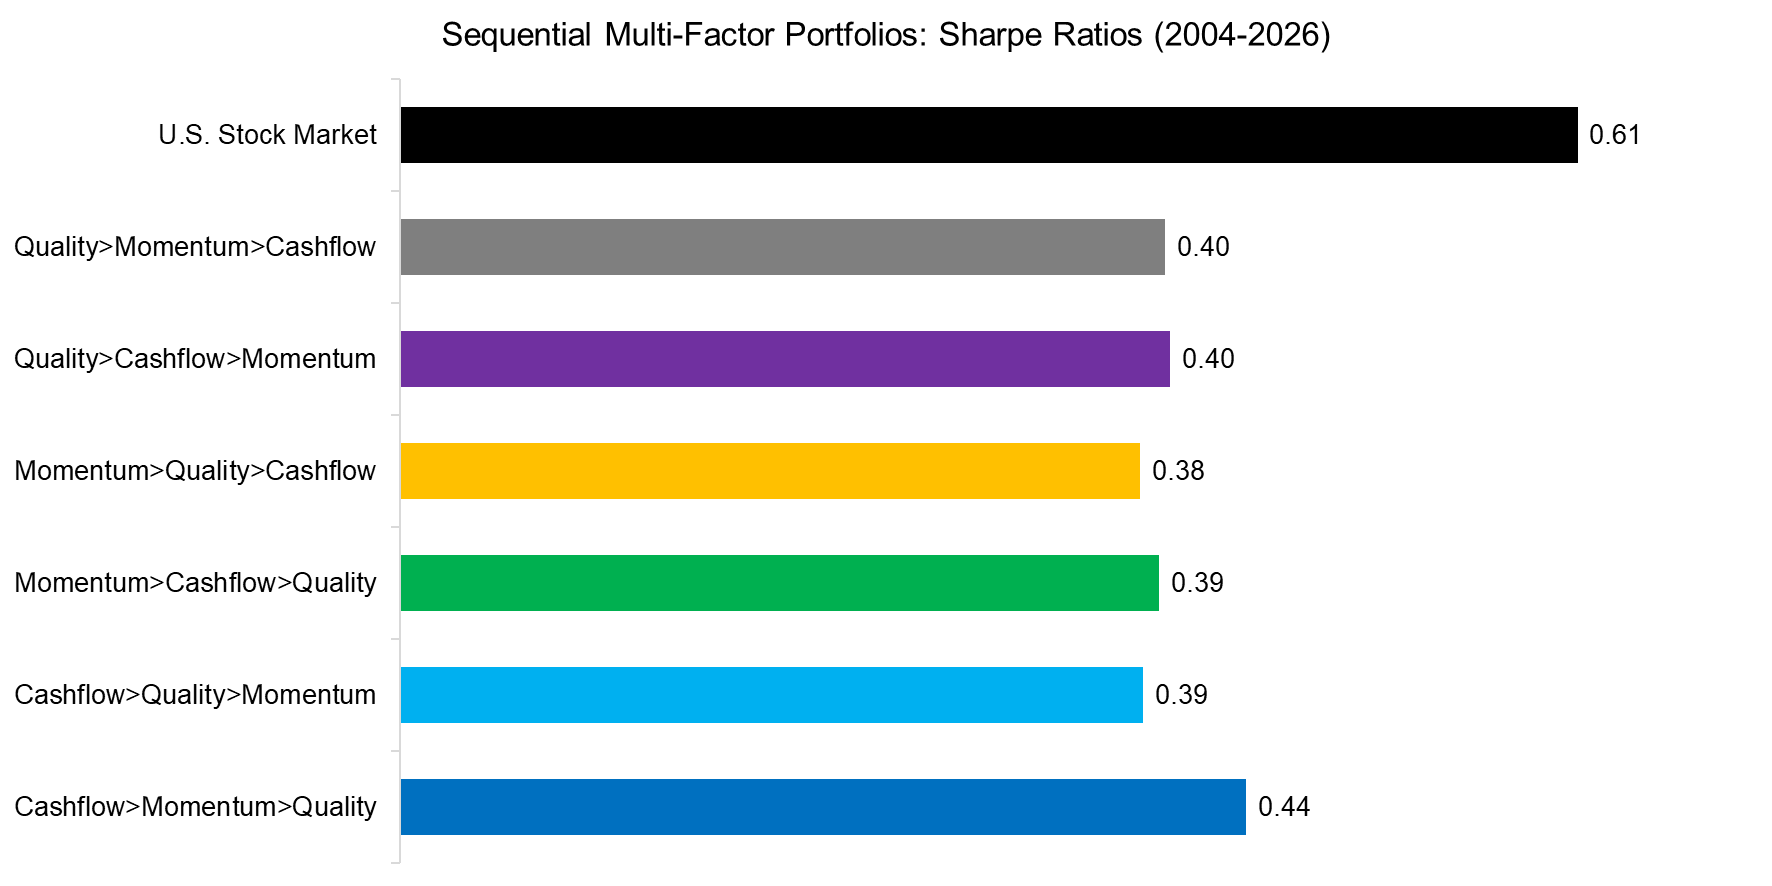
We compute the Sharpe ratios, which highlight that all six portfolios generated significantly lower risk-adjusted returns than the stock market. More interestingly, the six portfolios showed little differentiation, with Sharpe ratios ranging from 0.38 to 0.44, compared with 0.61 for the U.S. stock market.
Source: Finominal
FUNDAMENTAL ANALYSIS
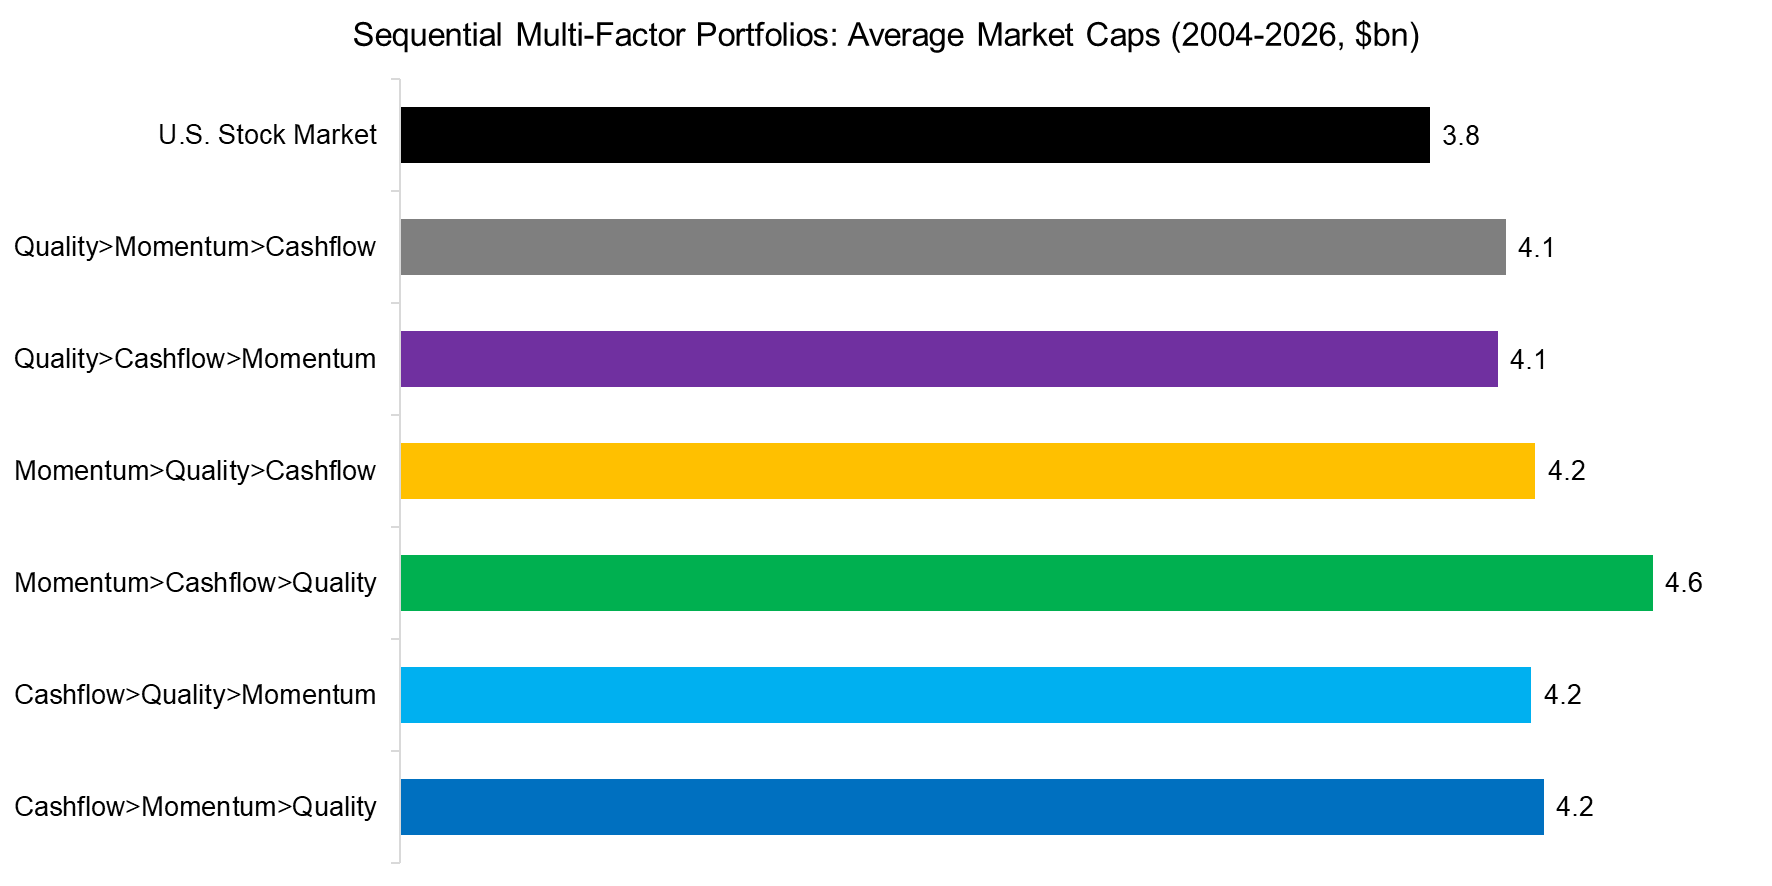
Next, we analyze the average of the daily median market cap of the sequential portfolios, which shows a narrow range of $4.1 to $4.6bn, compared with $3.8bn for the stock market. Again, there is not much differentiation between these portfolios.
Source: Finominal
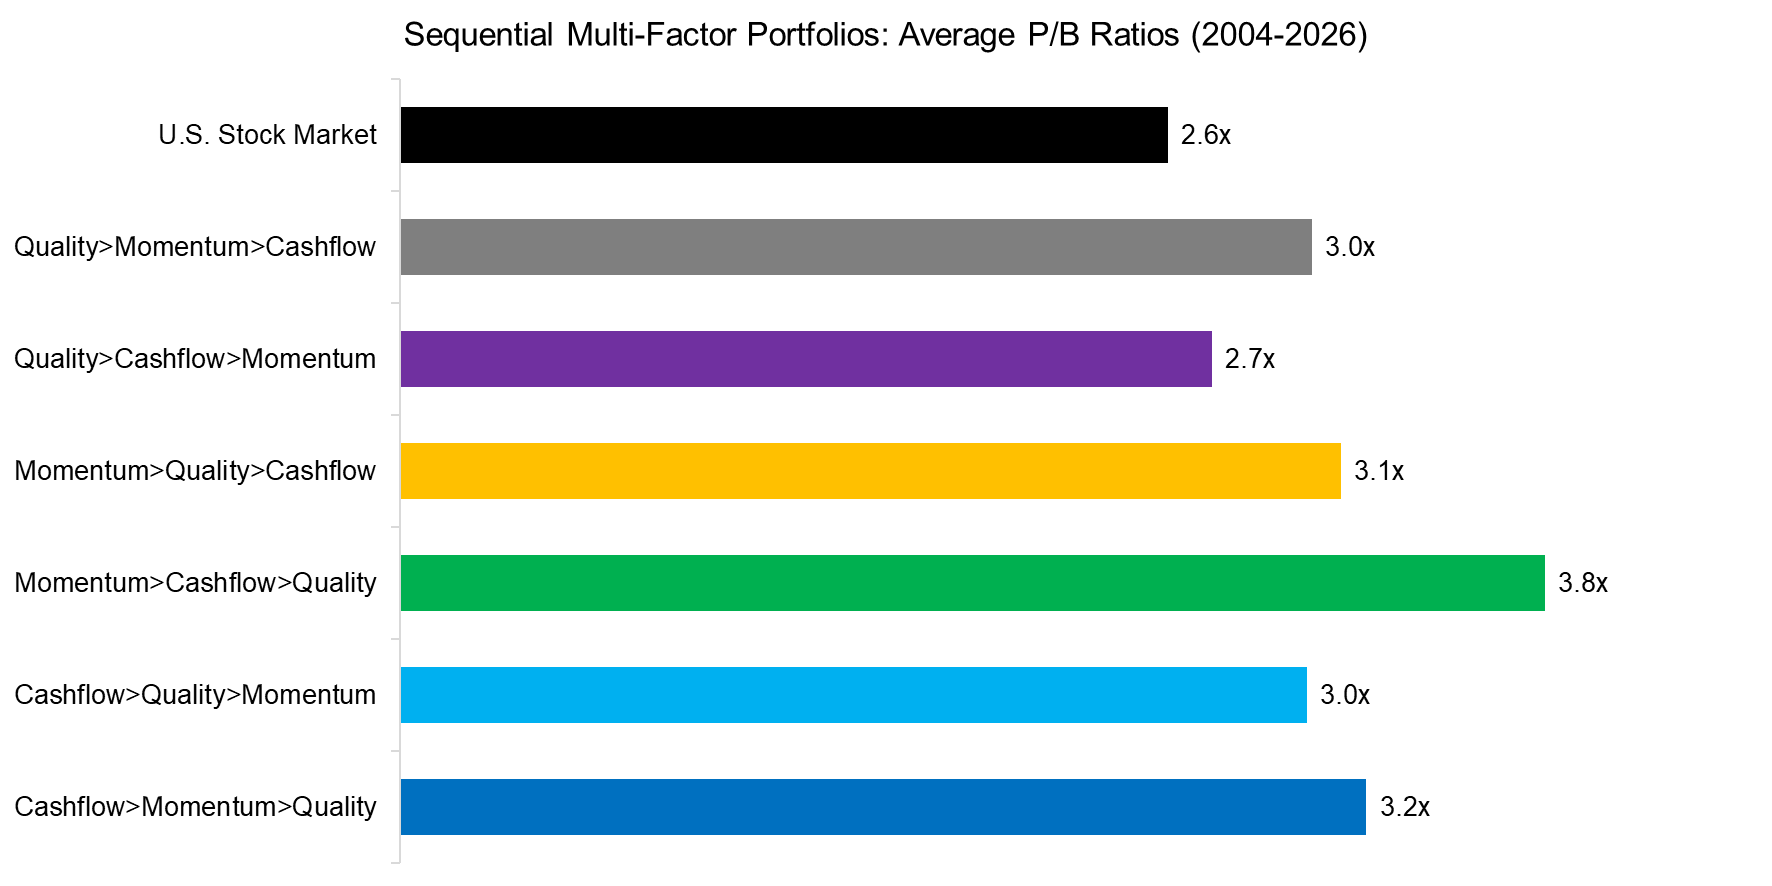
An analysis of the average of the daily median price-to-book ratios also shows a relatively narrow range of 2.7x to 3.8x, compared with 2.6x for the market.
Source: Finominal
Finally, we compute sector over- and underweights relative to the stock market. The analysis highlights significant underweights in technology, real estate, non-cyclical, healthcare, and financial stocks, and overweights in materials, energy, and cyclical stocks. However, these over- and underweights were consistent across all six portfolios.
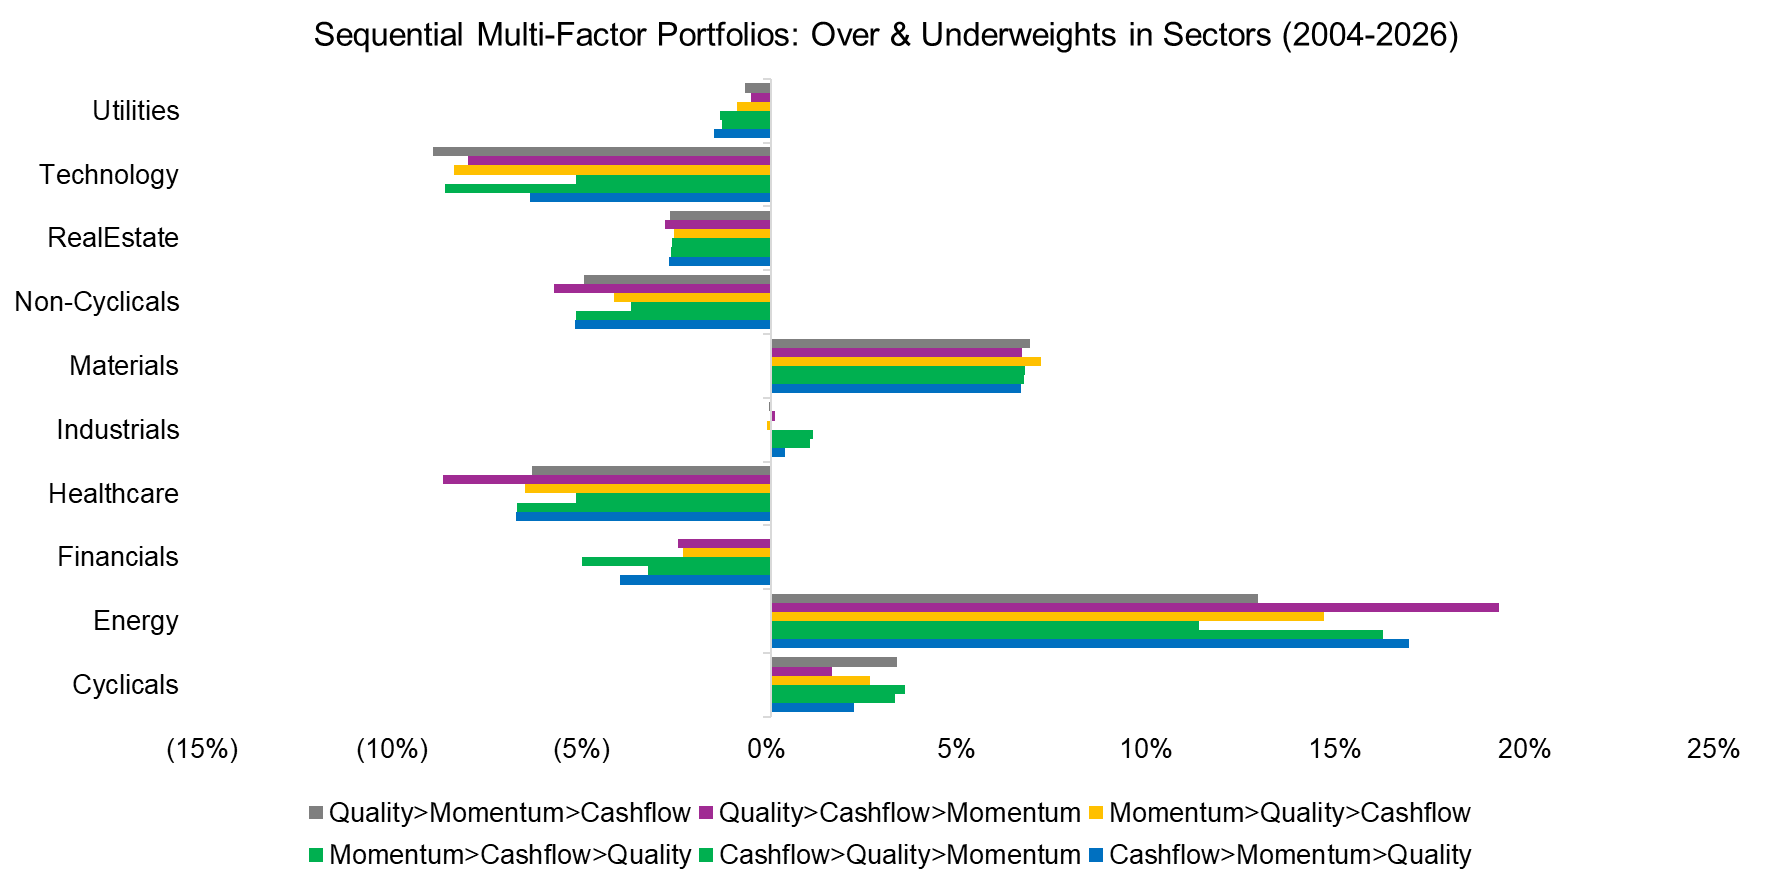
Source: Finominal
FURTHER THOUGHTS
Intuitively, there is a significant difference between starting with cheap stocks, then sorting by outperformance and quality, and starting with outperforming stocks, then sorting by valuations and quality. However, as this analysis shows, the sequence of factors had very little impact on the performance or composition of the portfolios.
Unfortunately, this also shows how difficult it is for fund managers to create value, as none of these portfolios was differentiated. They all underperformed the market. Yet the analysis also suggests that all these portfolios had the same performance drivers, which, if identified correctly, provides an opportunity to create value for investors.
RELATED RESEARCH
Multi-Factor Investing: Intersectional vs Combination Models
Intersectional vs Sequential Multi-Factor Models
Long-Short vs Long-Only Factor Investing
Timing Luck in Factor Investing
Market-Neutral versus Smart Beta Factor Investing
Multi-Factor Models 101
Intersectional Model: Sorting 7 Factors
Sequential Model: Sorting by 5 Factors
Integrated Value, Growth & Quality Portfolios
Factor Investing Is Dead, Long Live Factor Investing!
Smart Beta vs Alpha + Beta
How Painful Can Factor Investing Get?
Factor Exposure Analysis 114: Factor Offsetting
Smart Beta ETF vs Customized Factor Portfolios
Multi-Factor Smart Beta ETFs
Factor Optimization via ETFs
Improving Smart Beta Attribution Analysis II
ABOUT THE AUTHOR
Nicolas Rabener is the CEO & Founder of Finominal, which empowers professional investors with data, technology, and research insights to improve their investment outcomes. Previously he created Jackdaw Capital, an award-winning quantitative hedge fund. Before that Nicolas worked at GIC and Citigroup in London and New York. Nicolas holds a Master of Finance from HHL Leipzig Graduate School of Management, is a CAIA charter holder, and enjoys endurance sports (Ironman & 100km Ultramarathon).
Connect with me on LinkedIn or X.