A Crescendo in Private Credit?
Returns that seem too good to be true
SUMMARY
- The AUM in private credit funds is expected to double to $2.7 trillion
- However, the performance of the industry’s benchmark index can be challenged
- The returns of private credit funds seem smoothened compared to public funds
INTRODUCTION
Some asset classes are currently more sexy than others. Most real estate assets have not recovered from the COVID-19 crisis and are now being hit by rising interest rates. Same for venture capital, where valuations crashed in 2022. Private equity is still popular with investors, primarily as these funds have not started marking down the value of their investments aggressively, hoping for these to recover and everything to smoothen out (read Private Equity: Fooling Some People All the Time?).
However, the current star amongst asset classes is private credit, where the assets under management are expected to rise from $1.2 trillion in 2021 to a whopping $2.7 trillion in 2026, according to the 2022 Preqin Global Private Debt Report, which would make it the second largest private asset class after private equity.
What are private debt funds? These funds primarily lend money to mid-sized companies with risky profiles that are typically private equity-backed businesses. These loans feature higher interest rates than bank loans or bonds and usually mature in three to five years. Default rates have been low and it is all about creating diversified portfolios of loans to minimize idiosyncratic risks.
In this research note, we will review the performance of private credit funds.
PERFORMANCE
We will be using the Cliffwater Direct Lending Index (CDLI), which is the primary benchmark for evaluating the performance of private debt funds. CDLI is an asset-weighted index comprised of more than 13,000 loans valued at close to $300 billion.
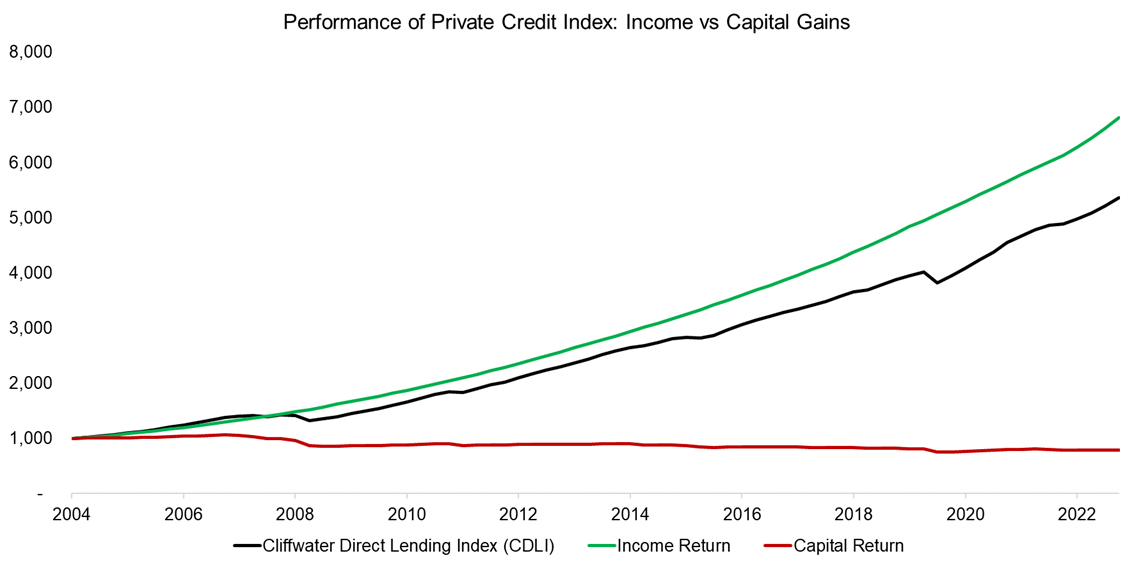
The index was launched in 2004 and its performance can be differentiated between returns from income versus capital. It seems that some loans have defaulted as less capital was returned than loaned out, resulting in a loss of 1.3% per annum on the return of capital. However, the income generated was 10.8% per annum and easily compensated for the loan impairments, which resulted in an attractive total return of 9.4% per annum over the 20-year period.
Source: Finominal
PRIVATE DEBT VERSUS PUBLIC MARKETS
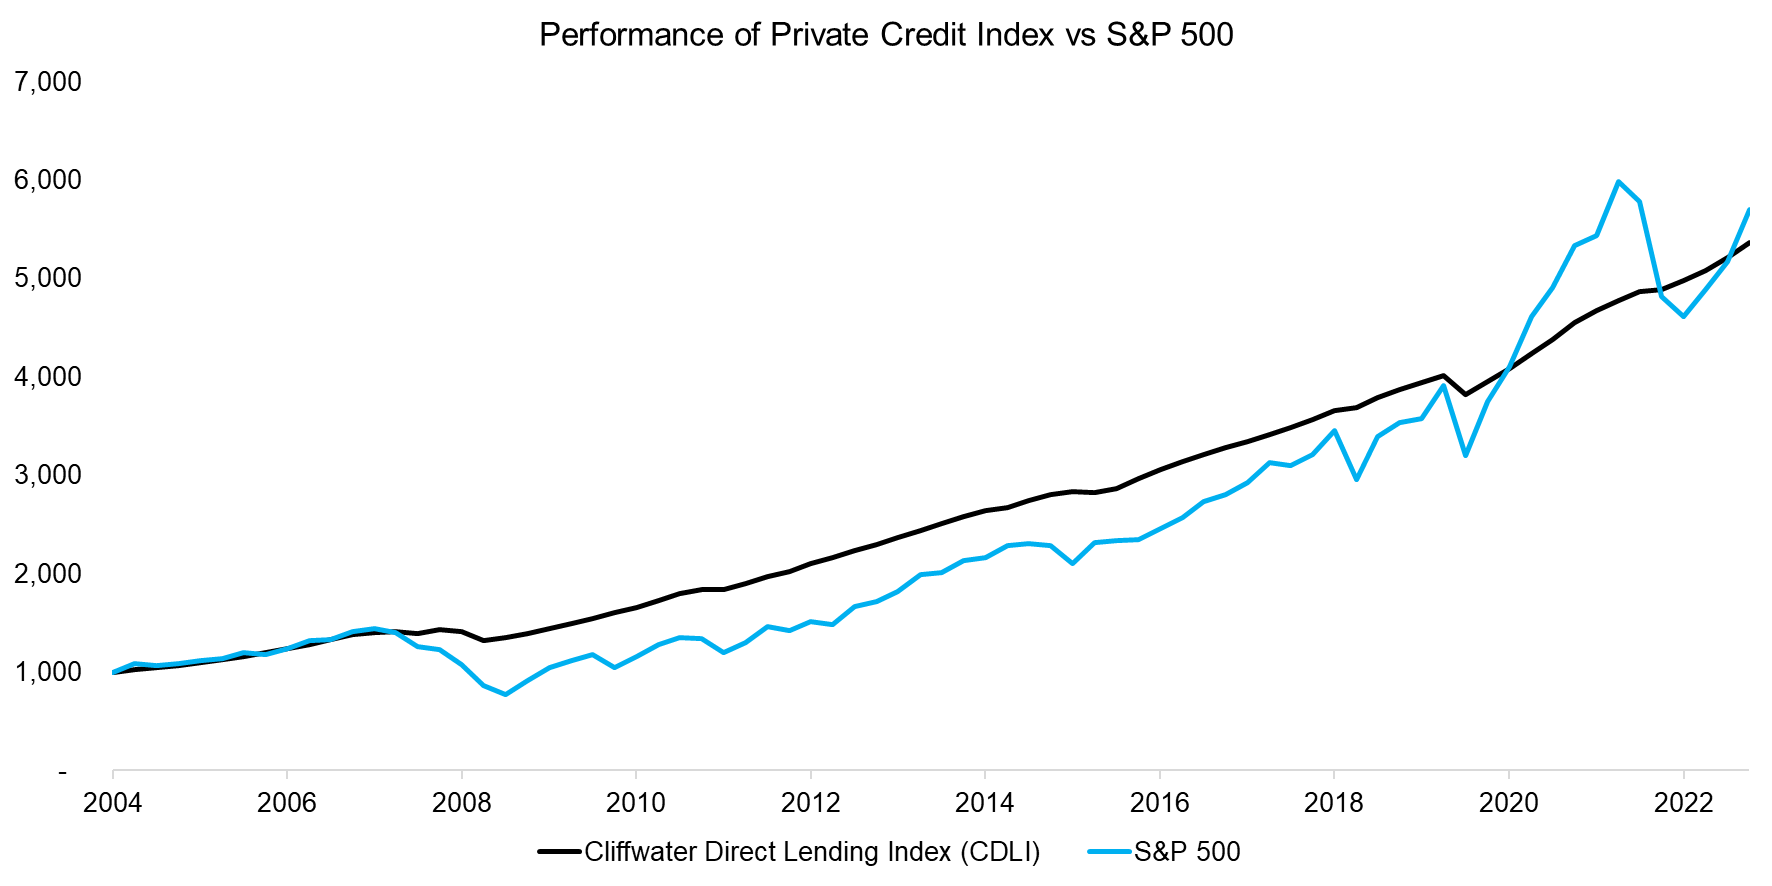
In order to evaluate the performance of private debt funds, we contrast the returns to those of the S&P 500. We notice that both have achieved almost the same return over the 20-year period, although private debt funds exhibited a fraction of the stock market’s volatility.
Although investors are continuously searching for strategies or asset classes with high Sharpe ratios, there are almost none that offer this over extended periods. For example, the S&P 500 exhibited a Sharpe ratio of 0.6 between 2004 and 2023, which is slightly above its long-term average. If equities are combined with bonds and other diversifying strategies, then Sharpe ratios of close to 1 are achievable. In contrast, CDLI exhibits a Sharpe ratio of 2.7 for the same period, which is abnormally high.
Source: Finominal
PRIVATE DEBT VERSUS THE US ECONOMY
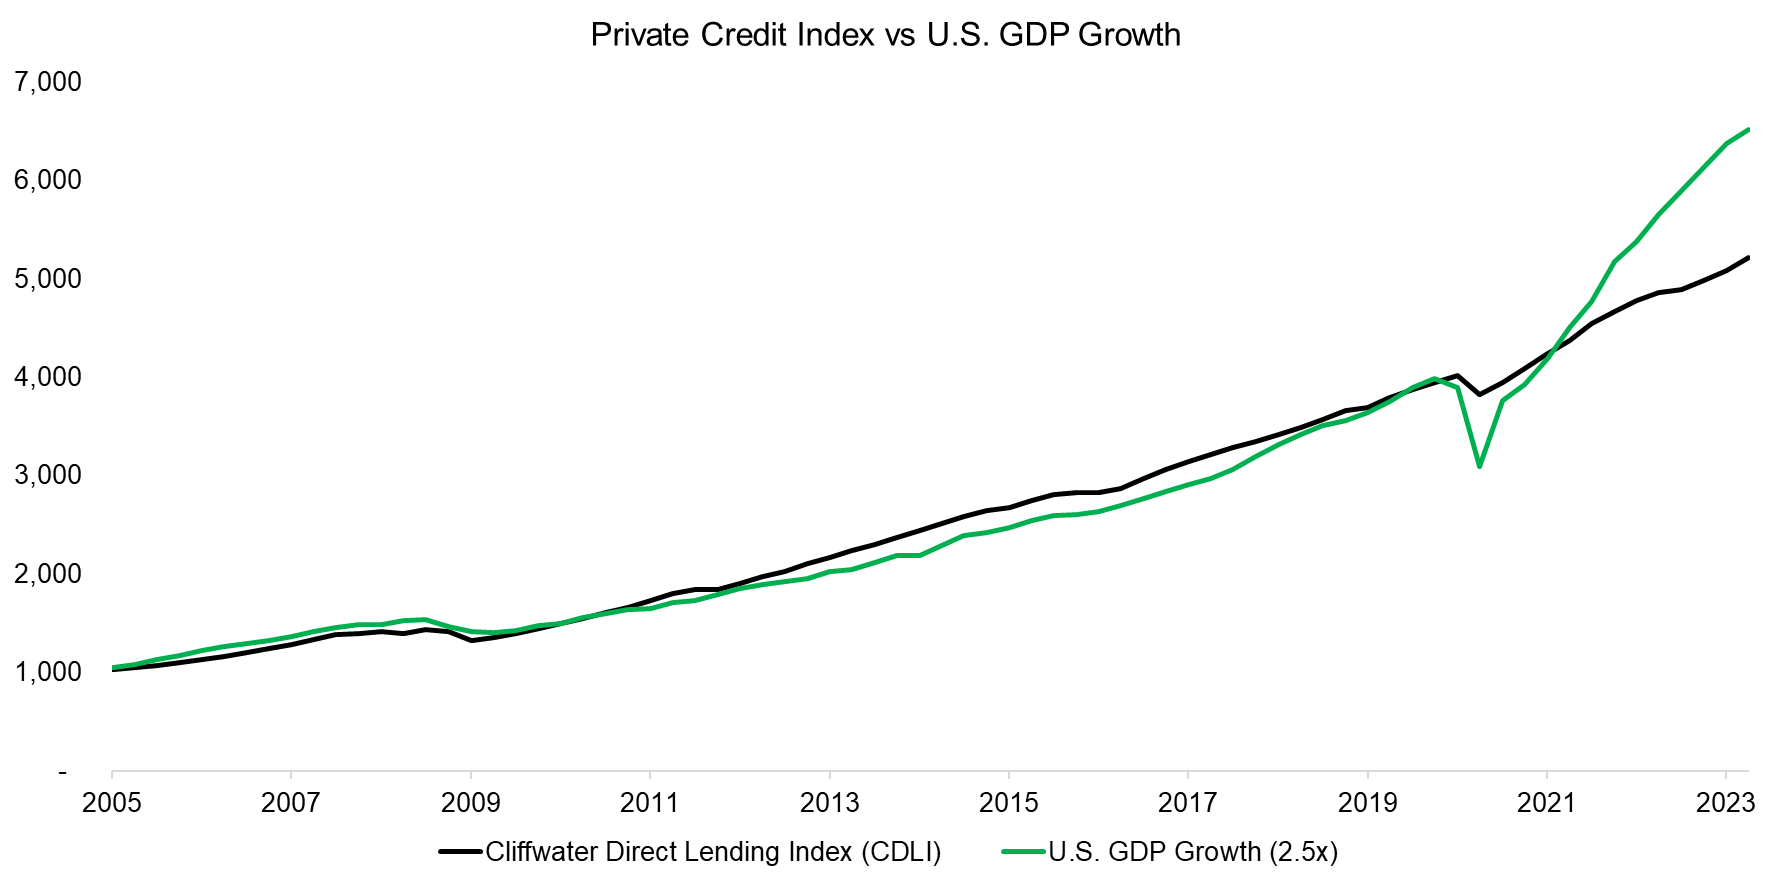
Although private debt funds feature high risk-adjusted returns, the asset class does not seem to be totally uncorrelated to the U.S. stock market as the index declined in recessions like the global financial crisis in 2008 and the COVID-19 crisis in 2020. Naturally, this makes sense as the default rate increases during economic downturns and decreases during growth periods.
The S&P 500 is a proxy for U.S. GDP growth, and the same applies to private debt. The performance of CDLI mirrored a leveraged version of U.S. GDP growth, except for the last two years.
Source: Finominal
PRIVATE CREDIT FUNDS
Next, we select the Blackstone Private Credit Fund (BCRED) to contrast the performance of an actual product versus the index. BCRED is managed by Blackstone, which is the largest private credit manager with $295 billion of assets under management in this asset class.
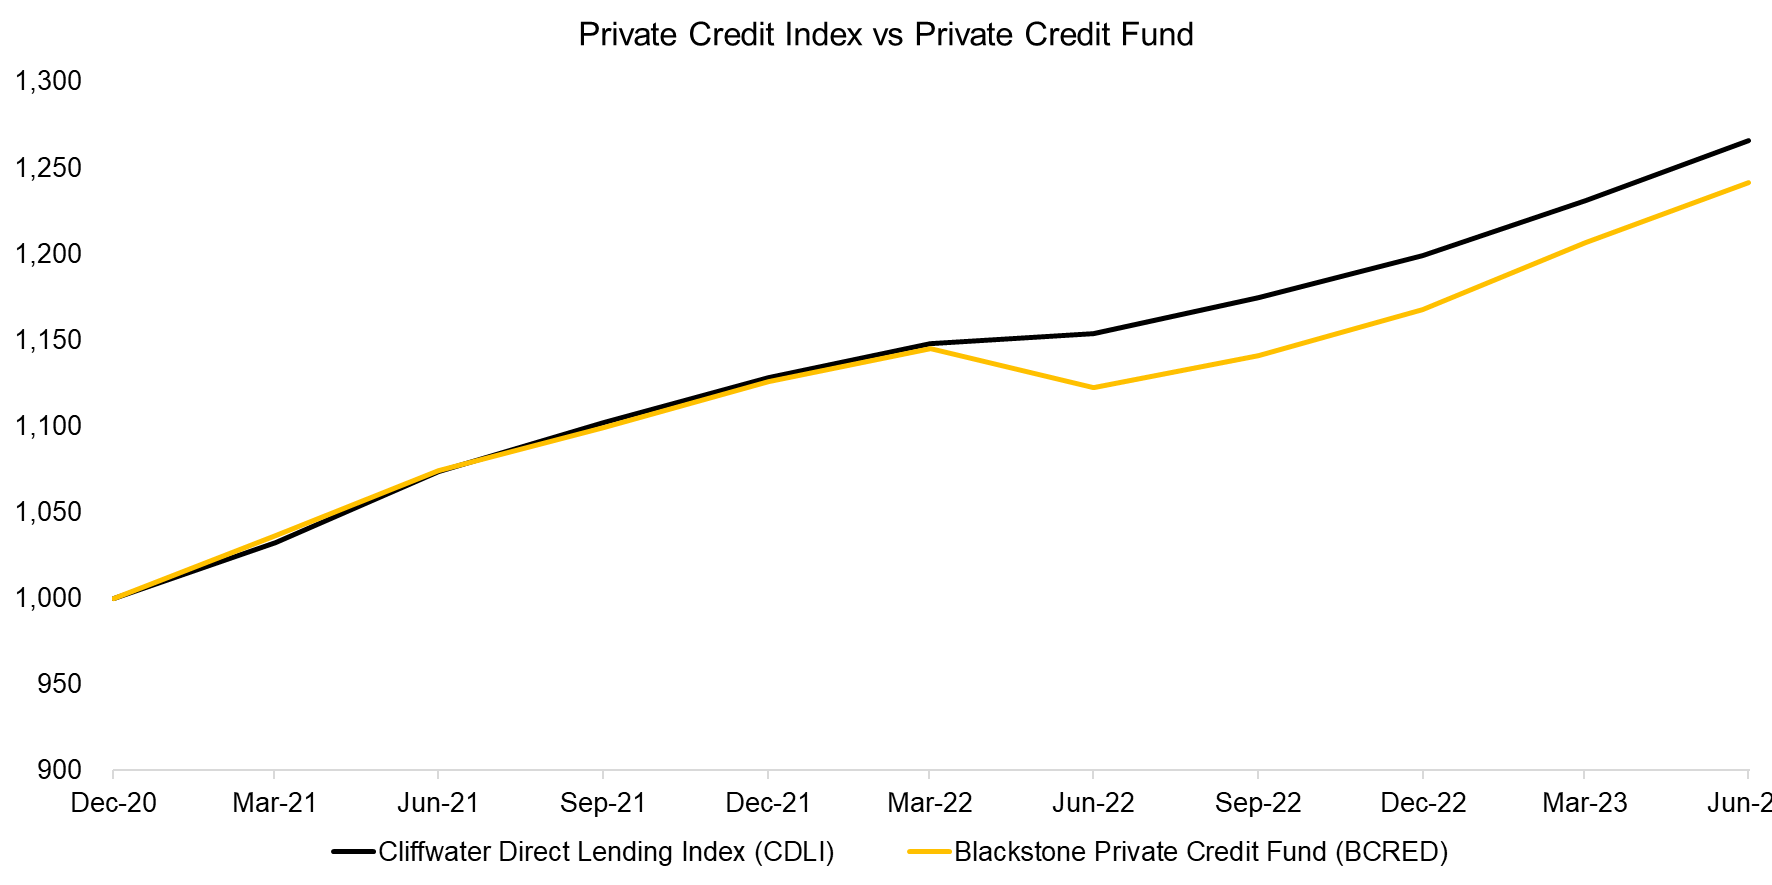
The fund only has a three-year track record, but the total return was almost identical to that of CDLI for that period. However, we notice that the index was basically unaffected by the decline of stocks and bonds in 2022, while BCRED features a minor drawdown. The fund has a diversified portfolio comprised of 503 positions valued at $50 billion that represent almost exclusively secured debt, so can almost be viewed as an index for private debt. Given this, the lack of volatility in CDLI is unusual.
Source: Finominal
PRIVATE VERSUS PUBLIC CREDIT FUNDS
Private asset fund managers tend to smoothen the valuations of their assets as it makes them look more attractive and even uncorrelated to public markets. This works great when stocks crash and quickly recover. However, when the economy is heading into a recession, then private market valuations will eventually have to be reduced as well.
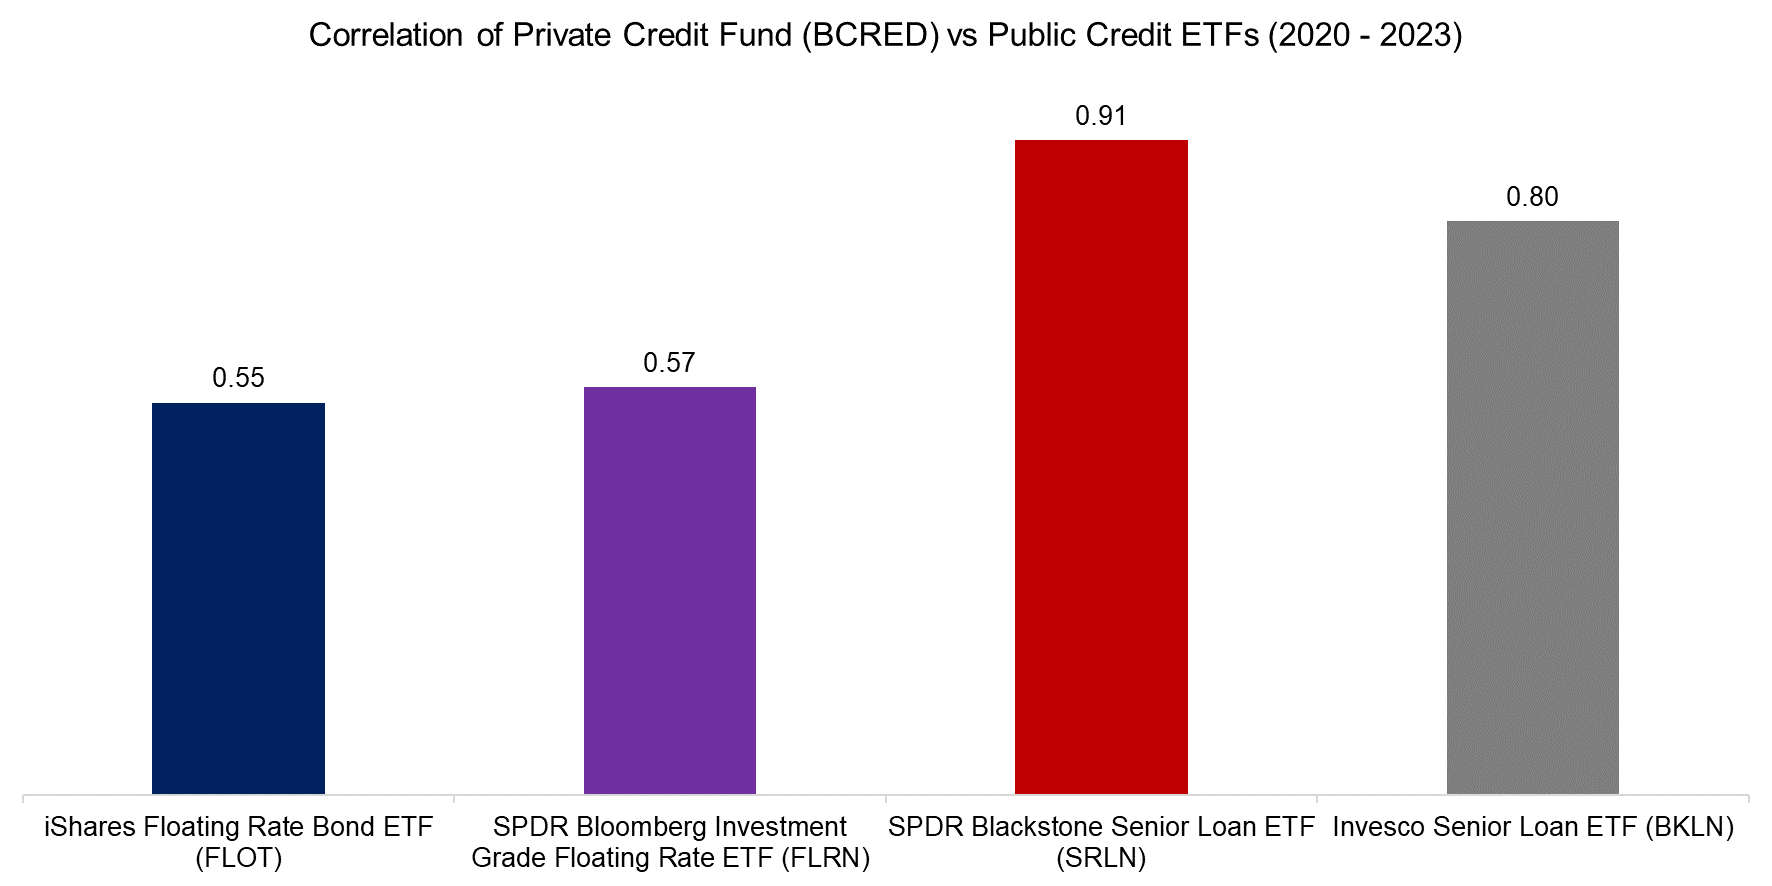
We can demonstrate this valuation smoothing by comparing the performance of private versus public credit funds. There are four credit-focused ETFs trading in the U.S. that exhibit correlations between 0.55 to 0.91 to BCRED (read Analyzing Floating Rate ETFs).
Source: Finominal
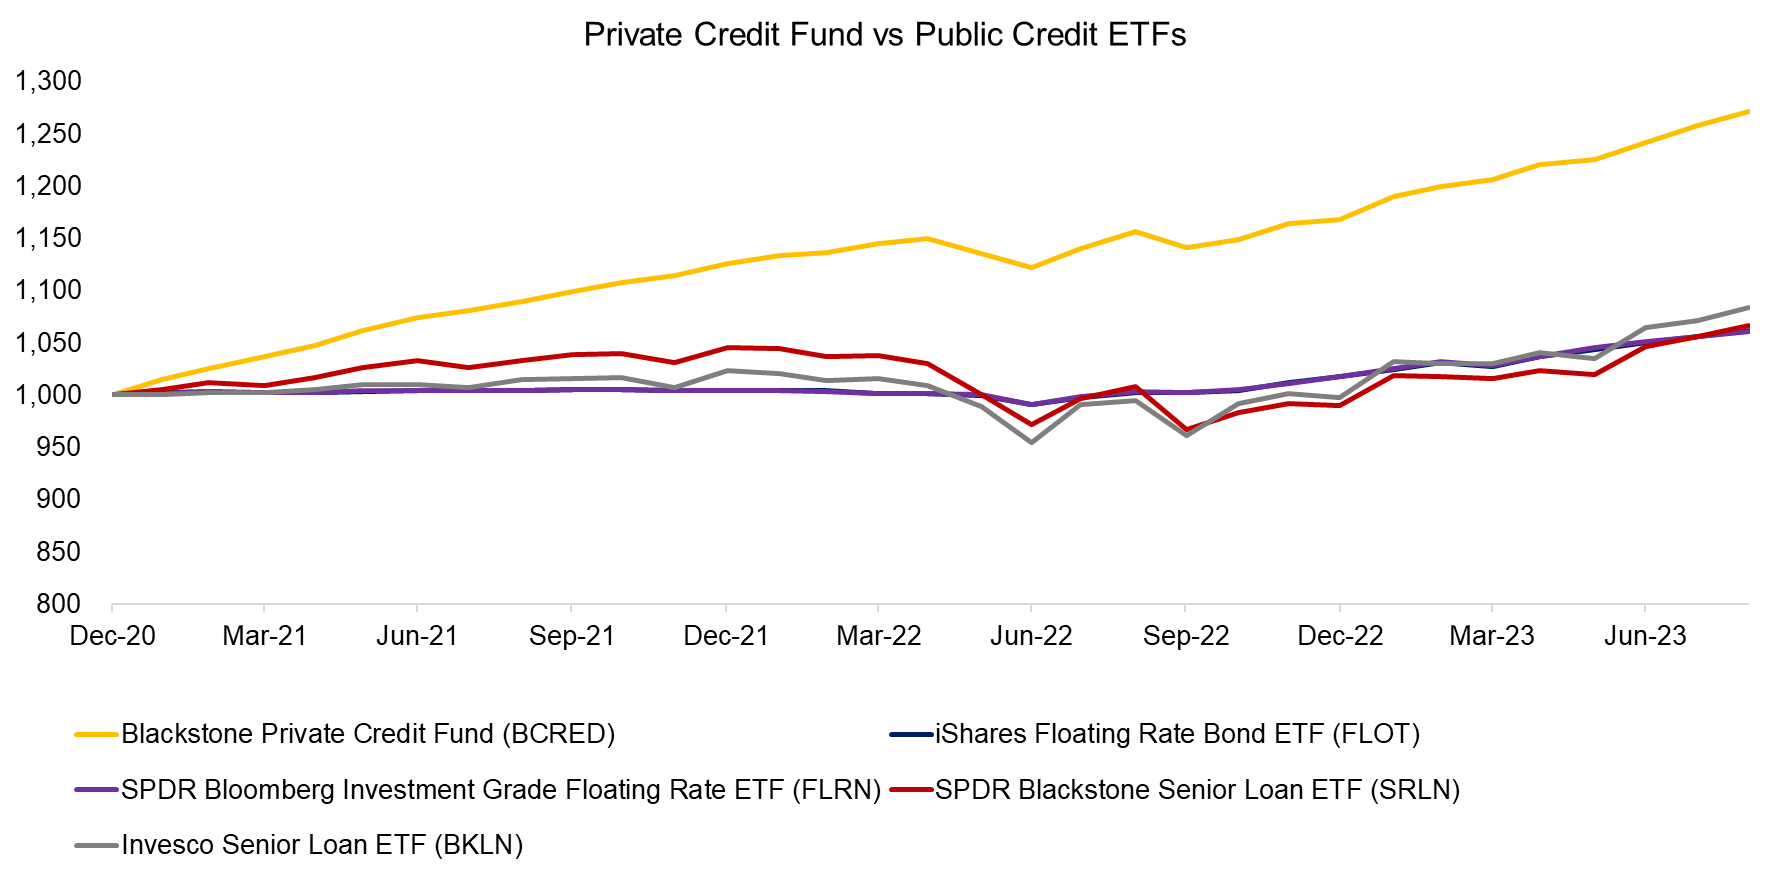
Despite the credit ETFs being moderately to highly correlated to the private credit fund, their returns were significantly worse. Most unusual is that one of the ETFs, namely the SPDR Blackstone Senior Loan ETF (SRLN), is managed by the same asset manager as BCRED. SRLN holds approximately 450 senior loans with an average 4.6 years of maturity sourced by Blackstone, so represents a diversified portfolio not unlike BCRED.
It is difficult to explain BCRED’s outperformance through the short bear and bull markets since 2020, except via valuations that ignore capital markets and the economy. Stated differently, these valuations have been smoothened to delight (and fool) investors.
Source: Finominal
FURTHER THOUGHTS
What have we learned about private debt so far?
- The benchmark index for the private credit asset class, namely the Cliffwater Direct Lending Index (CDLI), has generated an abnormally high Sharpe ratio of 2.7 since its inception in 2004.
- A broadly diversified $50 billion private credit fund, namely the Blackstone Private Credit Fund (BCRED), was more volatile than CDLI over the last three years.
- Public credit ETFs performed significantly worse than BCRED, and CDLI.
Considering these points it seems that the benchmark index simply lacks the marking to market of loans, which implies that returns are over- and risks understated. Similarly, the private credit fund exhibits the return smoothing that is typical for private asset classes.
When it comes to investing, if something looks too good to be true then it usually isn’t, and it is better to be safe than sorry (read Don’t Convert to Convertible Bonds and BDCs: Better Don’t Choose?).
RELATED RESEARCH
Private Equity: Fooling Some People All the Time?
Myth Busting: Alts’ Uncorrelated Returns Diversify Portfolios
Don’t Convert to Convertible Bonds
BDCs: Better Don’t Choose?
Covered Call Strategies Uncovered
Preferential Times for Preferred Income Strategies?
Analyzing Floating Rate ETFs
The Case Against REITs
The Case Against Equity Income Funds
Resist the Siren Call of High Dividend Yields
Dividend Yield Combinations
Building Better High Yield Portfolios
ABOUT THE AUTHOR
Nicolas Rabener is the CEO & Founder of Finominal, which empowers professional investors with data, technology, and research insights to improve their investment outcomes. Previously he created Jackdaw Capital, an award-winning quantitative hedge fund. Before that Nicolas worked at GIC and Citigroup in London and New York. Nicolas holds a Master of Finance from HHL Leipzig Graduate School of Management, is a CAIA charter holder, and enjoys endurance sports (Ironman & 100km Ultramarathon).
Connect with me on LinkedIn or X.

