Alpha Momentum
Improving the Momentum Factor
May 2018. Reading Time: 10 Minutes. Author: Nicolas Rabener.
SUMMARY
- Stocks can be ranked by alpha instead of stock returns
- Alpha Momentum generates a higher and more consistent performance than Price Momentum
- Momentum crashes are reduced significantly and risk-return ratios increase
INTRODUCTION
Alpha in finance is shrinking continuously as investors are getting better at analysing returns. When a fund manager beat his benchmark 30 years ago, investors likely attributed this to skill. Today a large portion of the outperformance can be explained by exposure to certain factors like Value or Momentum.
The concept of analysing fund manager returns can also be applied to single stocks, which allows investors to decompose stock returns into contributions from certain factors. As with fund managers, not all stock returns can be explained as some companies intrinsically create while others destroy value. Investors can create portfolios by ranking stocks by their alpha generation, speculating that companies with high alphas will continue to generate positive unexplained returns while stocks with low alphas will continue to produce negative unexplained returns. In this short research note we will analyse Alpha Momentum, which is sometimes referred to as Idiosyncratic or Residual Momentum, and contrast the strategy with Price Momentum (read Momentum Factor: Intra vs Cross-Sector).
METHODOLOGY
We focus on the Alpha and Price Momentum factors in the US, Europe and Japan. Alpha is defined as the residual between the stock return and the sum of all factor contributions to the stock returns. The factors used to explain stock returns are the market, Value, Size, Momentum, Low Volatility, Quality, Growth and Dividend Yield. The factor contributions are derived via a regression analysis with a two-year lookback and monthly factor data. Price Momentum is based on the absolute stock performance over the last 12 months, excluding the most recent month. The Alpha and Price Momentum factors are created via a long-short beta-neutral portfolios based on the top and bottom 10% stocks in the US, Europe and Japan. Only stocks with a market capitalisation of larger than $1 billion are included. Portfolios are rebalanced monthly and each transaction incurs costs of 10 basis points.
STOCK ALPHA CASE STUDIES: AMAZON & SNAP
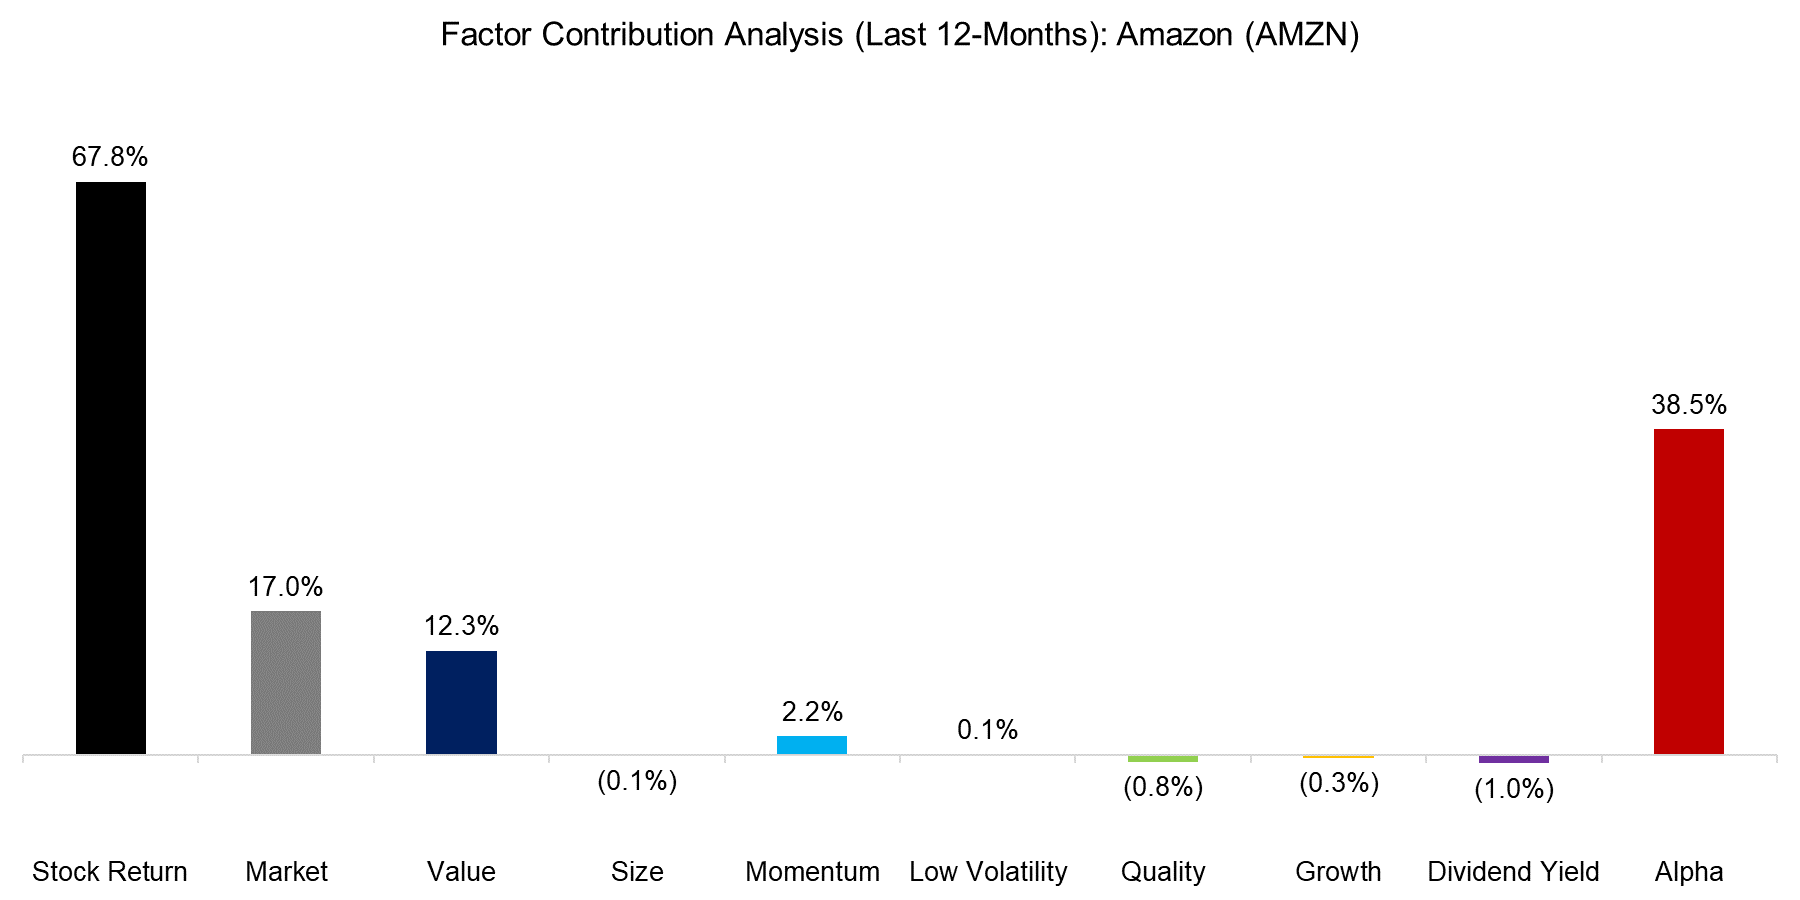
Amazon (AMZN), the online retailer, generated a return of close to 70% over the last 12 months. The return can be partially contributed to the market, which had also a positive performance, and exposure to certain factors. However, a large part of Amazon’s performance is unexplained and can be considered alpha or idiosyncratic return. The analysis below highlights the stock return, factor contributions and alpha generated over the last 12 months. Naturally other factors such as sector classification, interest rates or currencies could be included, which would provide additional information and further reduce the alpha.
Source: FactorResearch
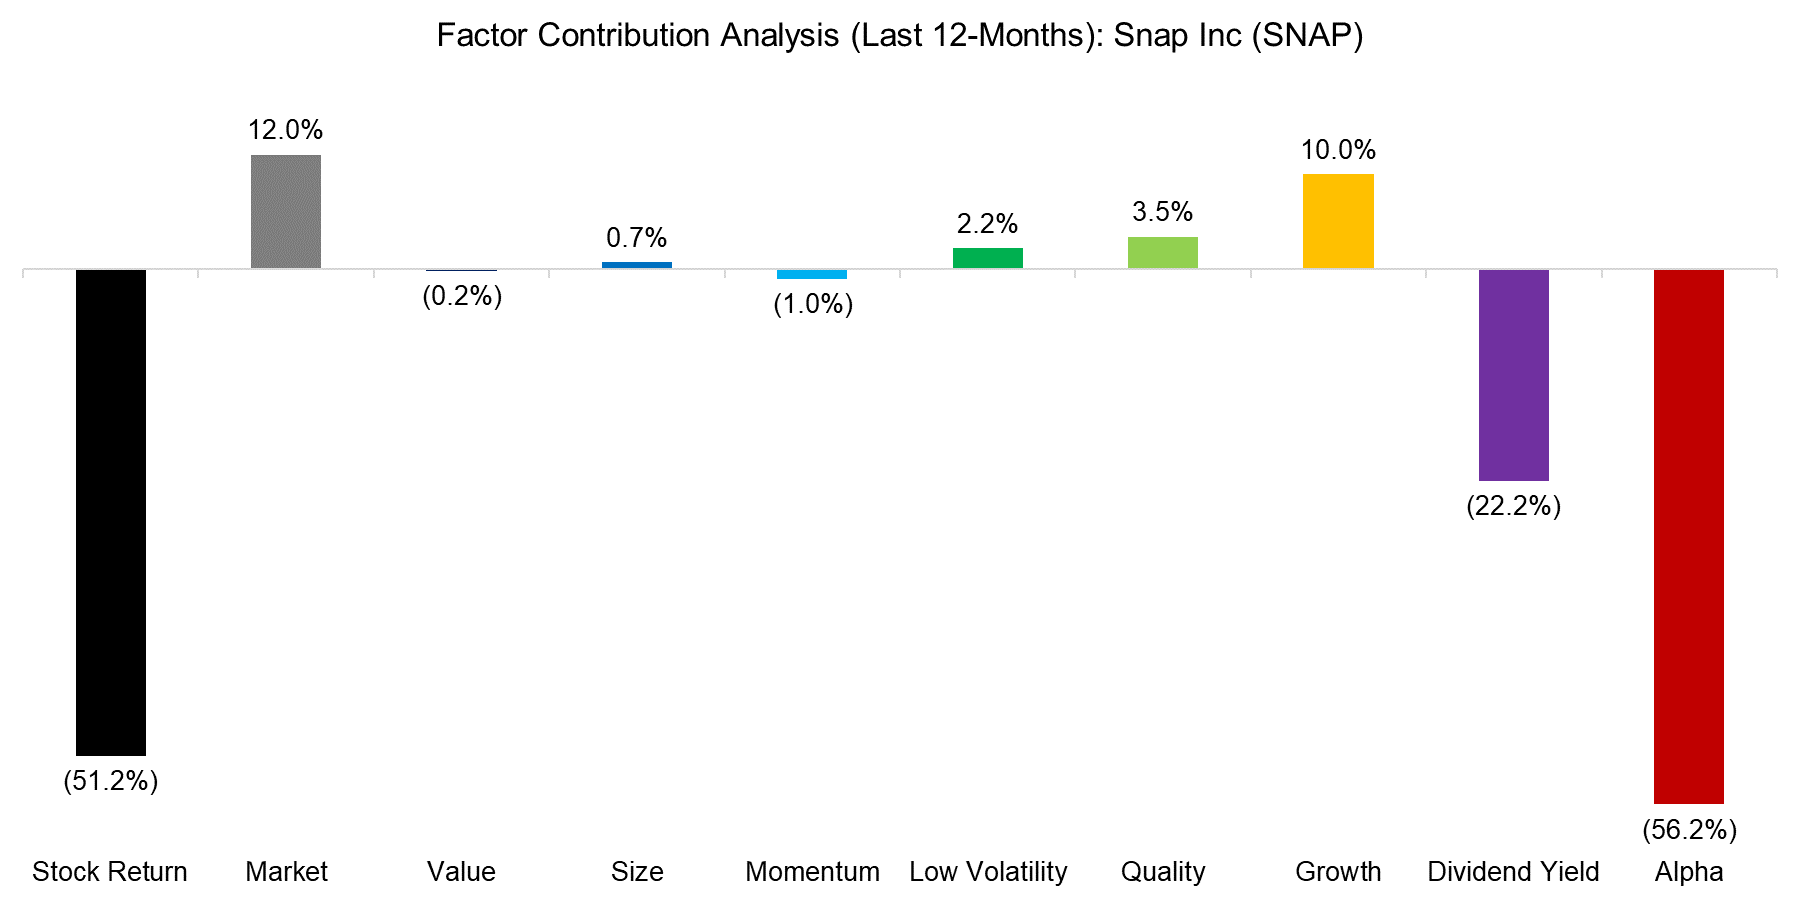
In contrast to Amazon, Snap (SNAP), the camera company, generated a significant amount of negative alpha over the last 12 months. The Alpha Momentum portfolio would therefore include Amazon in the long portfolio and Snap in the short portfolio.
Source: FactorResearch
ALPHA MOMENTUM VERSUS PRICE MOMENTUM: US
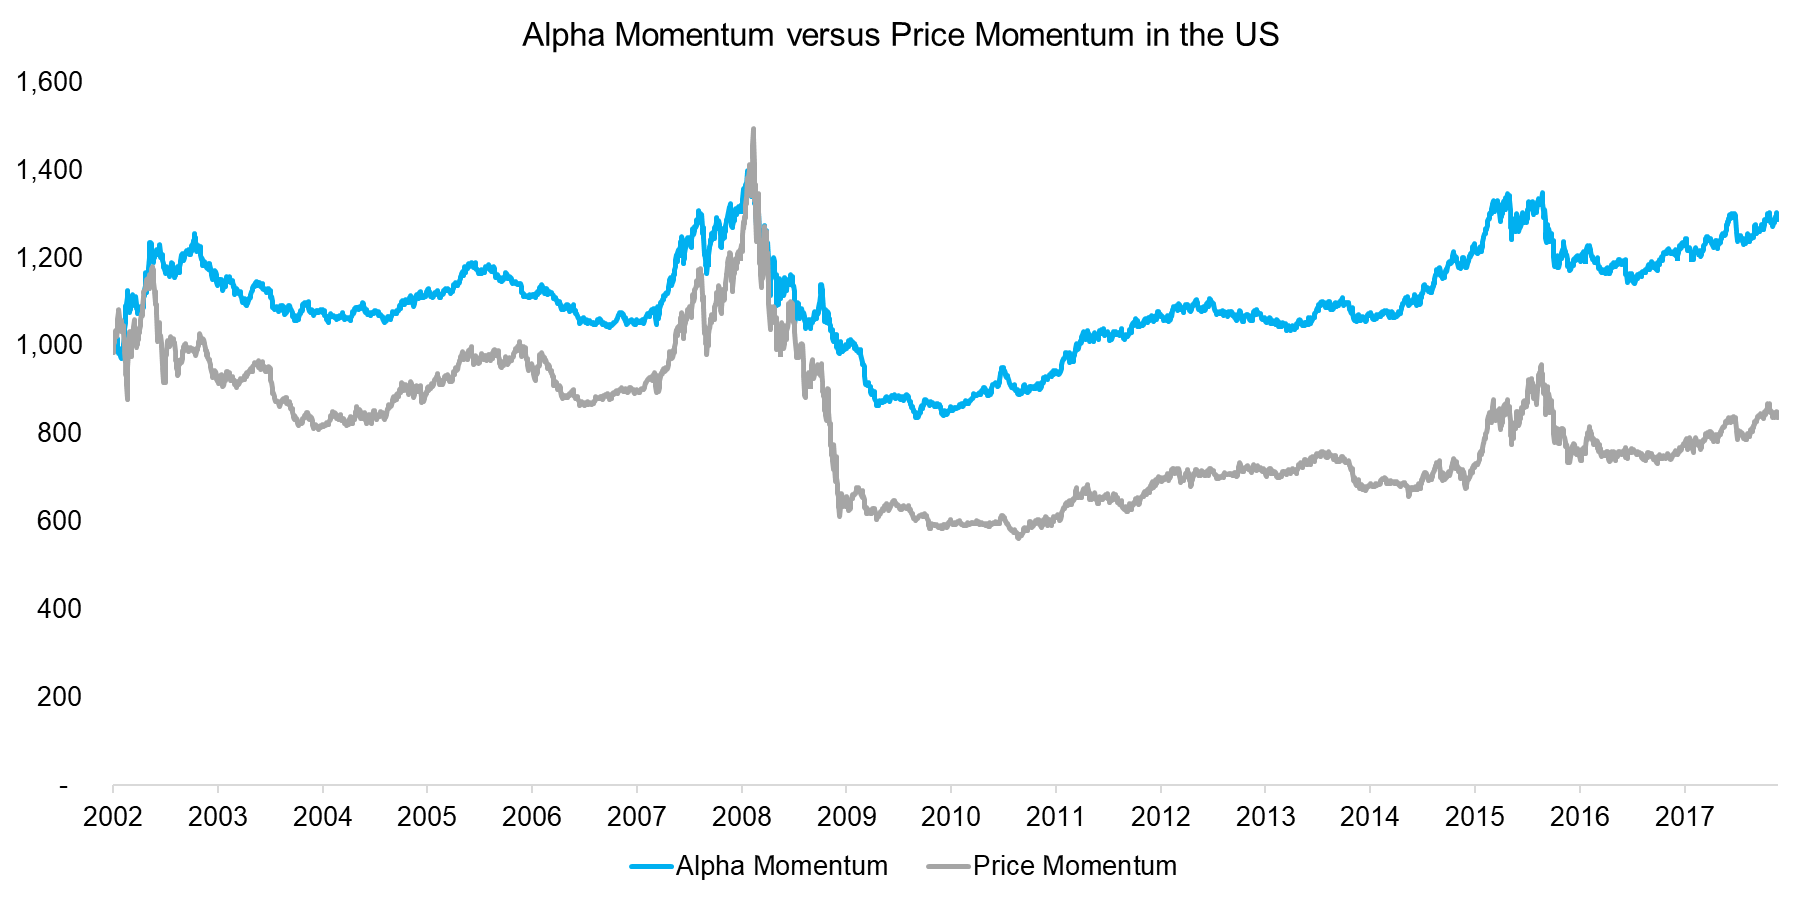
The chart below compares the performance of Alpha and Price Momentum in the US from 2002 to 2018. We can observe similar trends, but a slightly reduced Momentum crash in 2009 and a less volatile performance by the Alpha Momentum factor. It is not necessarily intuitive that these profiles are so similar, given Alpha Momentum is derived from a regression analysis that includes Price Momentum as a factor and may seem a rather abstract concept altogether. However, the portfolio is created by buying the stocks with the highest alpha and short the stocks with the lowest alpha, which often represents the stocks with highest and lowest total returns.
Source: FactorResearch
ALPHA MOMENTUM VERSUS PRICE MOMENTUM: EUROPE
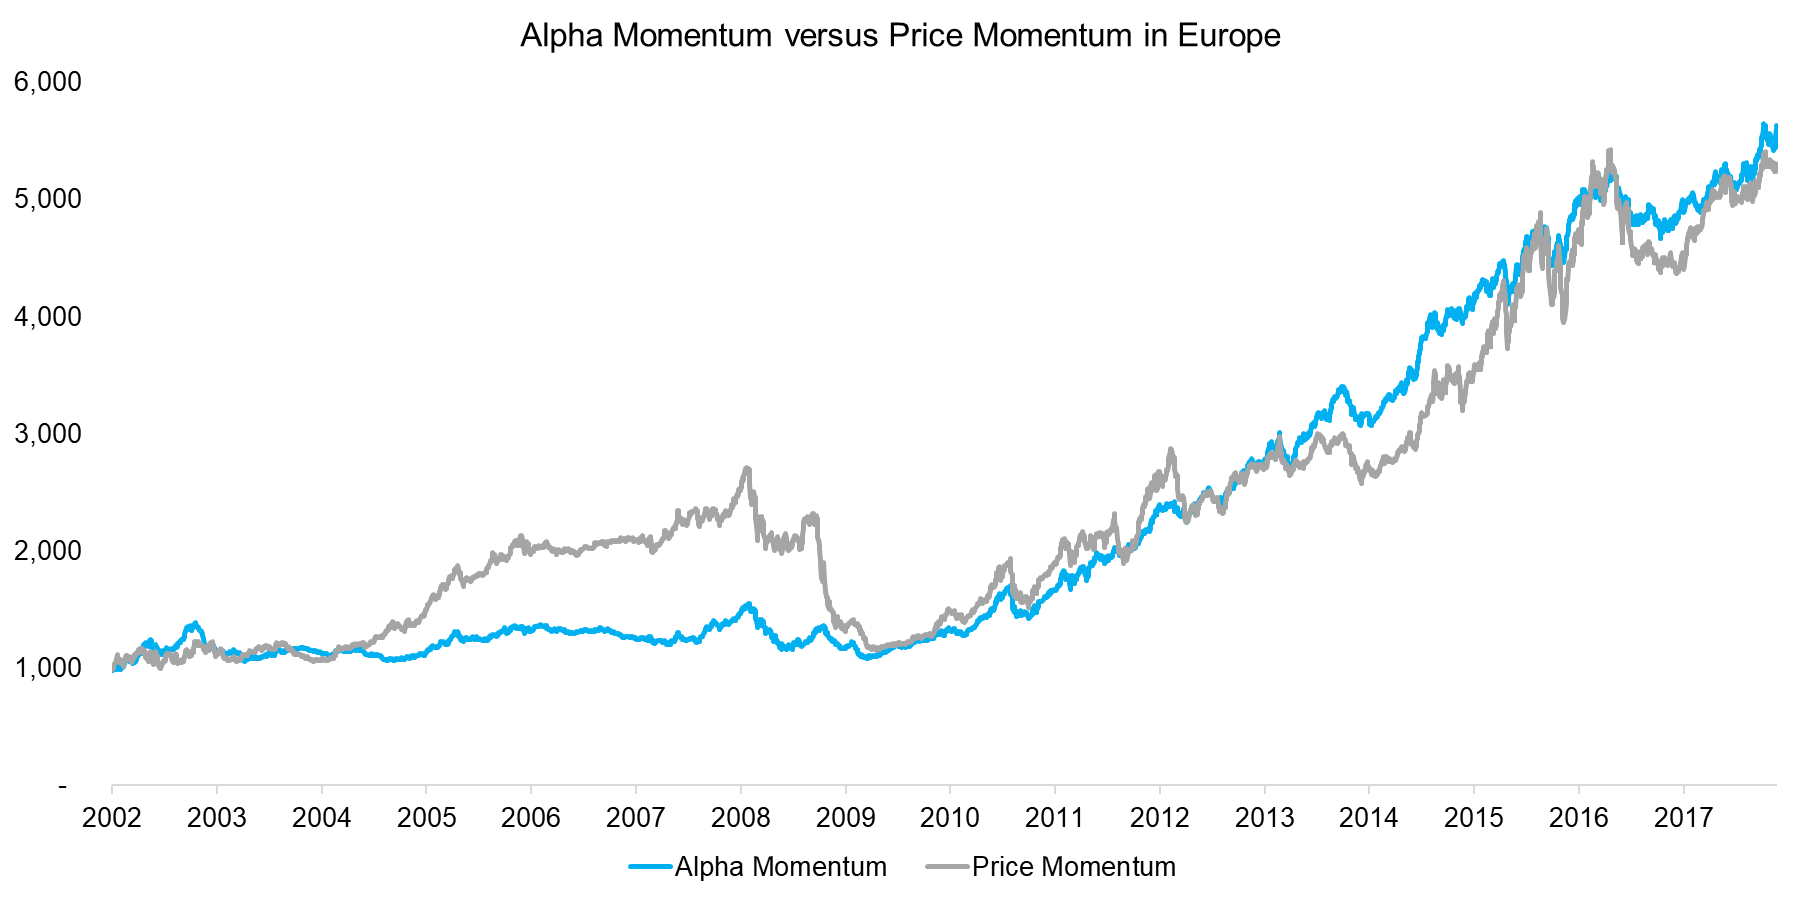
The performance of Alpha and Price Momentum from 2002 has been much more attractive in Europe than the US. The chart below highlights that Alpha Momentum has generated a more consistent and less volatile performance than Price Momentum in Europe. It is worth highlighting that Alpha Momentum does not exhibit a momentum crash in 2009, albeit it also lacks the strongly positive performance of Price Momentum from 2005 to 2008.
Source: FactorResearch
ALPHA MOMENTUM VERSUS PRICE MOMENTUM: JAPAN
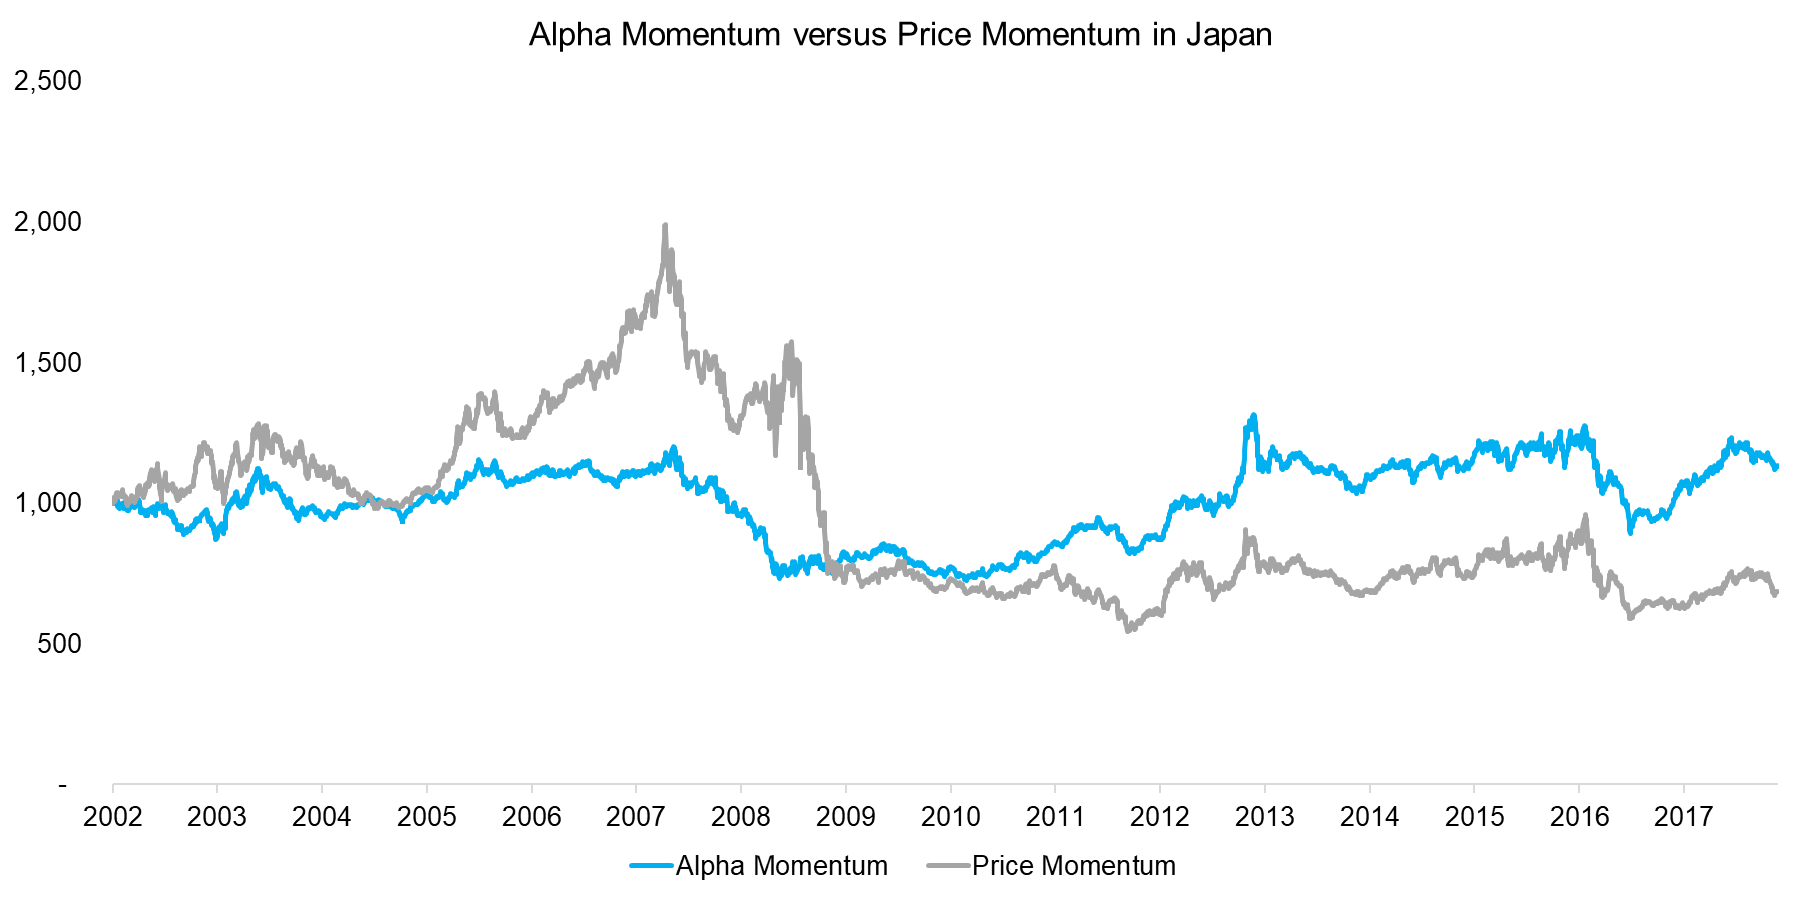
The performance of Alpha and Price Momentum in Japan has been almost zero since 2000. Price Momentum generated strong returns heading into the Global Financial Crisis in 2007, but then crashed thereafter. The performance of Alpha Momentum is not particular attractive, but less volatile than Price Momentum (read Equity Factors In Japan).
Source: FactorResearch
ALPHA MOMENTUM VERSUS PRICE MOMENTUM: RISK METRICS
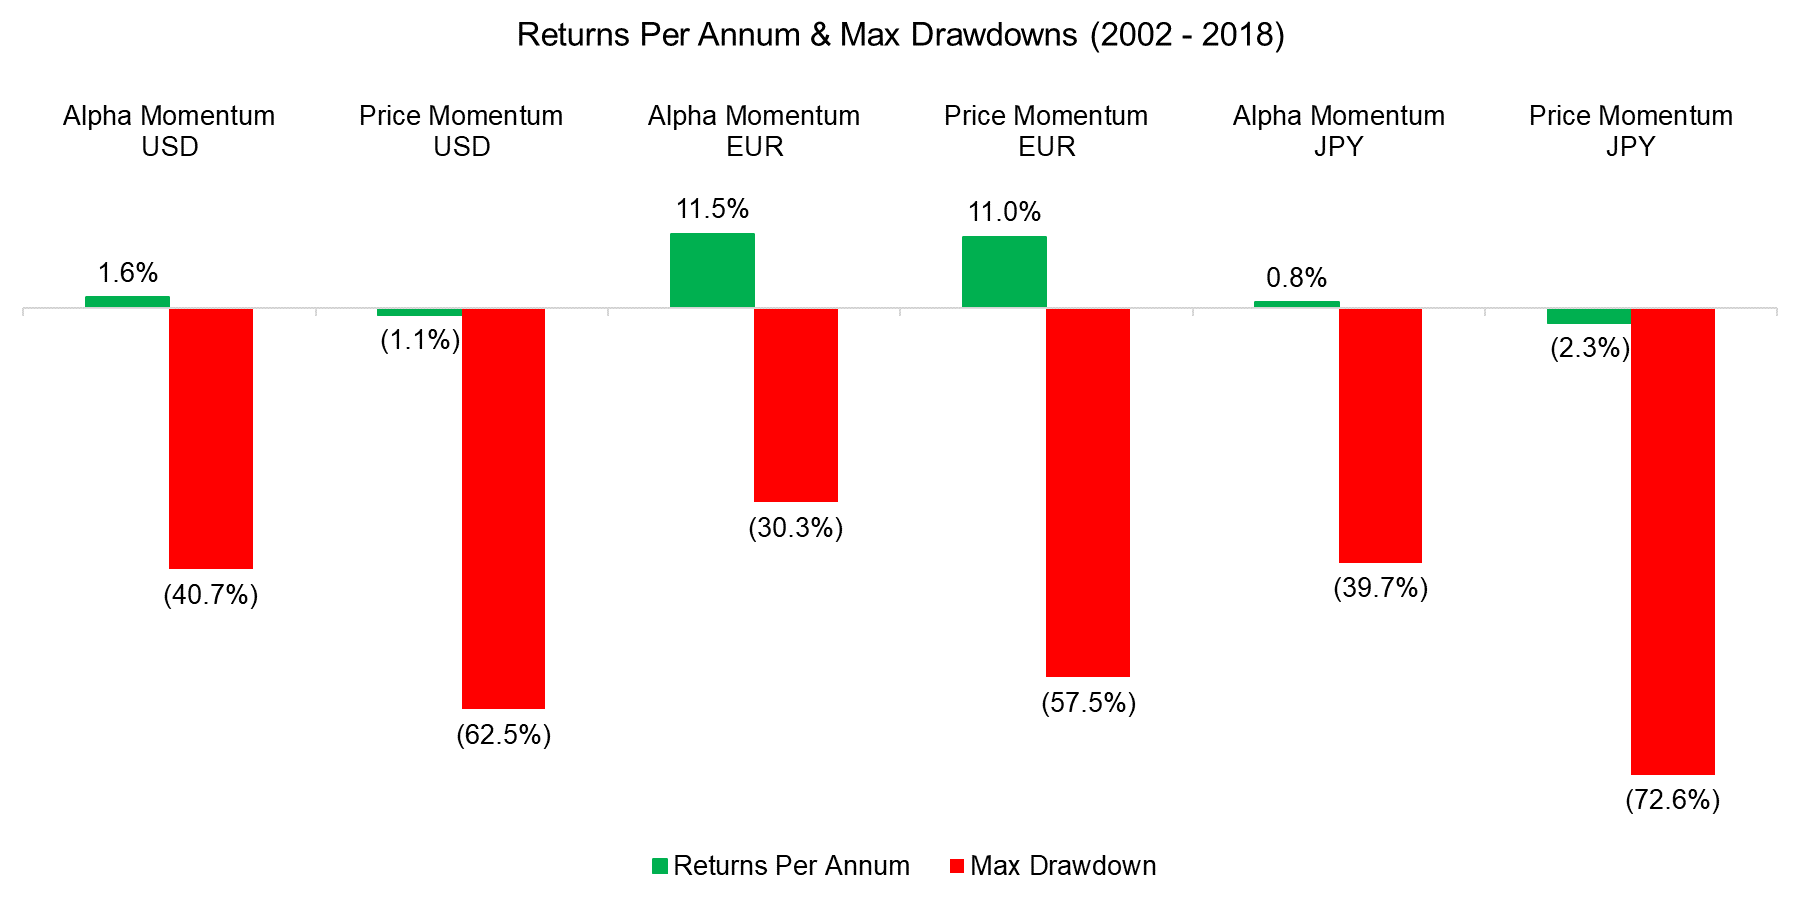
In addition to observing the performance we can also analyse the returns per annum and maximum drawdowns. Alpha Momentum generated positive returns in all three regions while Price Momentum was only positive in Europe. The analysis highlights that Alpha Momentum reduces the drawdowns of Price Momentum by almost 50%.
Source: FactorResearch
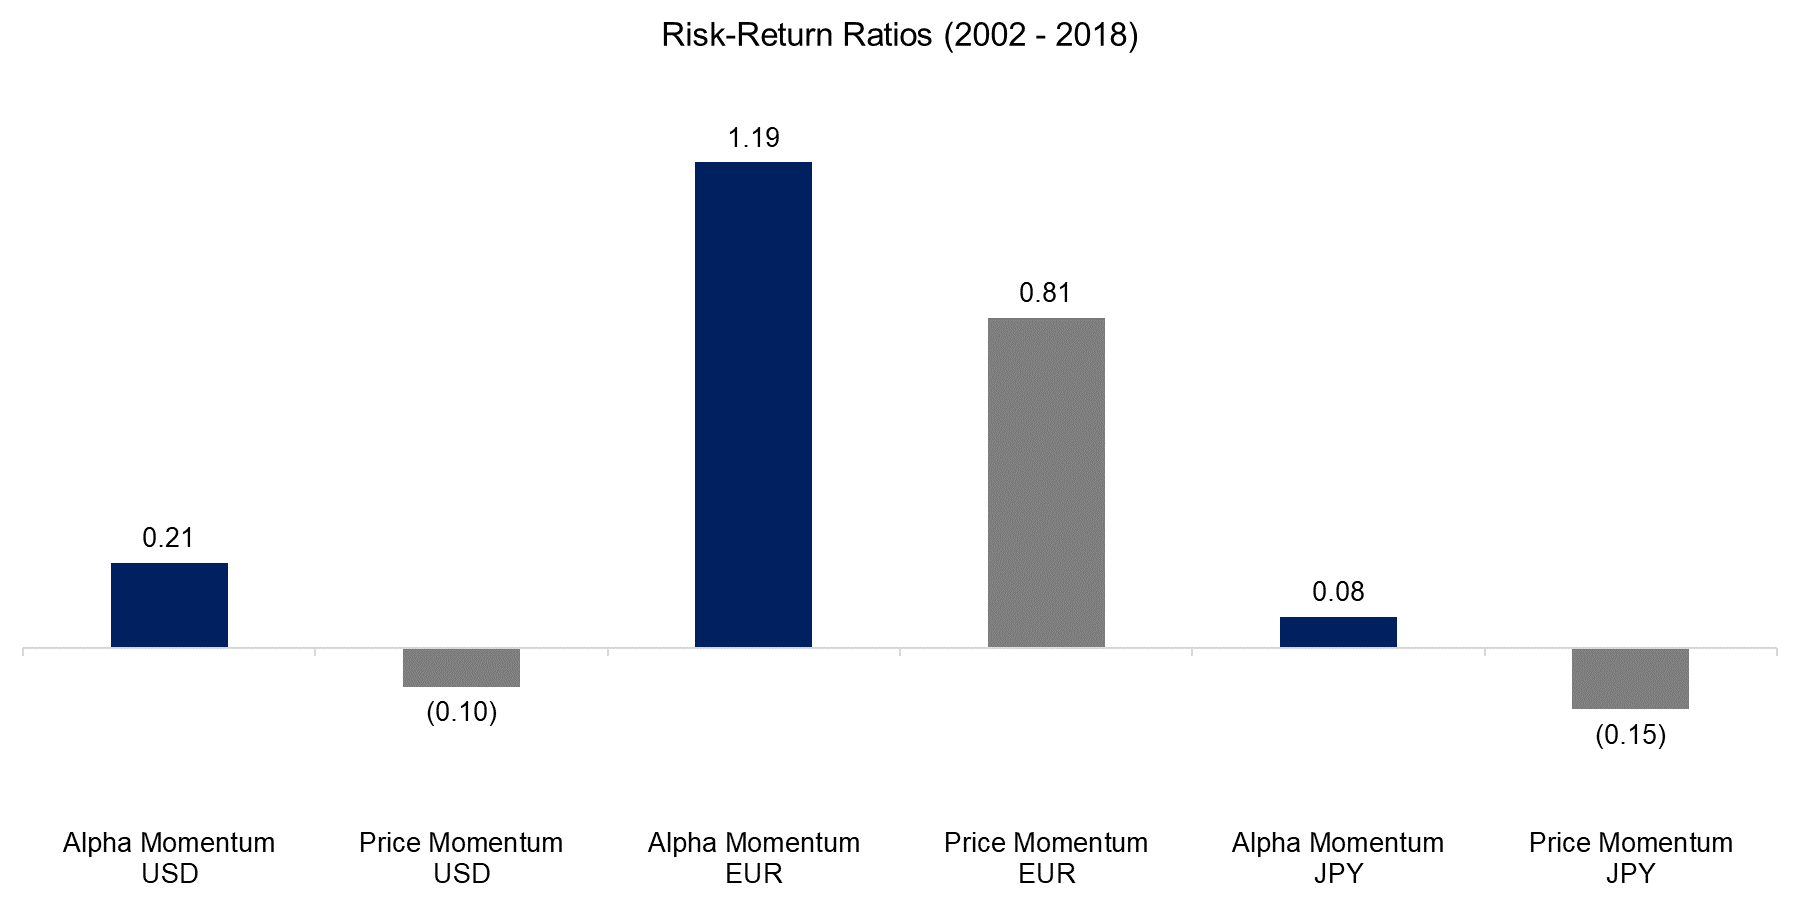
The risk-return ratios highlight that since 20000 Momentum has only been an attractive factor in Europe. However, Alpha Momentum improves the ratios in the US and Japan and can be considered an improvement compared to Price Momentum.
Source: FactorResearch
FURTHER THOUGHTS
This short research note highlights that stock alpha, similar to stock returns, can be used to predict the direction of stock returns, at least if measured over a one-year horizon. Alpha Momentum can be considered an attractive alternative to Price Momentum as performance and risk metrics improve. However, from a computational perspective Alpha Momentum is much more complex to derive than Price Momentum, which likely implies a larger difference between theoretical and realised returns. It would also be interesting to analyse if stock alpha measured on shorter time frames can be used for a short-term Mean Reversion strategy, which is a topic for another research note.
ADDITIONAL RESOURCES
Readers interested in further exploring Alpha Momentum, sometimes also referred to as Residual or Idiosyncratic Momentum, can review additional research here, summarised by Quantpedia.
ABOUT THE AUTHOR
Nicolas Rabener is the CEO & Founder of Finominal, which empowers professional investors with data, technology, and research insights to improve their investment outcomes. Previously he created Jackdaw Capital, an award-winning quantitative hedge fund. Before that Nicolas worked at GIC and Citigroup in London and New York. Nicolas holds a Master of Finance from HHL Leipzig Graduate School of Management, is a CAIA charter holder, and enjoys endurance sports (Ironman & 100km Ultramarathon).
Connect with me on LinkedIn or X.

