Are Alternative ETFs Good Diversifiers?
Uncorrelated returns are not a panacea
December 2022. Reading Time: 10 Minutes. Author: Nicolas Rabener.
SUMMARY
- Alternative products with uncorrelated returns do not necessarily provide diversification benefits
- Out of 10 alternative ETFs, only one product improved the Sharpe ratio of a 60/40 portfolio
- Correlations should be regarded carefully in fund selection
INTRODUCTION
Given the demise of the traditional 60/40 portfolio comprised of equities and bonds in 2022, investors are desperate for diversifying strategies. There are thousands of unique strategies like private equity, hedge funds, tactical asset allocation, and so on that claim to offer uncorrelated returns and compete for capital.
Theoretically, identifying attractive alternative strategies is easy. Any strategy that offers returns uncorrelated to the stock and bond market should be yielding diversification benefits. In reality, this is not that simple, which we will demonstrate in this article (read Liquid Alternatives: Alternative Enough?).
THE ALTERNATIVE CHAMPIONS
We select 9 ETFs and one mutual fund that are traded in the US, pursue alternative strategies, and have at least a 5-year track record. These are the following:
- IQ Hedge Multi-Strategy Tracker ETF (QAI): $639m AUM – seeks to replicate multi-strategy hedge funds
- IQ Hedge Macro Tracker ETF (MCRO): $3m AUM – seeks to replicate global macro hedge funds
- Hull Tactical US ETF (HTUS): $23m AUM – tactical asset allocation strategy
- BlackRock Strategic Income Opportunities Portfolio (BSIKX): $39,000m AUM – seeks to provide access to alternative credit
- SPDR SSgA Multi-Asset Real Return ETF (RLY): $570m AUM – seeks to generate real returns
- IQ Merger Arbitrage ETF (MNA): $550m AUM – seeks to replicate merger arbitrage hedge funds
- WisdomTree Managed Futures Strategy Fund (WTMF): $130m AUM – seeks to replicate CTAs
- Invesco DB G10 Currency Harvest Fund (DBV): $43m AUM – seeks to provide currency carry
- Cambria Tail Risk ETF (TAIL): $324m AUM – tail risk strategy
- AGFiQ U.S. Market Neutral Anti-Beta Fund (BTAL): $383m AUM – long low beta & short high beta stocks
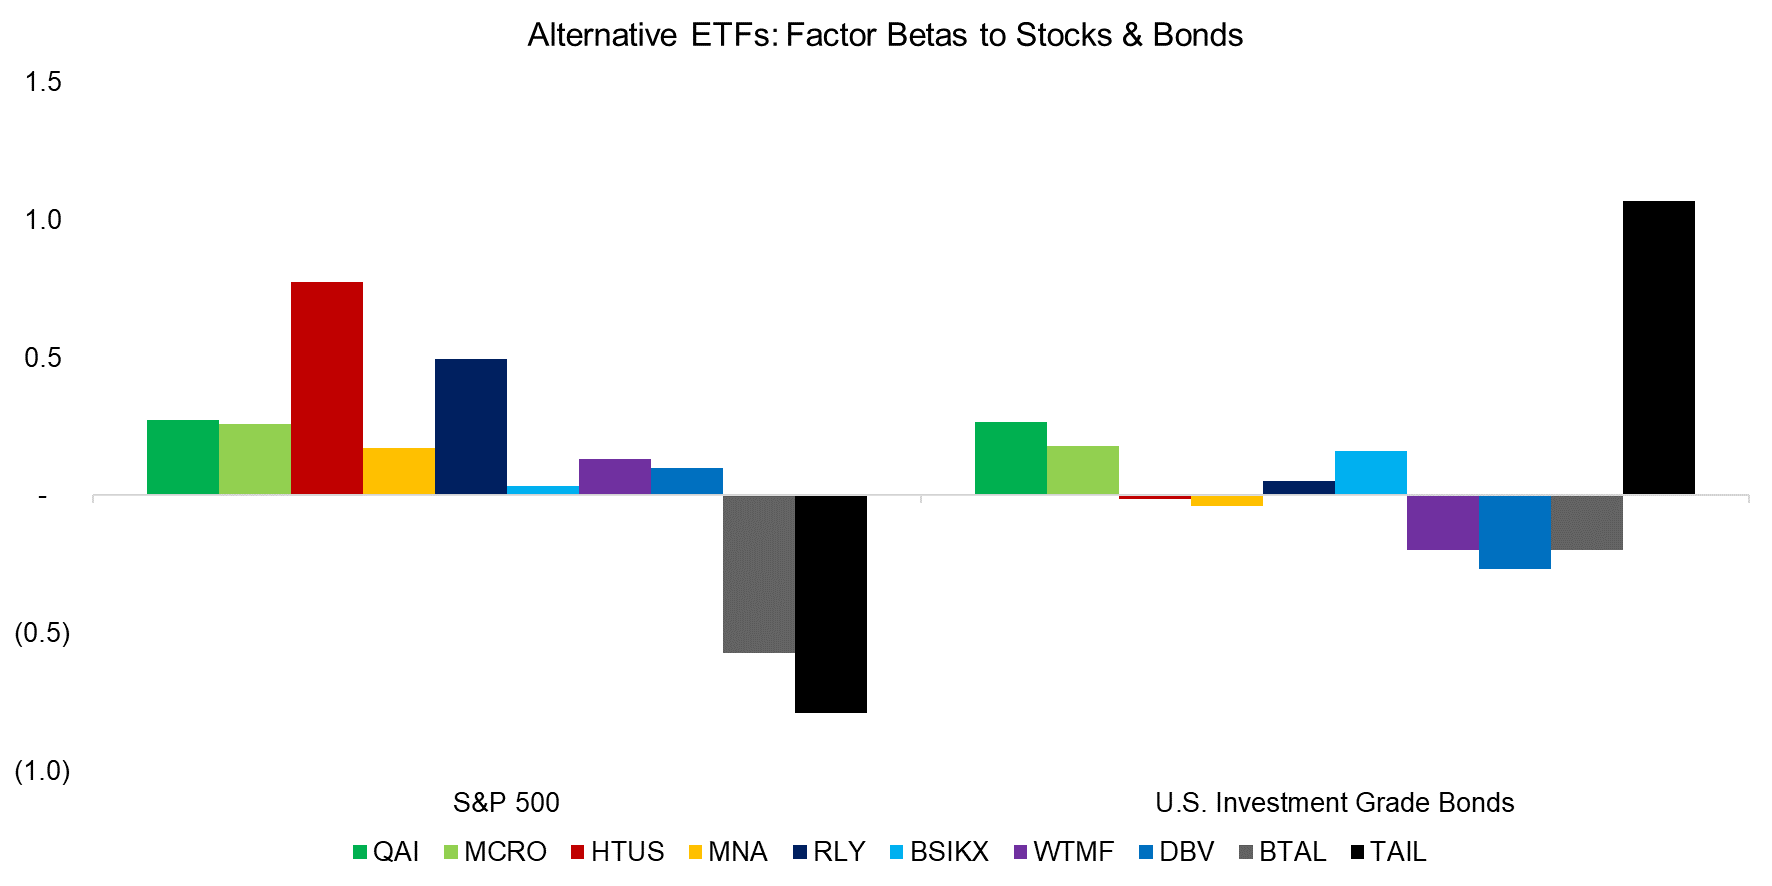
First, we run a simple factor exposure analysis using only the S&P 500 and U.S. investment grade bonds as independent variables. We observe that the betas to the stock and bond markets ranged from positive to negative, highlighting that these strategies and underlying portfolios are quite diverse.
Only one ETF namely HTUS has a beta of close to 1 to equities, which may concern investors as that indicates that diversification benefits may be limited. However, HTUS pursues a tactical asset allocation strategy by being long or short the S&P 500, or holding cash, which explains the high exposure and therefore is to be expected (read Revisiting the Performance of TAA ETFs).
Source: Finominal
RISK CONTRIBUTIONS
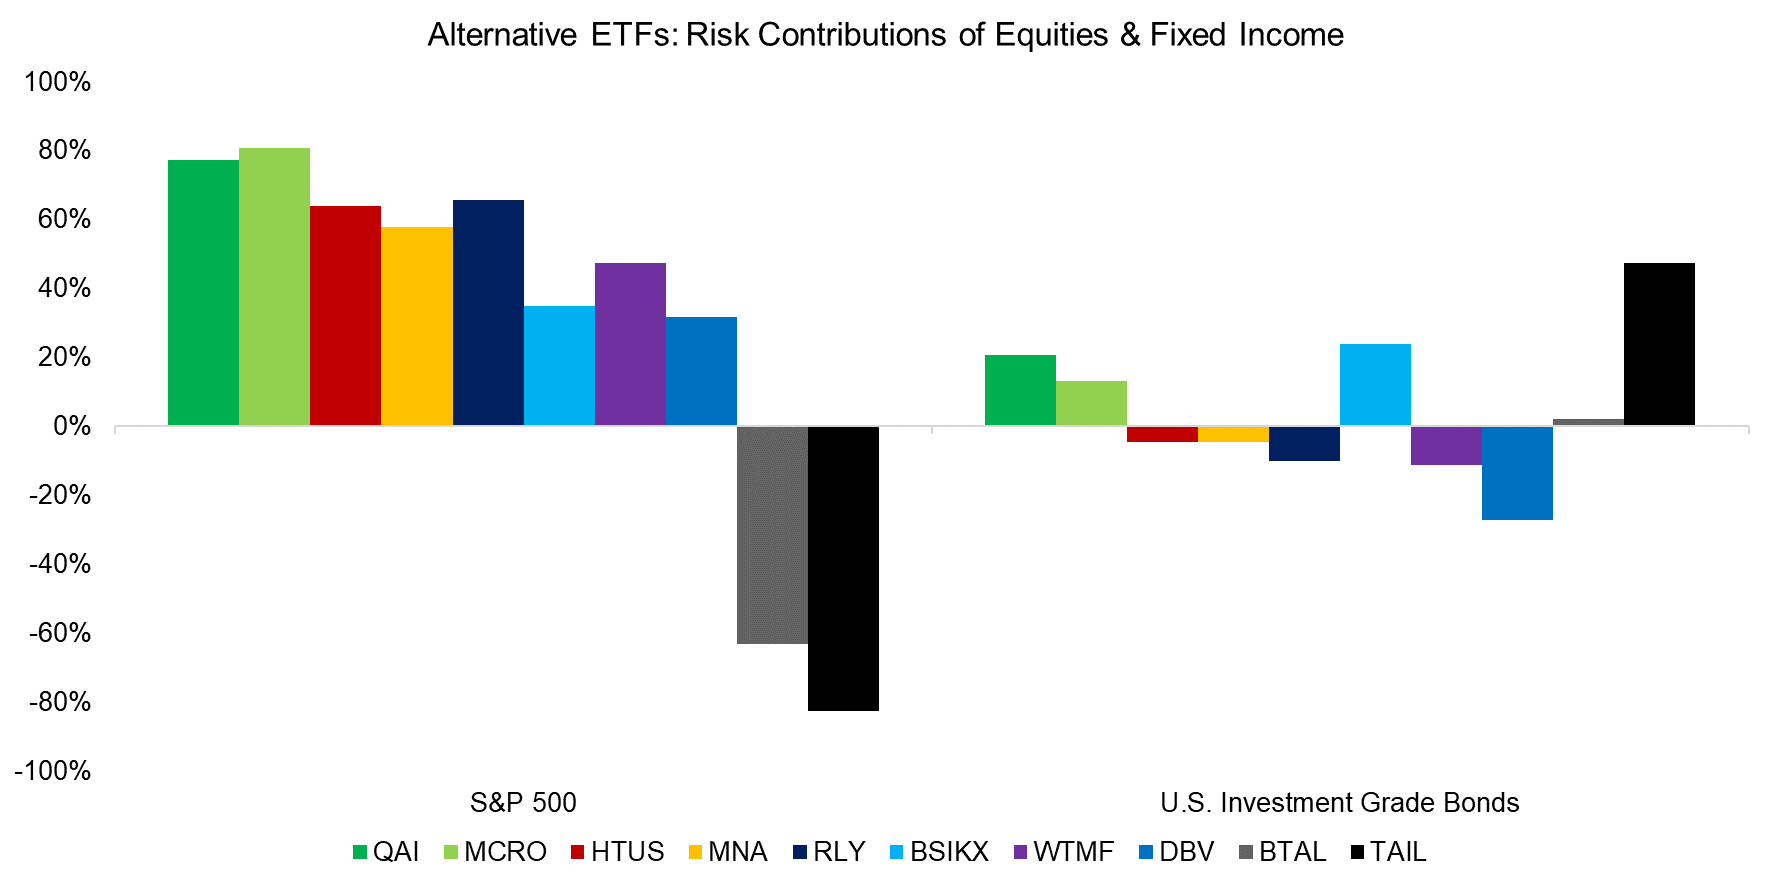
Although the betas from a factor exposure analysis are indicative of what is driving the risk and returns of a strategy, they are not very easy to understand. More useful are when the factor betas are used to compute risk contributions.
We observe that the risk contributions of equities and bond ranged from positive to negative. Furthermore, many of these alternative strategies like QAI or MCRO had low betas to the S&P 500, but most of their risk can be attributed to equities, which suggests that these strategies are not particularly alternative.
Negative risk contributions are difficult to interpret as risk can not be negative. However, these are the contributions to risk that are derived from the factor betas, which can be negative. For example, TAIL represents a portfolio of short-term U.S. Treasuries and put options on the S&P 500, which is reflected in a negative beta to equities and a positive one to U.S. bonds
Source: Finominal
CORRELATION ANALYSIS
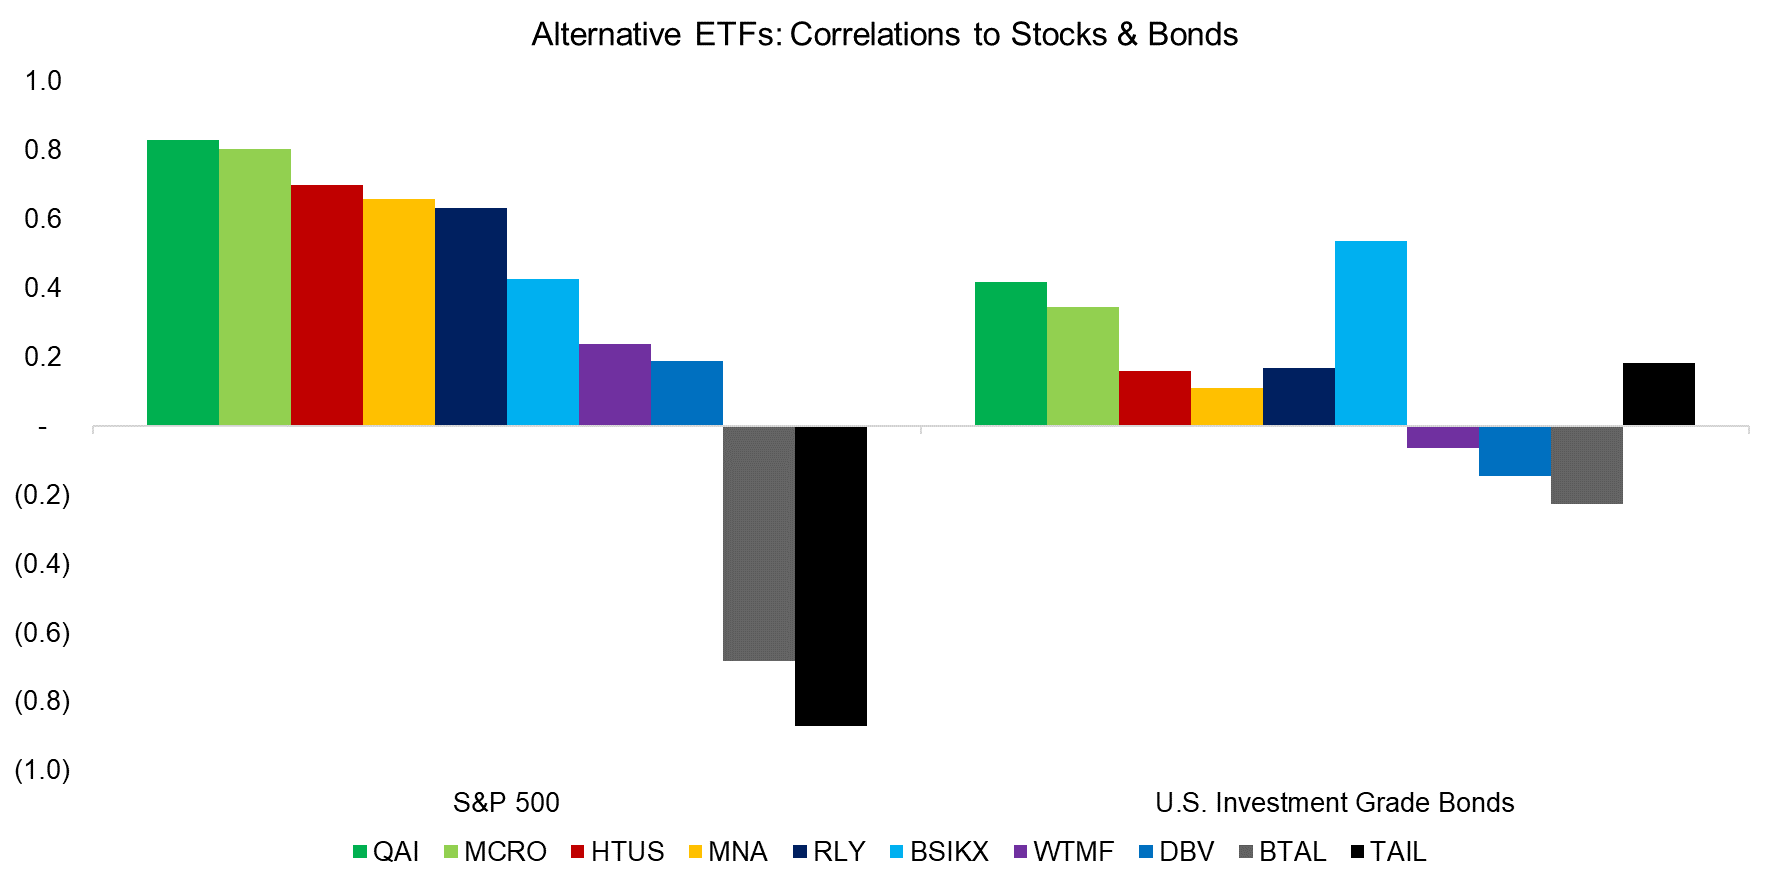
Instead of doing a factor exposure analysis, we can naturally also calculate the correlations, which mirrors the risk contribution chart. Mathematically both of these calculations can be reconciled, so this is to be expected.
Unfortunately, five out of the ten alternative ETFs had correlations larger than 0.5 to the S&P 500, which implies their diversification benefits were limited. However, the remaining five products had low to negative correlations to stocks that are more promising. Only one product namely BlackRock’s Strategic Income Opportunities Portfolio (BSIKX) had a high correlation to bonds, which is concerning as this is supposed to provide access to alternative rather than traditional credit.
Source: Finominal
QUANTIFYING DIVERSIFICATIONS BENEFITS
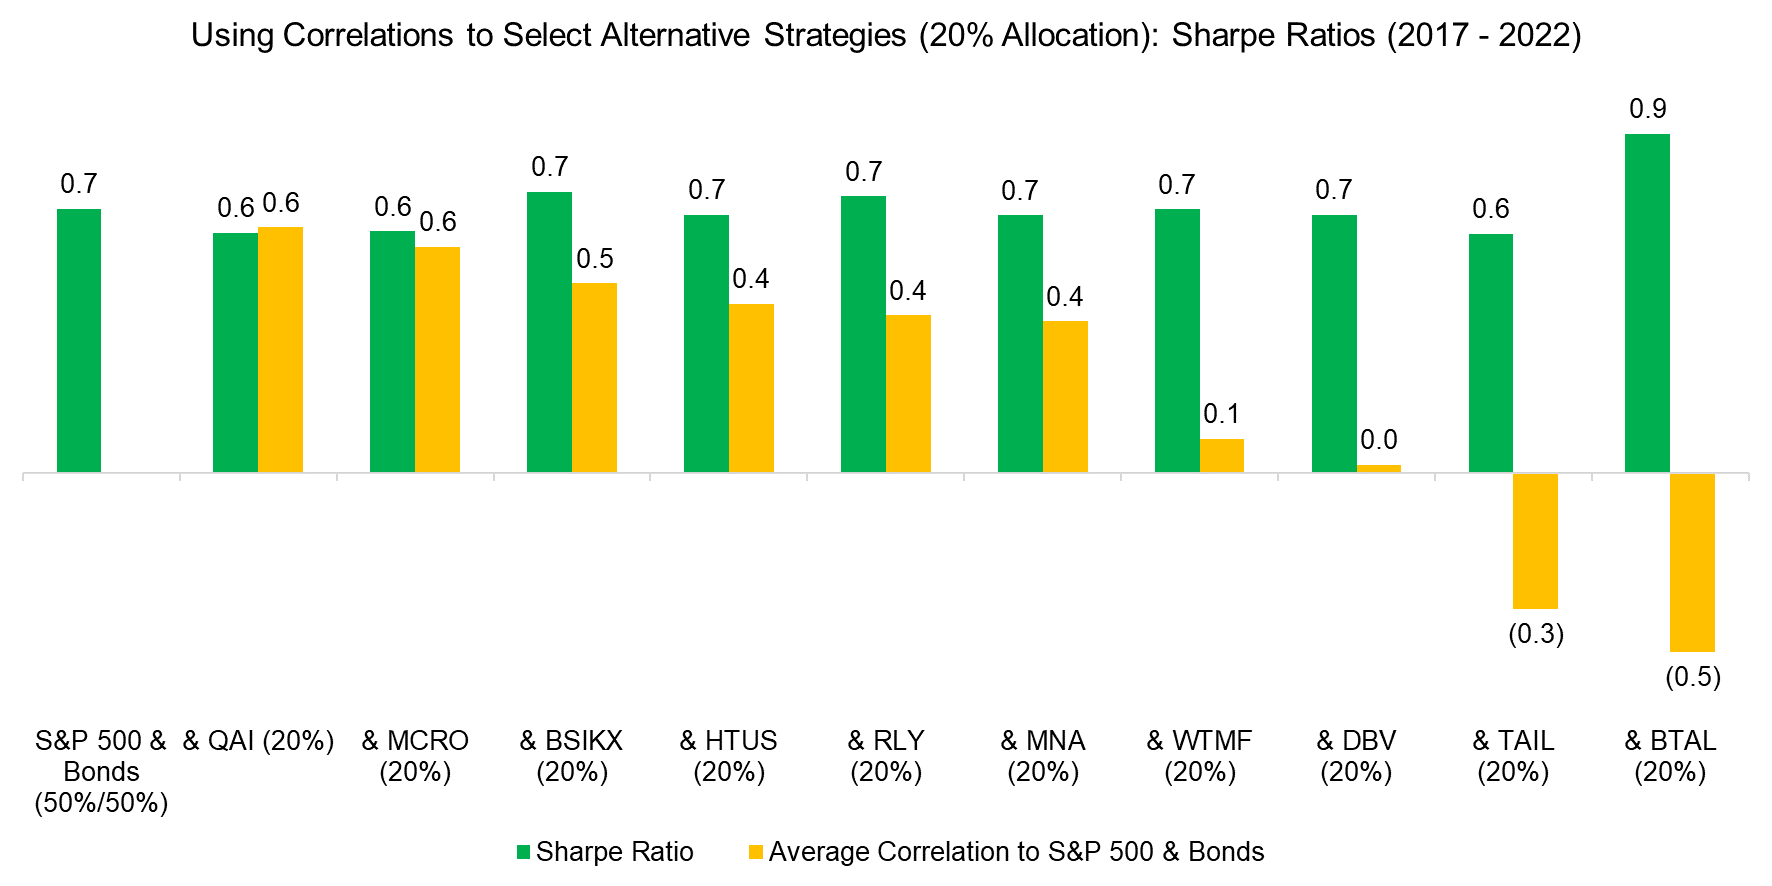
Next, we simulate the diversification benefits of adding a 20% alternative allocation to a traditional equities-bond (60/40) portfolio. Intuitively, the alternative products with high correlations to stocks and bonds should deliver low diversification benefits, compared to larger benefits from products with lower correlations.
Somewhat surprisingly, this relationship does not seem to be true on average, e.g. TAIL had a strongly negative correlation to stocks and a minor positive one to bonds, but a 20% allocation to a 60-40 portfolio did not improve the Sharp ratio over the last five years, despite this period containing a major stock market crash in 2020 where a tail risk product should have provided diversification benefits.
The only exception is the AGFiQ U.S. Market Neutral Anti-Beta Fund (BTAL), which offered uncorrelated returns and did manage to improve risk-adjusted returns.
Source: Finominal
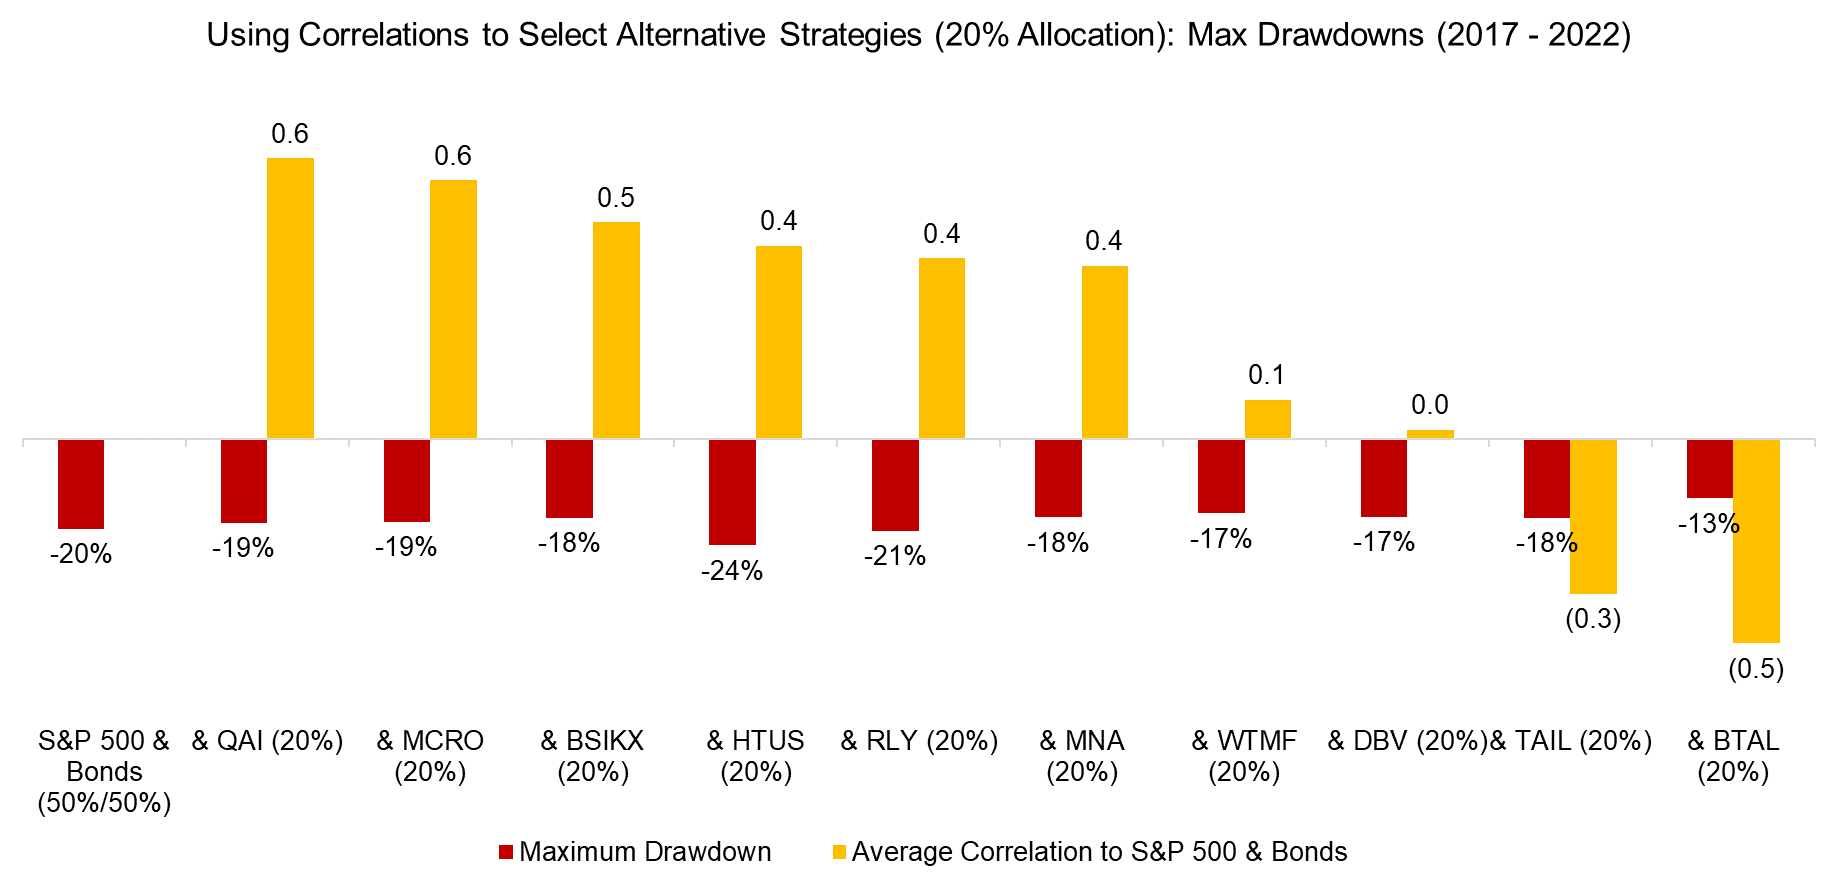
Next, we move to the maximum drawdowns achieved during the period from 2017 to 2022. The 60/40 portfolio lost 20% at its worst moment over the last five years, which occurred in this year. Although some of the alternative products would have reduced this drawdown marginally, there seems to be no relationship to the correlations of these products with equities and bonds, except for BTAL.
Source: Finominal
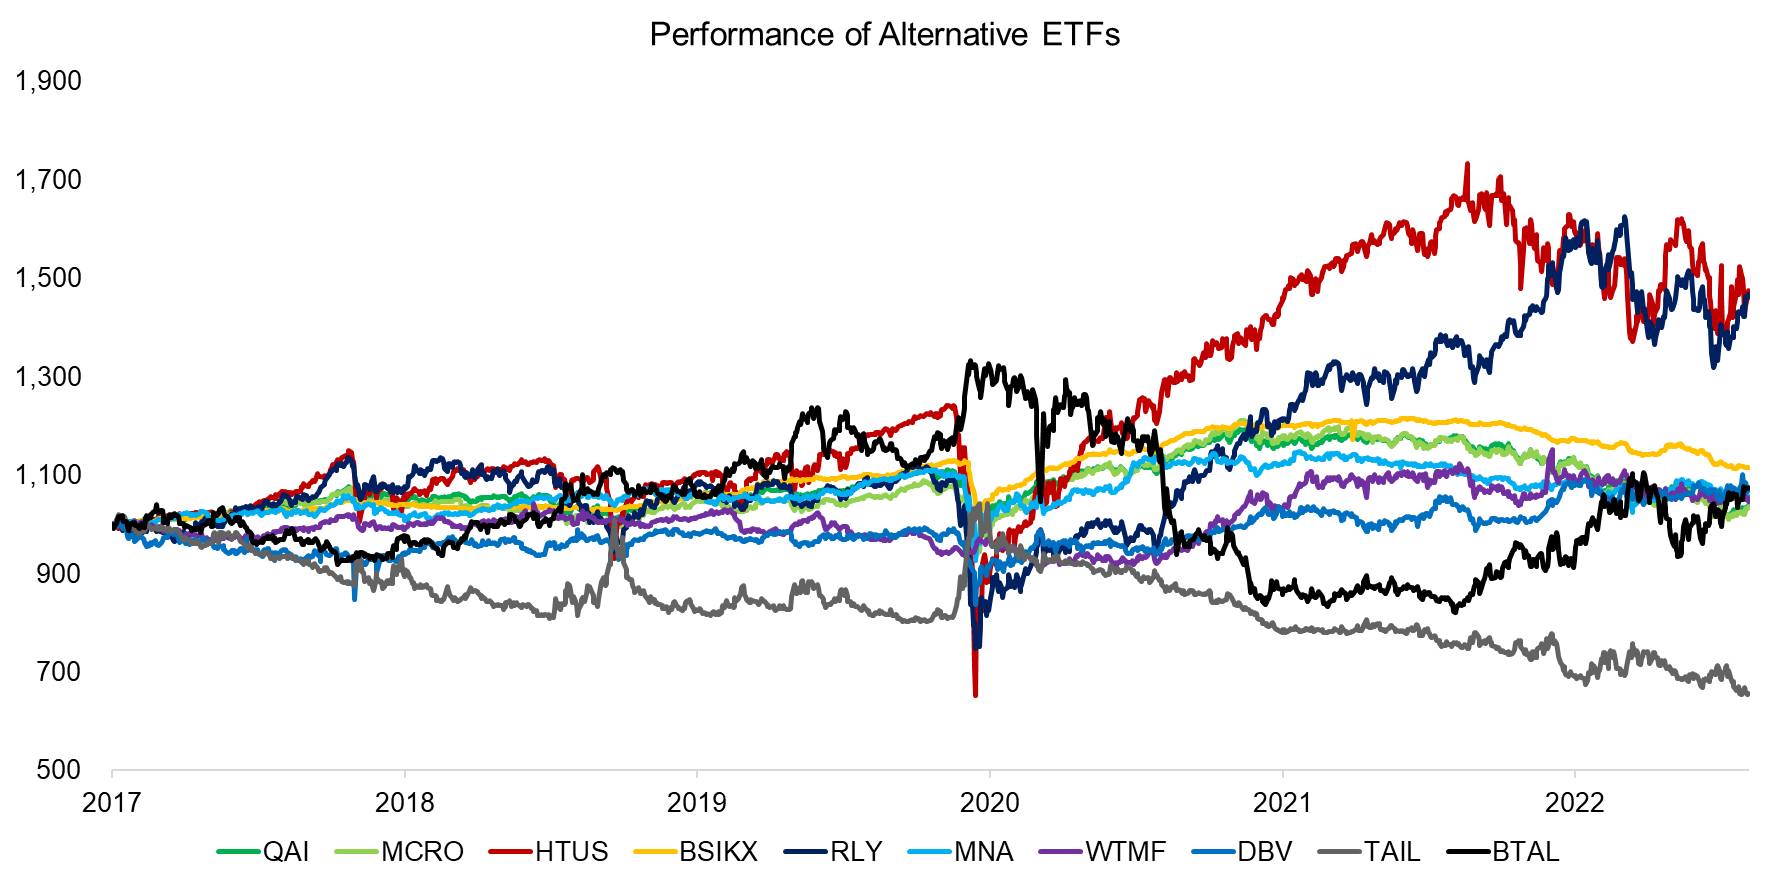
The lack of diversification benefits from most of these alternative strategies can perhaps be simply explained by their performance (read A Horse Race of Liquid Alternatives).
Some like the HTUS and RLY provided positive returns over the last five years, albeit less than the S&P 500 and were highly correlated to equities, which does not improve Sharpe ratios. Others like DBV or TAIL were negatively correlated, but had zero to negative returns, which was also not helpful as volatility and returns decreased proportionally. As we pointed out in previous research, simply being alternative is not good enough.
Source: Finominal
FURTHER THOUGHTS
Most marketing presentations for private equity, real estate, or hedge funds include a table highlighting a low correlation to the stock market, in order to demonstrate that these products provide uncorrelated returns. However, it seems that using correlation as a metric to select alternative strategies for portfolio diversification provides mixed results at best.
RELATED RESEARCH
Hedge Fund ETFs
A Horse Race of Liquid Alternatives
Liquid Alternatives: Alternative Enough?
Factor Exposure Analysis 101: Linear vs Lasso Regression
Factor Exposure Analysis 105: Sectors versus Factors
Factor Exposure Analysis 102: More or Less Independent Variables?
ABOUT THE AUTHOR
Nicolas Rabener is the CEO & Founder of Finominal, which empowers professional investors with data, technology, and research insights to improve their investment outcomes. Previously he created Jackdaw Capital, an award-winning quantitative hedge fund. Before that Nicolas worked at GIC and Citigroup in London and New York. Nicolas holds a Master of Finance from HHL Leipzig Graduate School of Management, is a CAIA charter holder, and enjoys endurance sports (Ironman & 100km Ultramarathon).
Connect with me on LinkedIn or X.

