Are Stock Markets Becoming More Correlated?
Depends on which data you’re looking at.
September 2021. Reading Time: 10 Minutes. Author: Nicolas Rabener.
SUMMARY
- The correlation of stock markets has stopped increasing since the GFC
- The Value and Momentum factors are trading at peak correlations
- Correlations can change dramatically when using different data sources
INTRODUCTION
Globalization is less of a smooth ride on a river barge and more akin to river rafting. There might be calm stretches with glorious mountain views, but also rapids and waterfalls. Occasionally, the boat is turned upside down.
Geopoliticians have commented on peak globalization many times, and sometimes the data even supports it. The McKinsey Global Institute (MGI) noted that goods-producing value chains have declined from 28% to 22% between 2007 and 2017, although that was partially made up by a 60% increase in trade in services.
The impact of globalization is perhaps most visible in financial markets. It has never been easier or cheaper for a trader in London to buy shares in American or Japanese companies. Most investors suffer from an information overload rather than a lack thereof. Capital markets have become highly efficient and information asymmetries are largely arbitraged away.
Given this, it would be intuitive to assume that stock markets trade more in sync than ever. However, intuition is frequently wrong in financial markets (read Factor Investing on Country Level).
In this research note, we will investigate the correlation of stock markets.
CORRELATION OF STOCK MARKETS
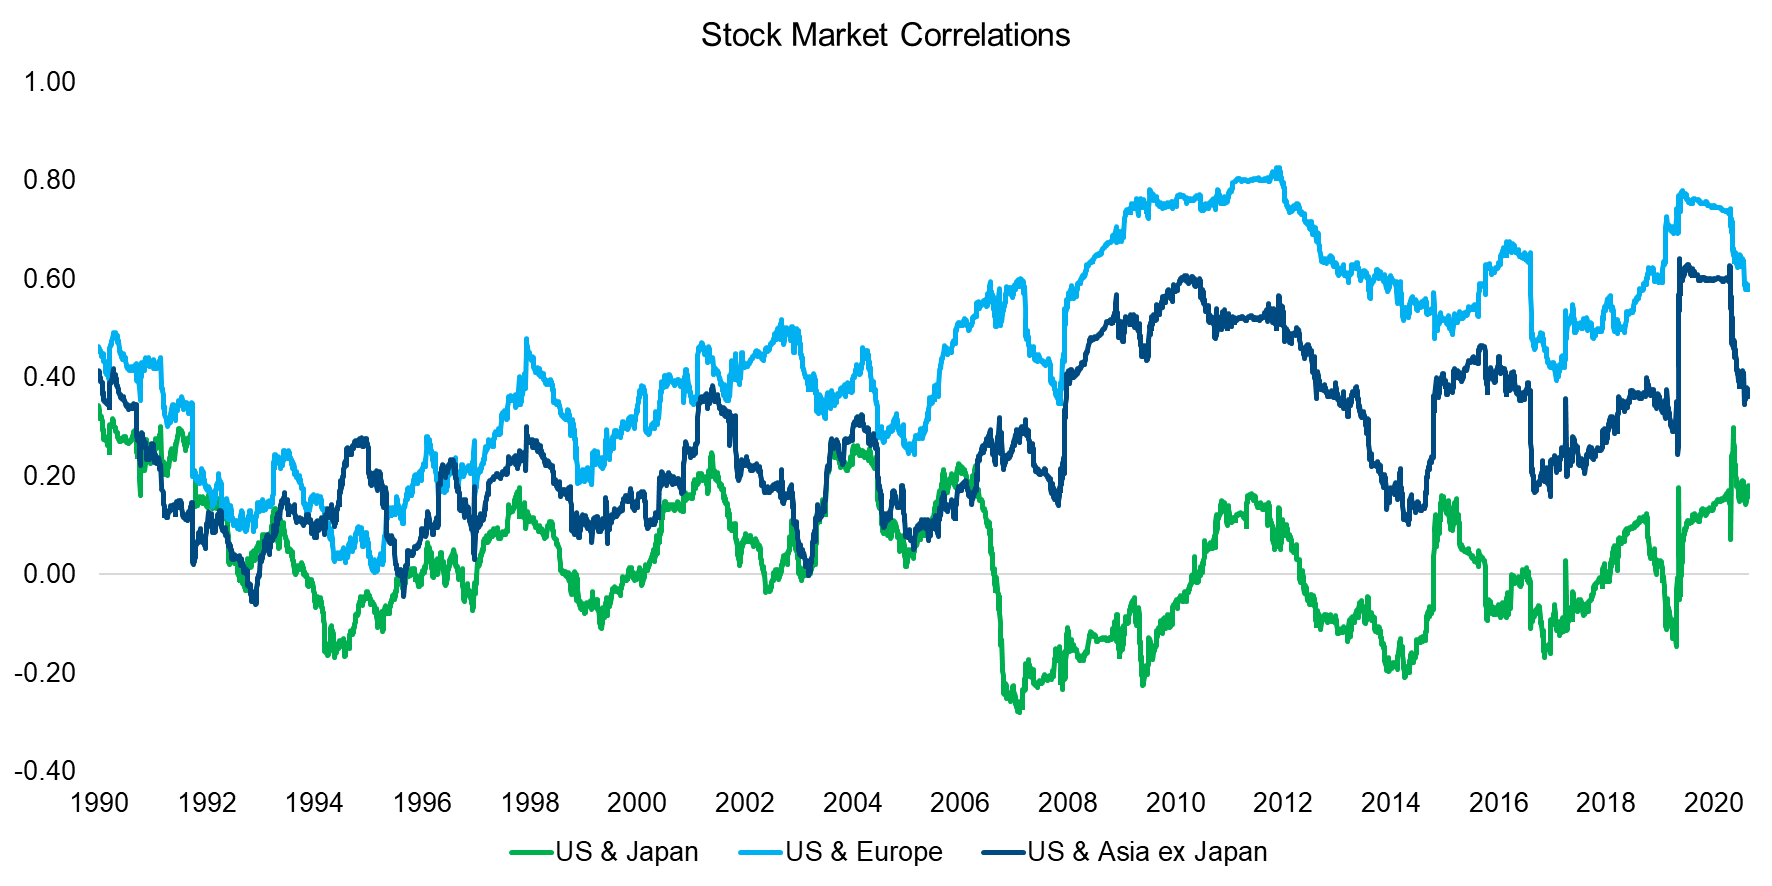
We will primarily use stock market data from the library of Kenneth R. French. First, we calculate the annual rolling correlations of the Japanese, European, and Asian excluding Japanese stock markets to the US, which were 0.03, 0.45, and 0.27, respectively, in the period from 1990 to 2021.
The correlations are surprisingly low, but equally important, are currently not at a peak level. We observe a moderate but steady increase in the correlation of international to US stock markets from the 1990s to the global financial crisis in 2008, but no significant changes thereafter. Perhaps this reflects that globalization indeed peaked, although that seems unlikely as especially China has been more integrated into the global economy since then.
Furthermore, we also observe that US and European stock markets are more highly correlated than the US and Asian ones, which reflects closer economic ties. Europe is the largest trading partner of the US, and vice versa. The overlap in time zones also likely plays a role.

Source: Kenneth R. French data library, FactorResearch
FACTOR CORRELATIONS
Next, we turn towards the world of factor investing and investigate if we see more synchronized trading from this perspective.
There are many anecdotal signs that the performance drivers of factors are global in nature. For example, investors shunned cheap for expensive stocks during the tech bubble in 2000, regardless if they were based in Tokyo or Toronto. The Momentum factor crashed in China in 2009 like elsewhere, despite the Chinese stock market being dominated by local retail investors.
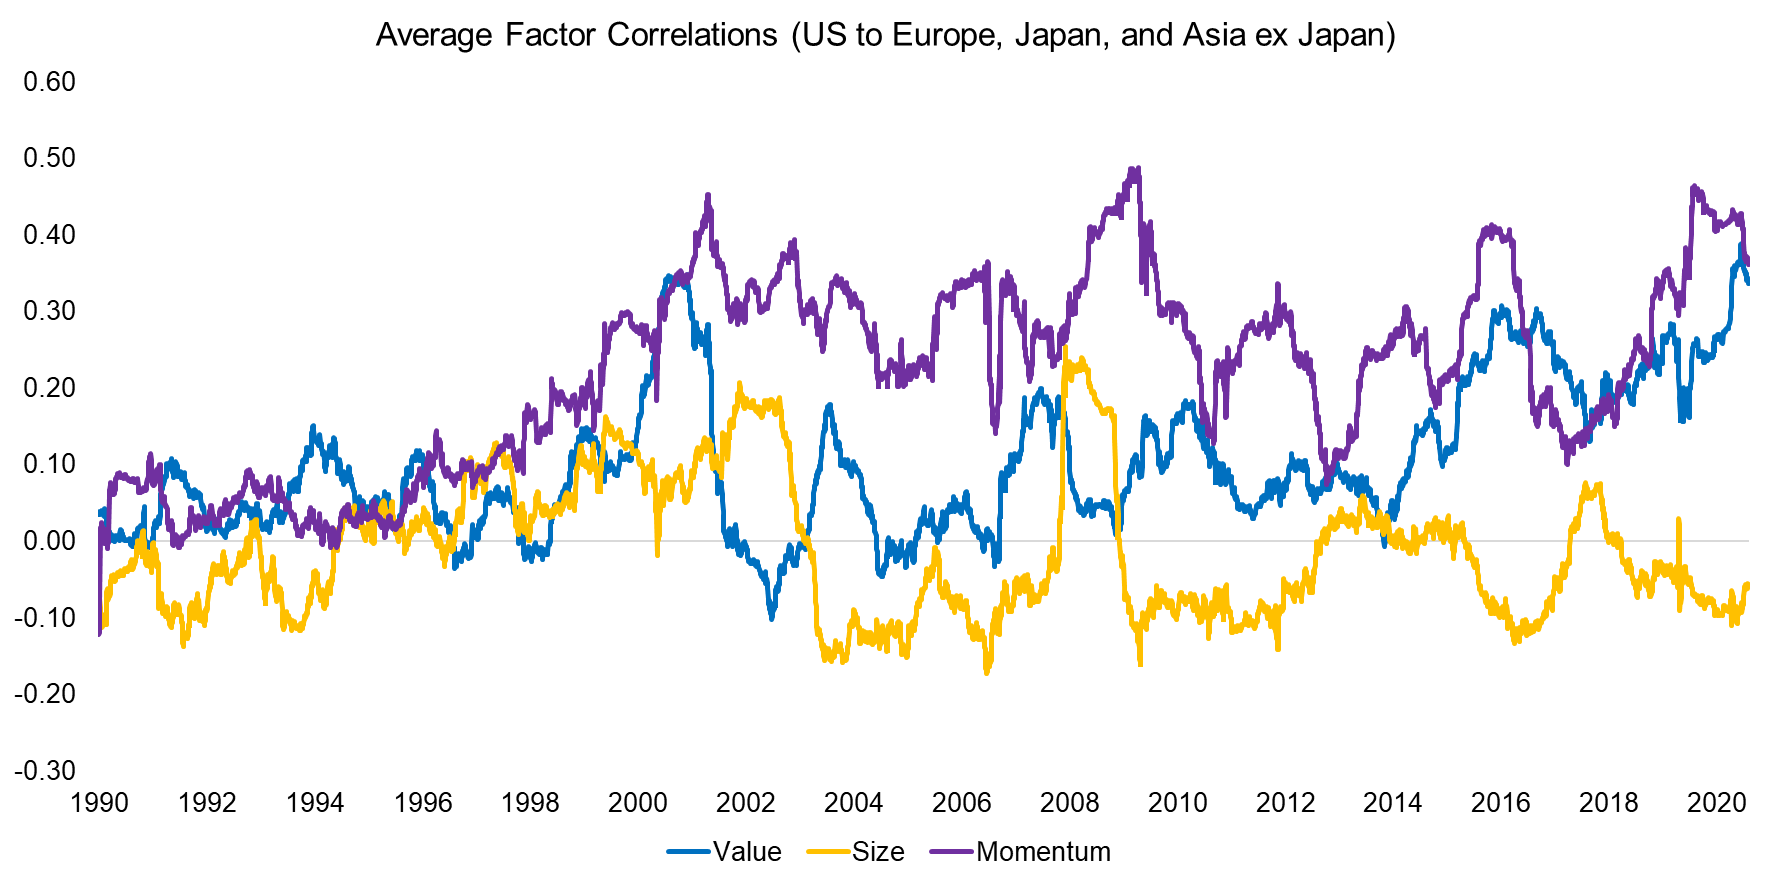
However, if we calculate the correlations of popular equity factors in the US to other markets, then we derive average correlations below 0.3 for the value, size, and momentum factors. This does not indicate highly synchronous trading of quantitative strategies amongst investors.
One interesting aspect of this analysis is that both the value and momentum factors are currently exhibiting the highest correlations across markets since the tech bubble in 2000, which is a reflection of the global enthusiasm for expensive and strongly performing technology stocks.

Source: Kenneth R. French Data Library, FactorResearch
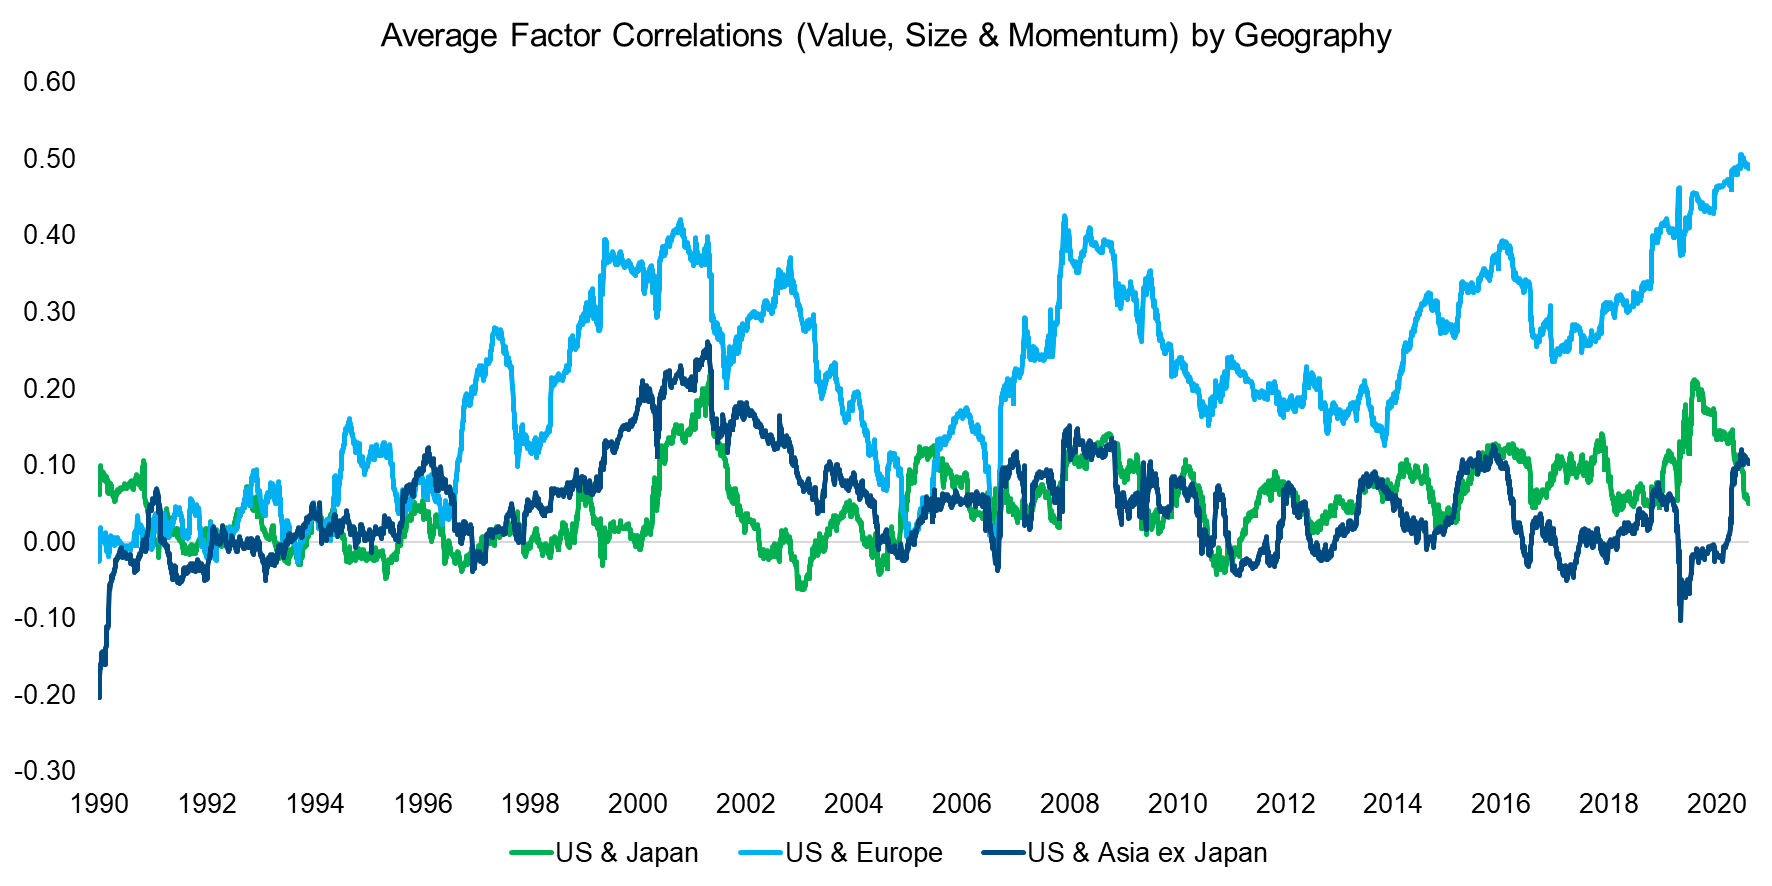
Instead of focusing on how synchronous the same factors trade across regions (value in the US vs value in Japan), we can also highlight how similar markets trade from a factor perspective (value in the US vs Japan and momentum in the US vs Japan).
In the latter case, we observe that factors between Europe and the US trade relatively similar and the correlation between factors across markets is currently at peak levels. In contrast, there seems to be no relationship between how factors in the US and Japan or Asia excluding Japan trade, which is likely a reflection of the low correlations between these stock markets.

Source: Kenneth R. French Data Library, FactorResearch
A DATA CONUNDRUM
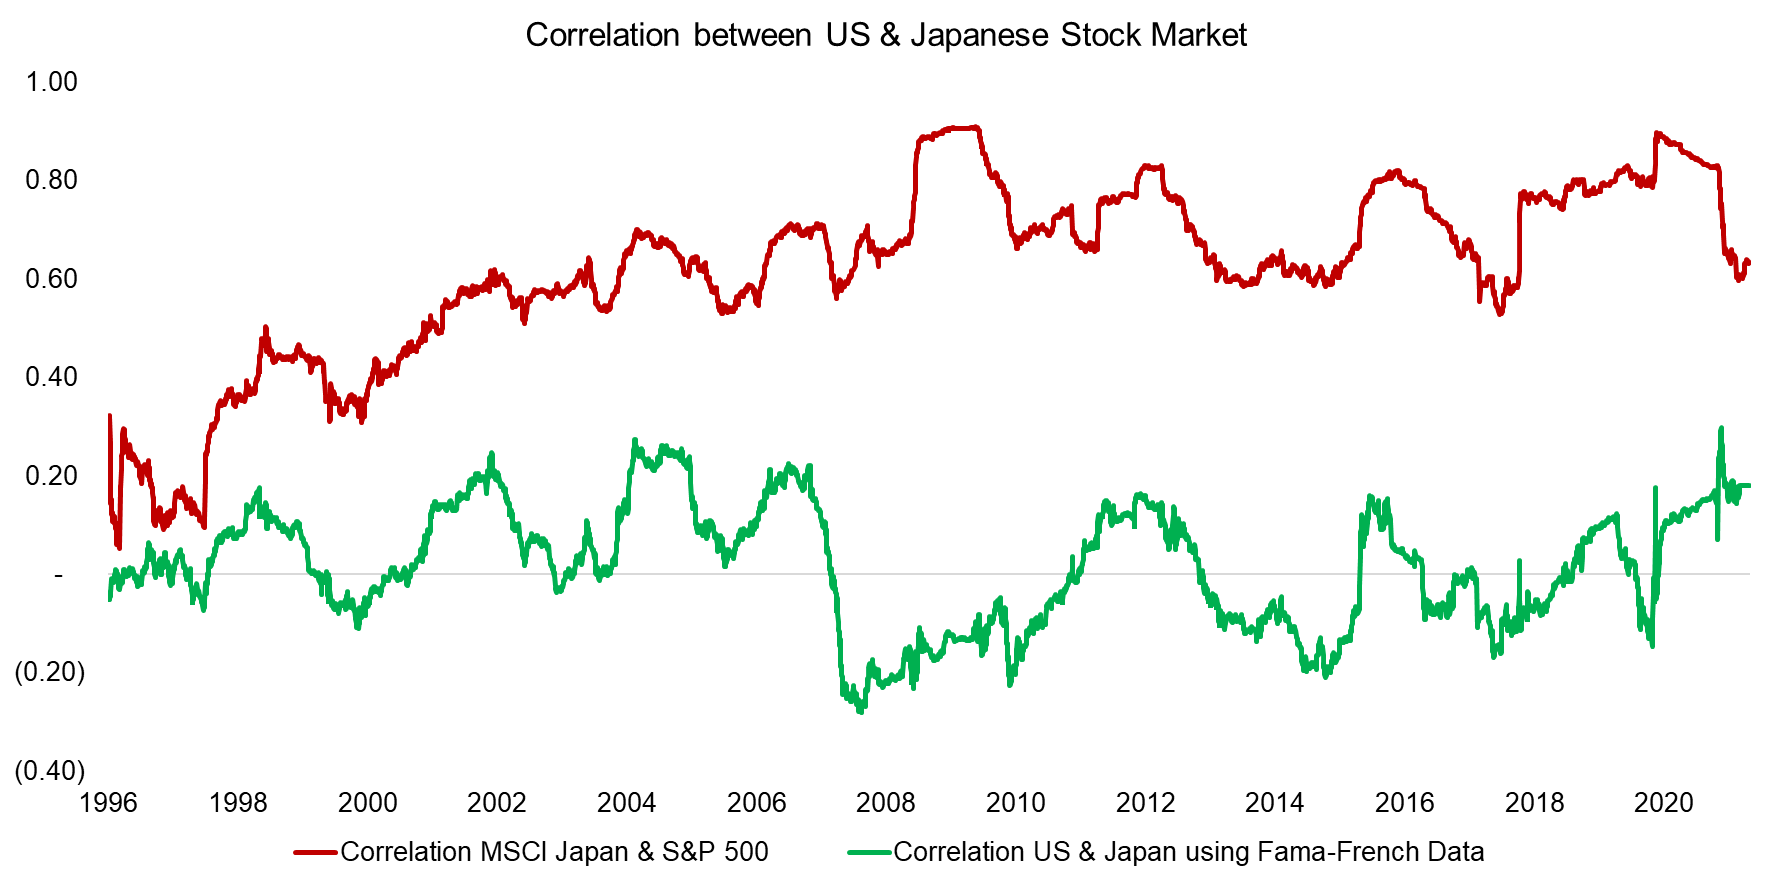
Although the relatively low factor correlations highlighted in this analysis may have surprised investors, even more unusual is the low correlation of stock markets. Most hedge funds fail to provide uncorrelated returns while we show correlations of almost zero between the US and Japanese stock markets, which would be highly desirable features given the diversification benefits.
However, the low correlation can simply be explained by different time zones as the Japanese stock market closes before the US opens. The data from the Kenneth R. French data library is local data and therefore introduces a time lag when comparing US and Japanese returns. In contrast, if we take an index like the MSCI Japan that trades as an ETF in the US, then the correlation increases to approximately 0.7.
Given that the economies and capital markets of Japan and the US are integrated, the higher correlation is much more reasonable, although less attractive from a diversification perspective. Naturally, this implies the results presented in the analysis are incorrect, as markets and factors are more correlated than shown.

Source: Kenneth R. French Data Library, FactorResearch
FURTHER THOUGHTS
We set out to explore the synchronization of stock markets and found low correlations for plain or alternative beta using the most popular data set in financial research (read Smart Beta & Factor Correlations to the S&P 500).
Unfortunately, we also highlighted that the low correlations are not true and are simply explained by a time lag due to different time zones. If using data from the same time zone, then correlations are higher and show stock markets that trade synchronously.
The world is a village, it just requires the right data to show it.
RELATED RESEARCH
Equal vs Market Cap-Weighted Portfolios in Stock Market Crashes
Quant Strategies: Theory vs Reality
ABOUT THE AUTHOR
Nicolas Rabener is the CEO & Founder of Finominal, which empowers professional investors with data, technology, and research insights to improve their investment outcomes. Previously he created Jackdaw Capital, an award-winning quantitative hedge fund. Before that Nicolas worked at GIC and Citigroup in London and New York. Nicolas holds a Master of Finance from HHL Leipzig Graduate School of Management, is a CAIA charter holder, and enjoys endurance sports (Ironman & 100km Ultramarathon).
Connect with me on LinkedIn or X.

