Benchmarking Smart Beta ETFs
Realized versus Theoretical Returns
March 2019. Reading Time: 10 Minutes. Author: Nicolas Rabener.
SUMMARY
- Long-only factor portfolios can be used for benchmarking smart beta ETFs
- Results highlight minor tracking errors
- Likely explained by relatively homogenous factor definitions by ETF issuers
INTRODUCTION
Investment professionals are not known for their creativity, but that is perhaps only because people outside of the finance industry do not understand the intricacies of finance. Significant amounts of creativity are required when creating investment strategies, explaining the daily ups and downs of the markets, or discussing why benchmarks are not really adequate in periods of underperformance.
Fund managers have a love-hate relationship with the latter as it weighs heavily on their career prospects. Although the purpose of benchmarking is to make investing more scientific by measuring the performance of fund managers, it is often a highly subjective process that requires the selection of peers or an index.
While a plain-vanilla large-cap U.S. equity manager can simply be benchmarked against the S&P 500, it is more questionable which benchmark is appropriate for measuring the performance of smart beta ETFs. These are supposed to provide exposure to common equity factors and definitions can vary across providers. In this short research note, we will benchmark smart beta ETFs in the U.S. against long-only factor portfolios based on factor definitions in line with academic research.
METHODOLOGY
We focus on five factors namely Value, Momentum, Low Volatility, Quality, and Growth in the U.S. stock market. The long-only factor portfolios are created by selecting the 30% stocks ranked most favorably by the factor and weight these by their market capitalization. The factor definitions are in line with academic research. Only stocks with a minimum market capitalization of $1 billion are included. Portfolios are rebalanced monthly and each transaction incurs costs of 10 basis points.
SMART BETA UNIVERSE OVERVIEW
The theory of smart beta is based on factor investing literature, which highlights positive excess returns for a number of factors across asset classes and markets. The factors that feature the strongest academic support are Value, Momentum, Low Volatility, Quality, and Size (read Smart Beta vs Factor Returns).
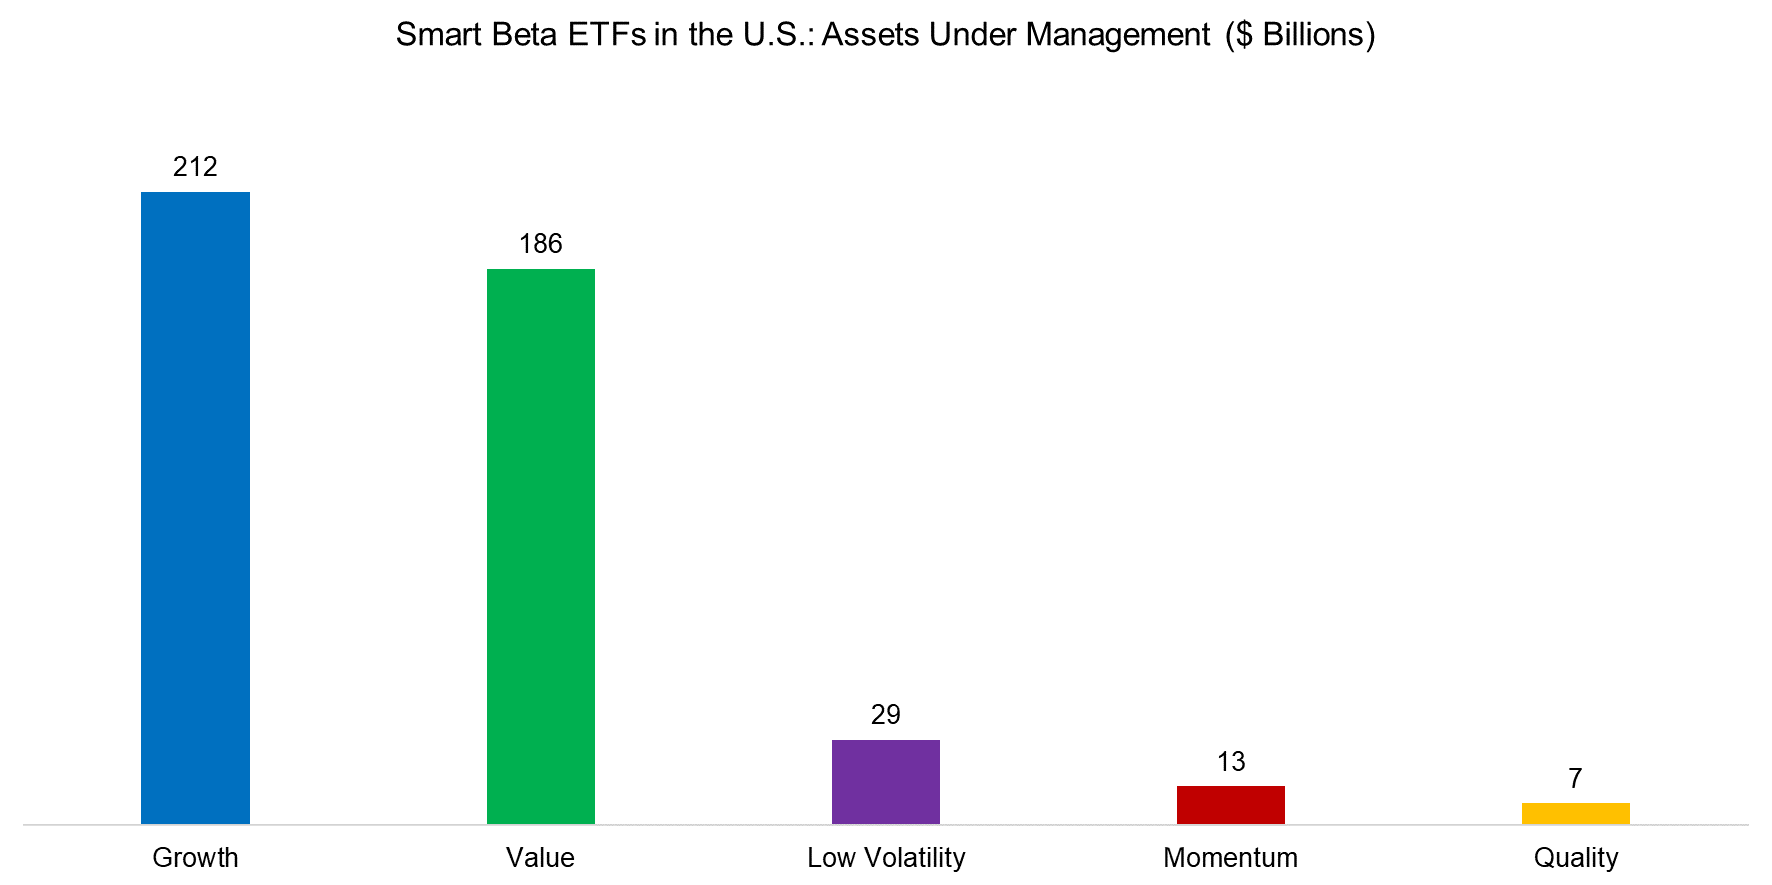
However, somewhat surprisingly the most successful smart beta category in terms of assets under management as of the end of 2018 is the Growth factor, which has no support from academic research. It is challenging to explain why investors familiar with factor investing literature would allocate to the Growth factor, but financial markets frequently highlight unusual investor behavior.
Source: ETF.com, FactorResearch
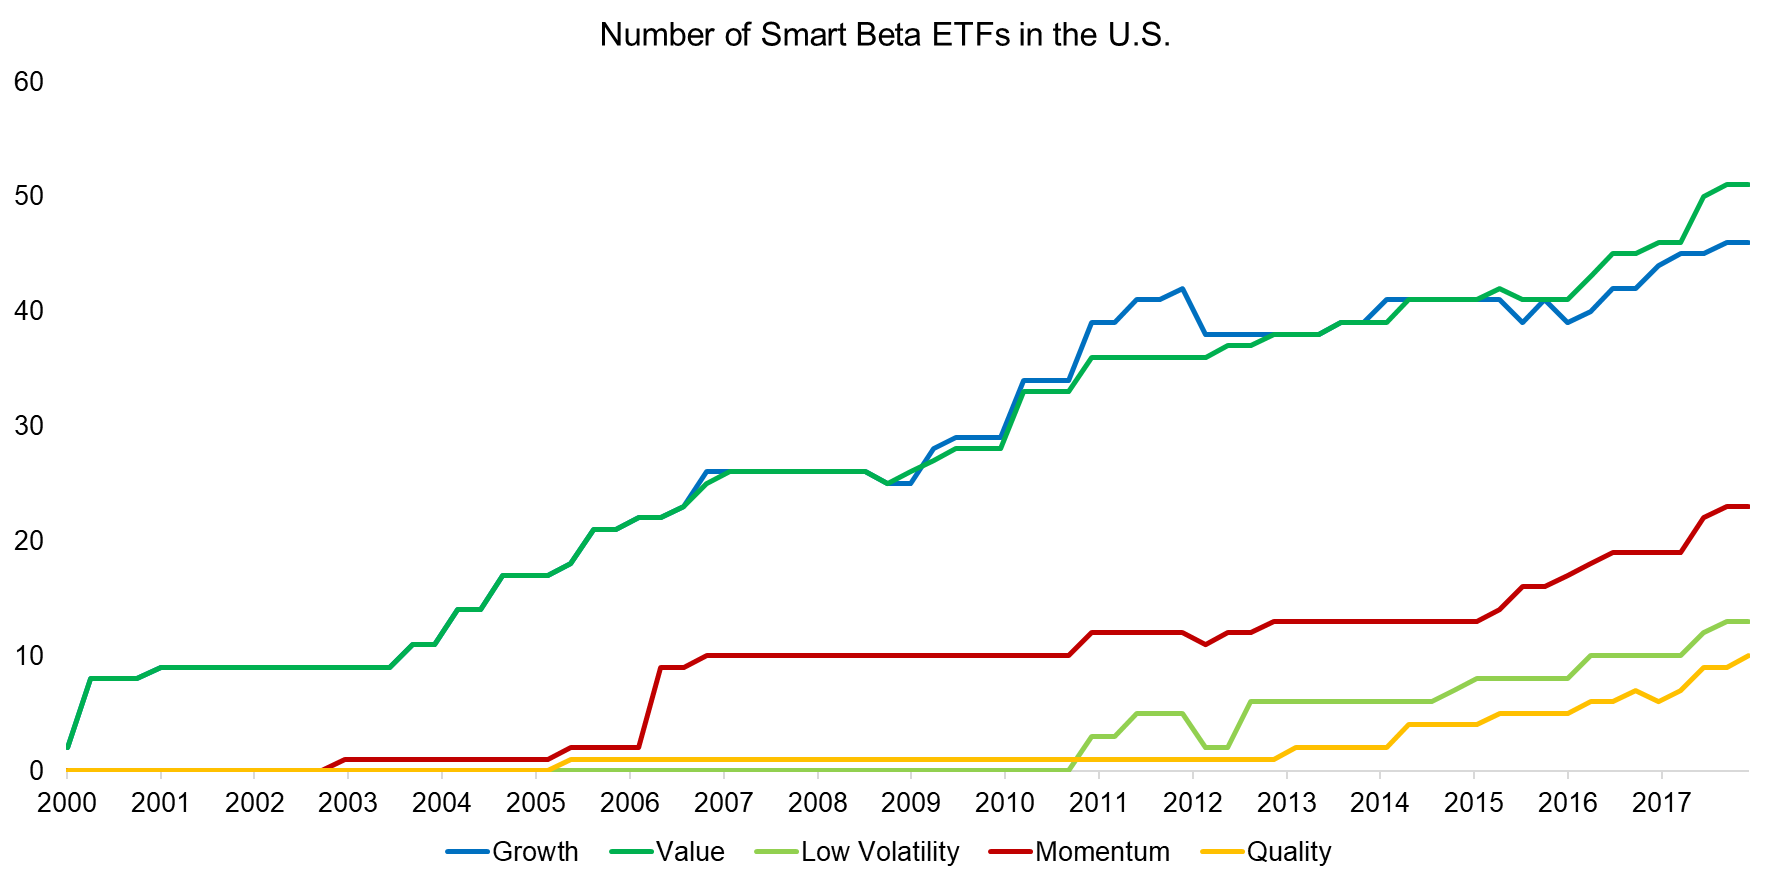
The dominance of Growth and Value smart beta ETFs as measured by assets under management is reflected in the number of ETFs that are available to investors. It is interesting to observe that despite plenty of support from academic research and exhibiting high historical abnormal returns, there are relatively few ETFs focused on the Momentum factor. Investors do not seem to be willing to embrace the strategy (read Smart Beta or Smart Marketing).
Source: FactorResearch
BENCHMARKING SMART BETA ETFS
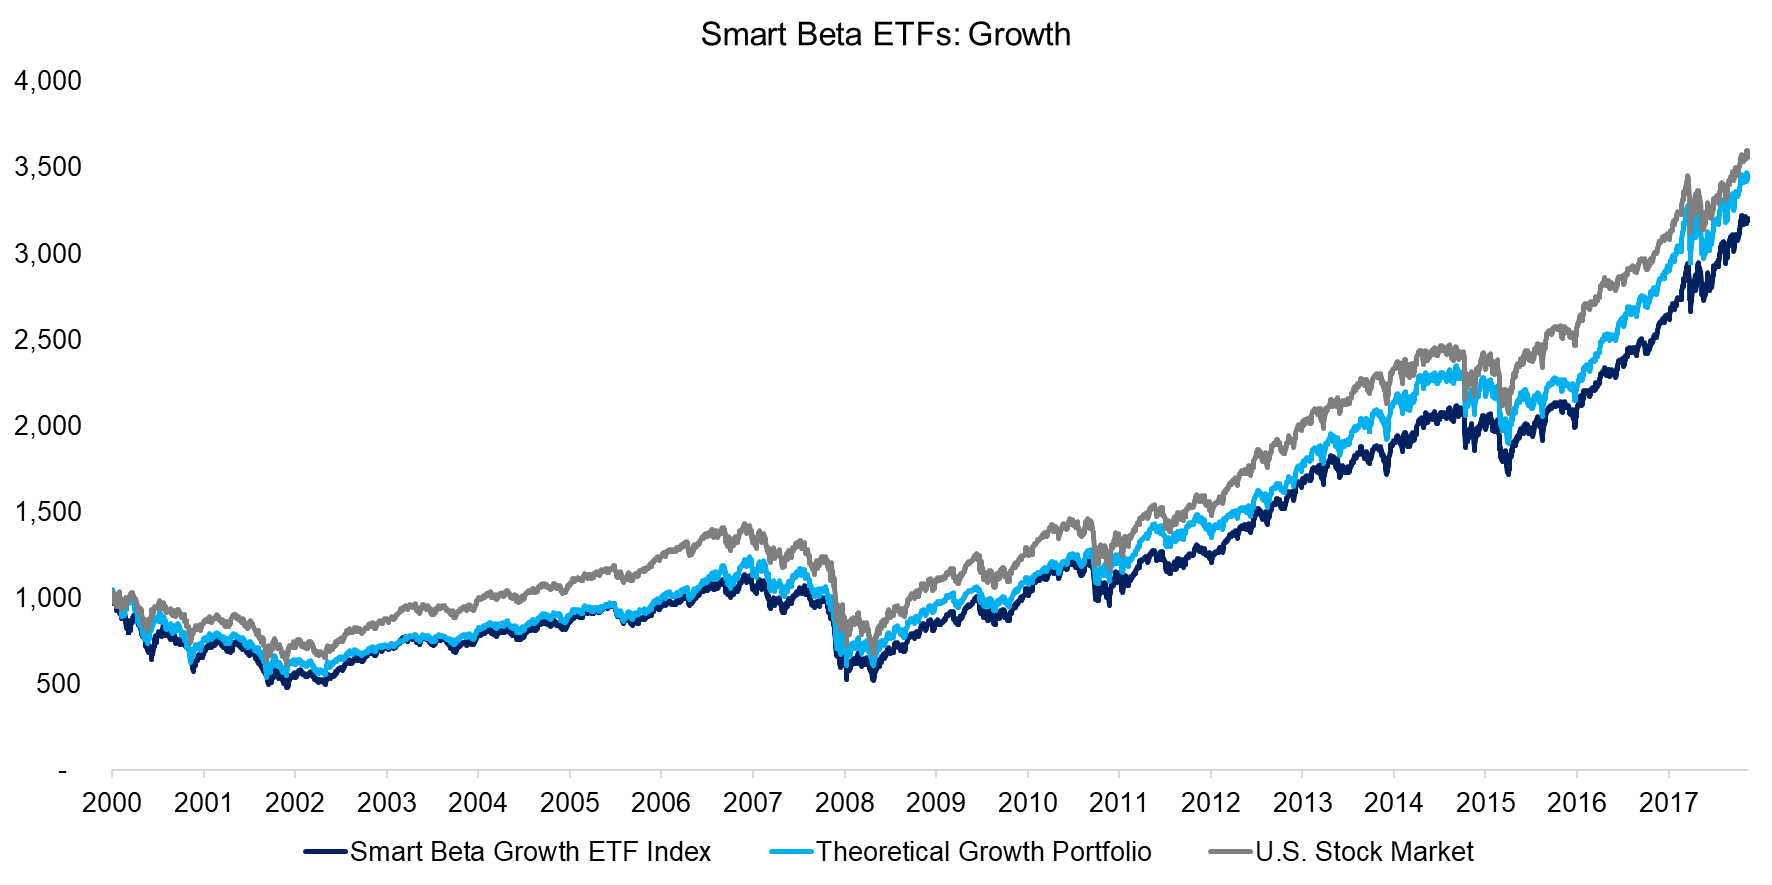
We create a Smart Beta Growth ETF Index by equally-weighting the returns of all traded smart beta Growth ETFs and a theoretical long-only Growth factor portfolio, which includes the top 30% of U.S. stocks ranked by a combination of the three-year sales and earnings growth. The analysis highlights that the index and theoretical portfolio have tracked each other closely since 2000, indicating that the smart beta ETF providers are likely using relatively similar definitions for the Growth factor.
We observe that Growth underperformed the market from 2000 to 2007, which partially reflects the implosion of the Tech bubble. In recent years the theoretical growth portfolio outperformed the market, although this was not the case for the Smart Beta Growth ETF Index.
Source: FactorResearch
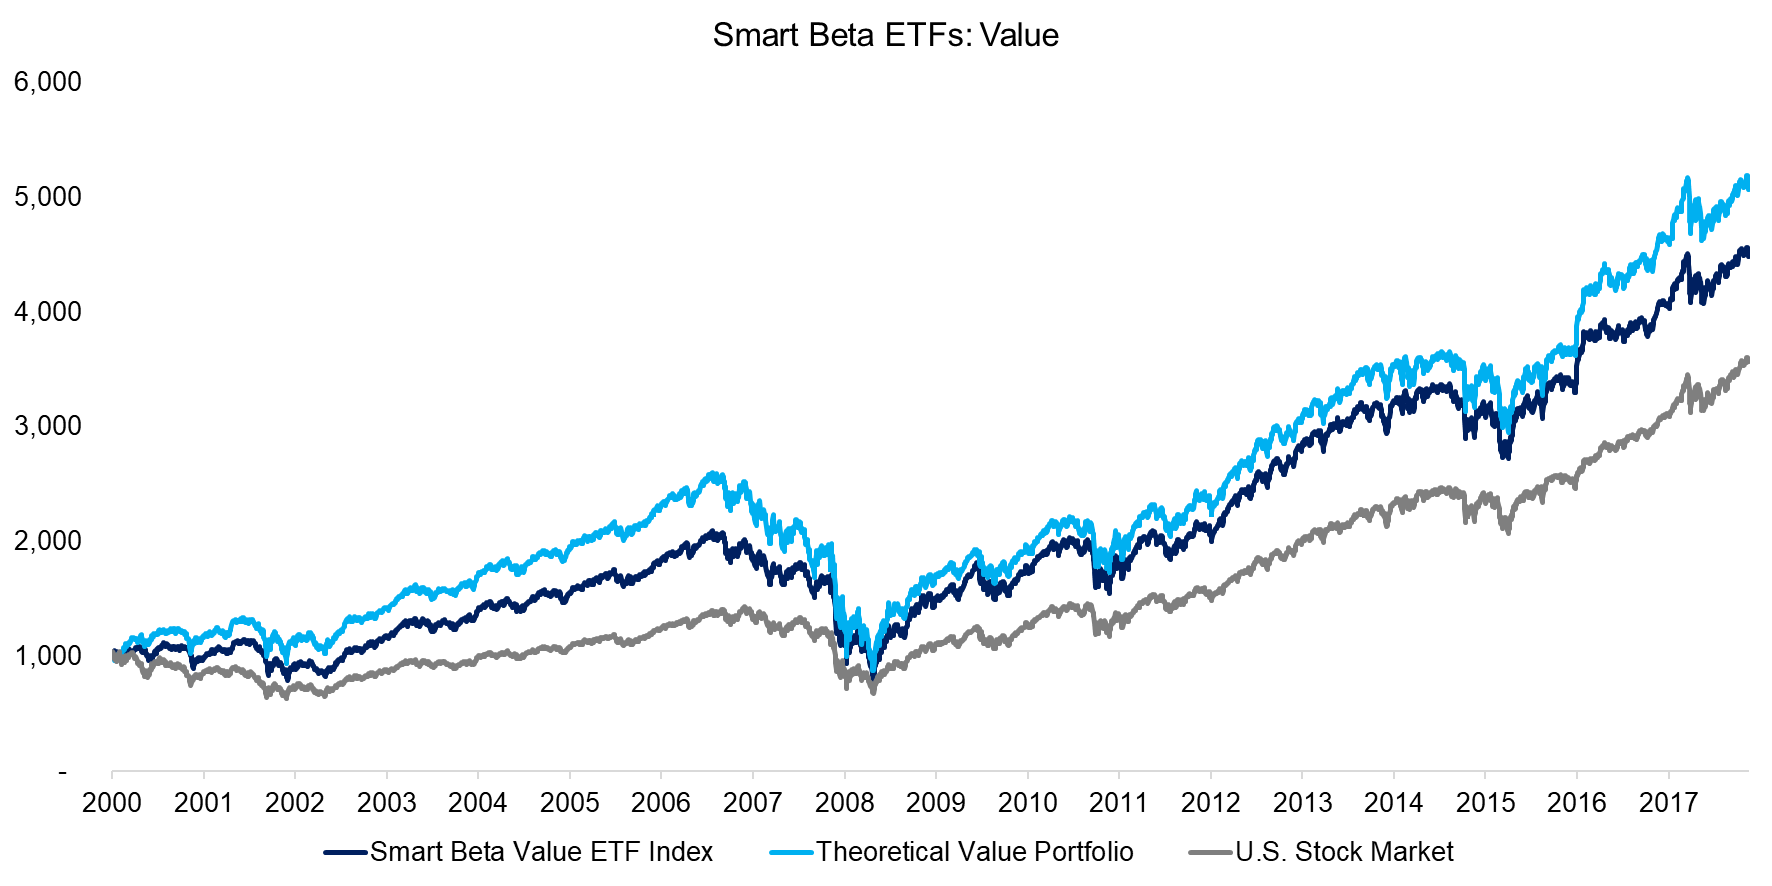
Given that Value partially represents the inverse of Growth, we observe an outperformance to the market from 2000 to 2007. In contrast to the Growth factor, we observe occasional large discrepancies between the Smart Beta Value ETF Index and the theoretical Value portfolio.
We define Value as a combination of price-to-book and price-to-earnings multiples, which is comparable to factor investing literature. However, other metrics like EV / EBITDA and cashflow-based multiples are also frequently used, which may explain the differences in performance.
Source: FactorResearch
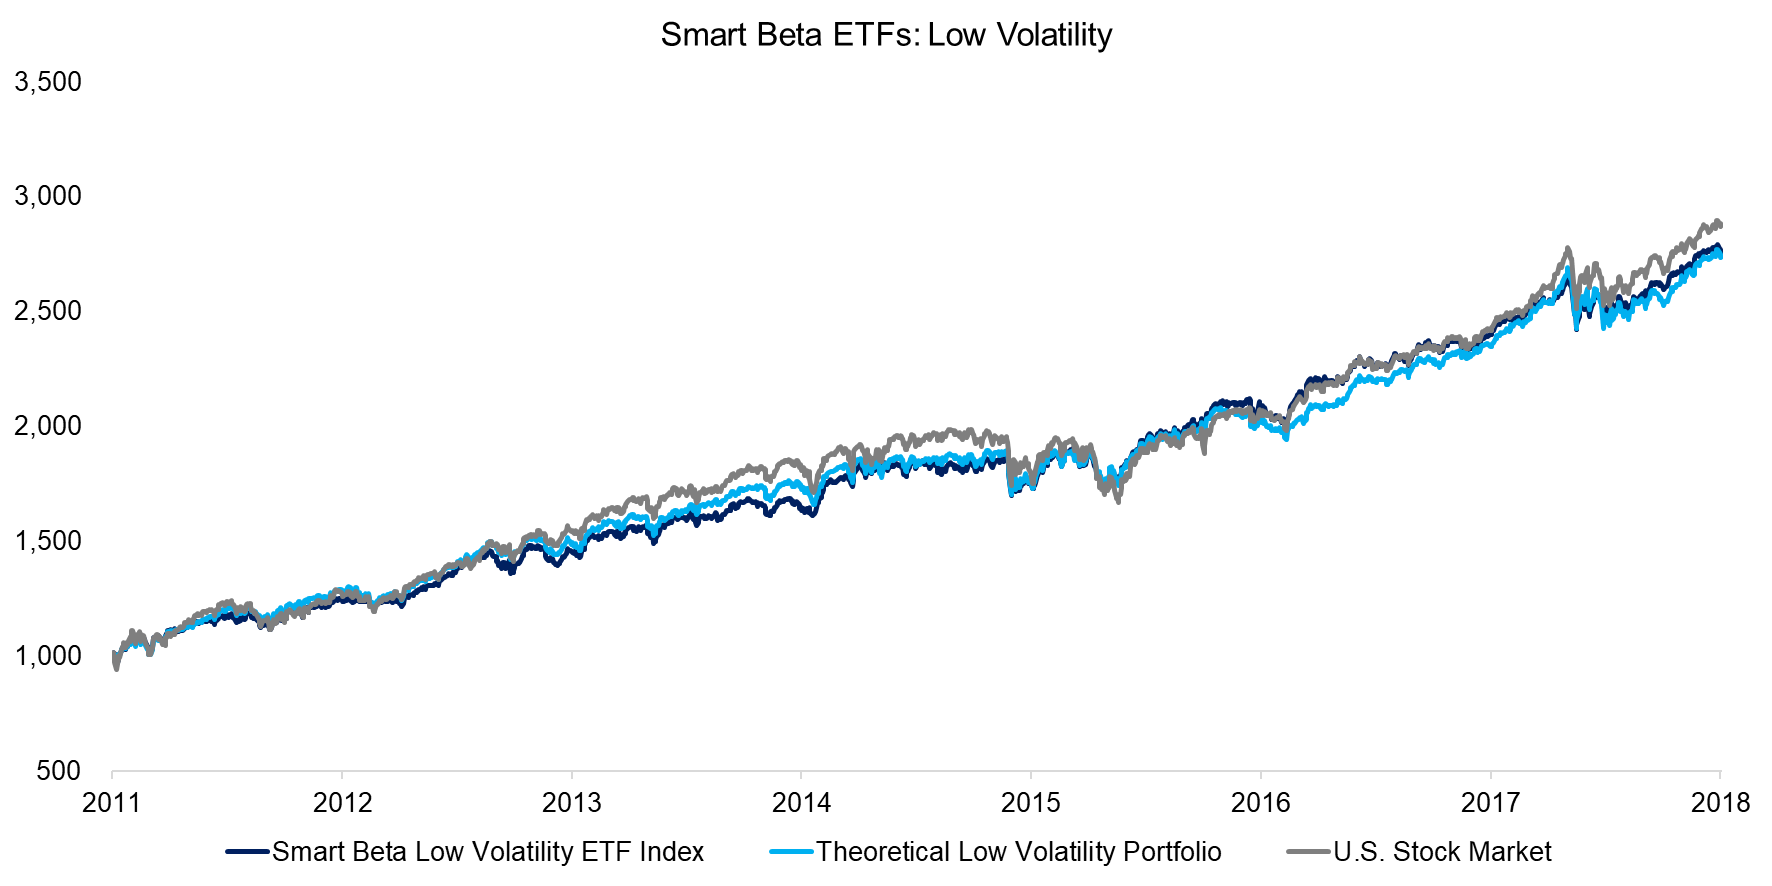
The Low Volatility factor has only started featuring more prominently in investors’ portfolios after the Global Financial Crisis, where Low Volatility stocks outperformed. The first smart beta ETFs focused on the Low Volatility factor were launched in 2011 and since then there was no bear market in the U.S. stock market, which reflects in the performance of the portfolios.
We observe that the stock market outperformed the Smart Beta Low Volatility ETF Index and theoretical Low Volatility portfolio, except when markets experienced drawdowns like in August 2016. It would likely require a prolonged and severe market correction for Low Volatility stocks to show a meaningful outperformance.
Source: FactorResearch
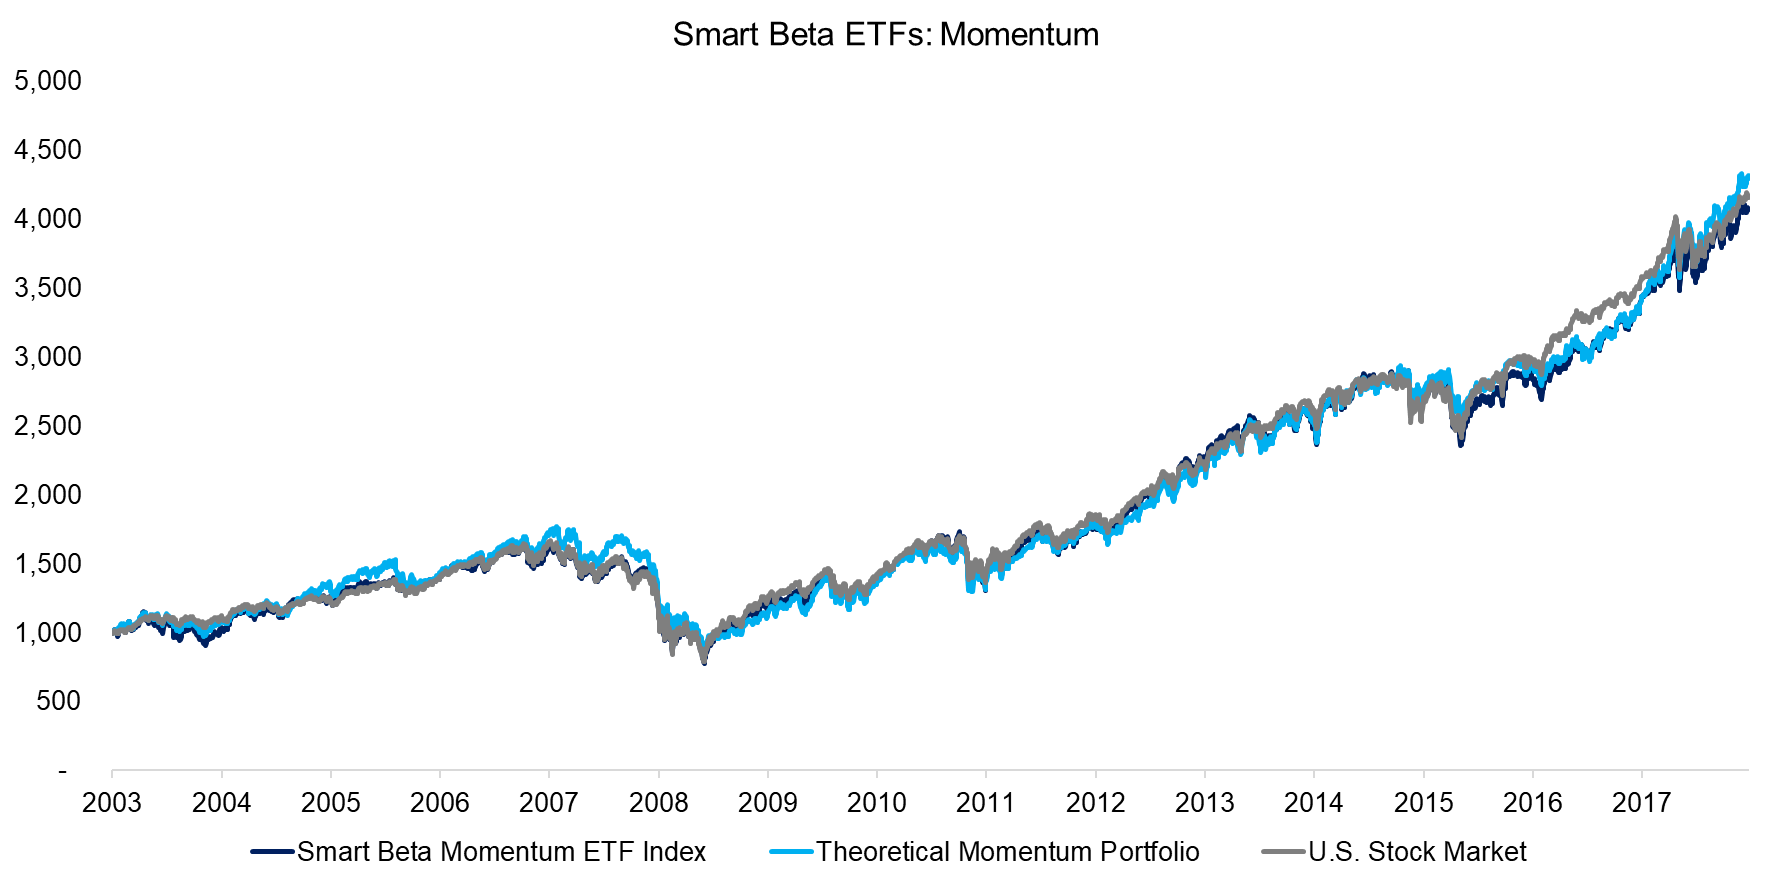
The Momentum factor has not generated positive excess returns in the form of a long-short portfolio and the analysis highlights a similar lack of performance for the long-only version. The performance of the Smart Beta Momentum ETF Index, the theoretical Momentum portfolio, and the market are almost identical since 2003.
Some market participants argue that the lack of performance explains why investors have allocated so few assets to this smart beta category. However, the Value factor has also not generated positive returns in the last decade and remains popular in terms of assets under management. Investors likely struggle with the simplicity of Momentum, which requires only a few computations and no knowledge of finance or accounting.
Source: FactorResearch
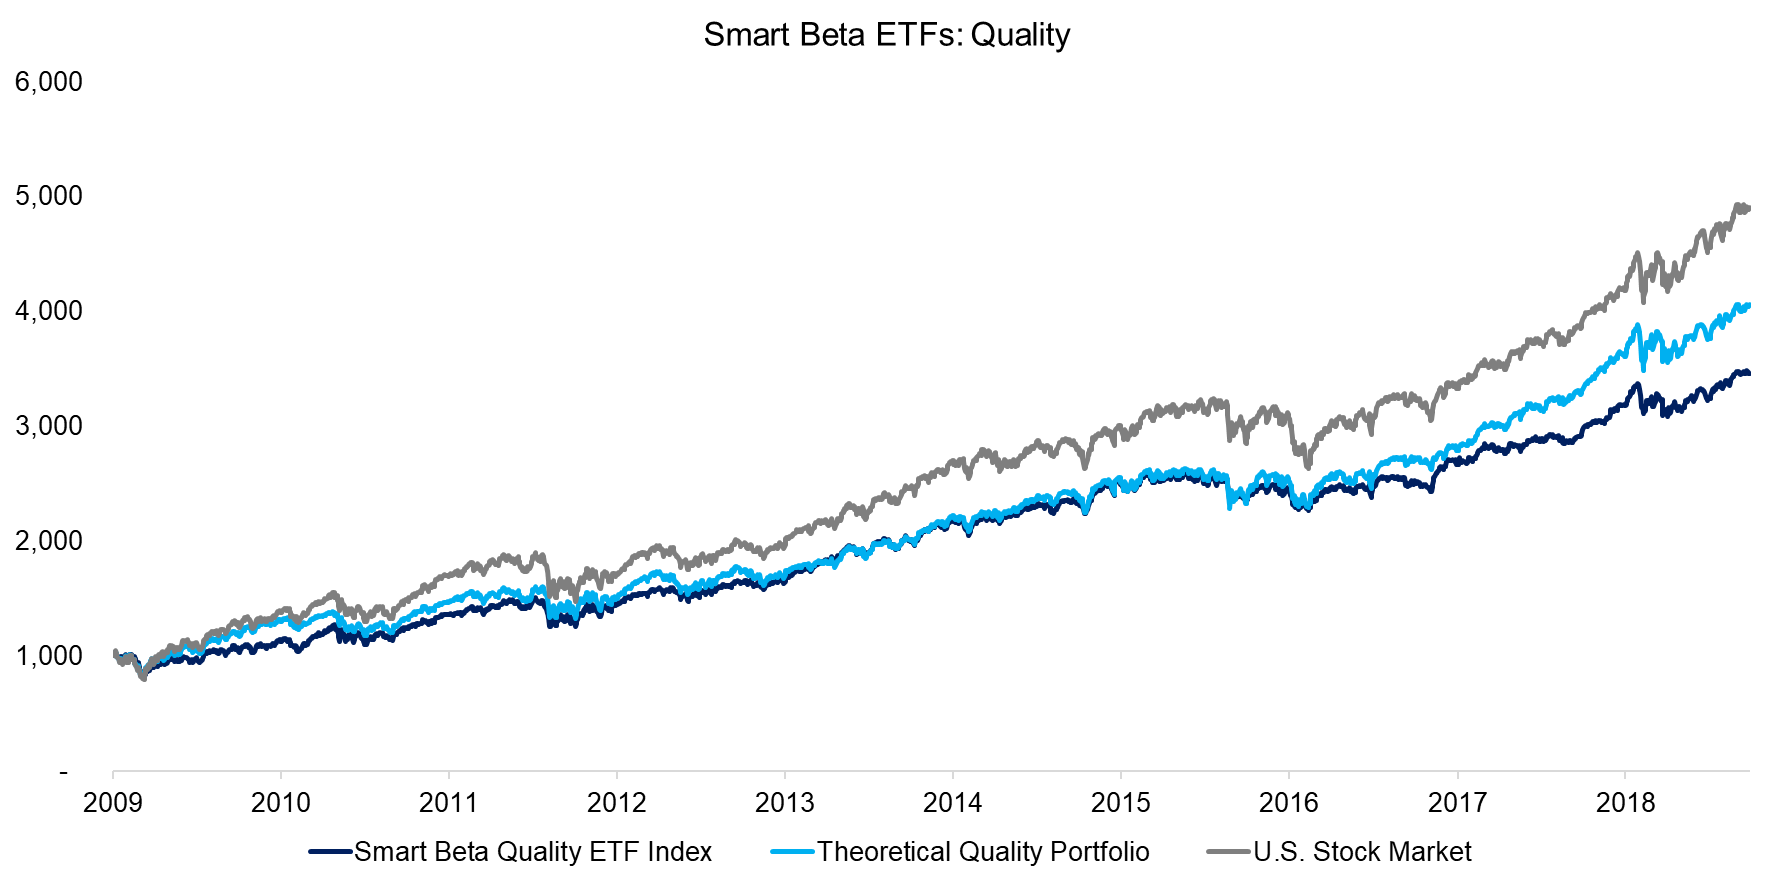
The Smart Beta Quality ETF Index tracked the theoretical Quality portfolio from 2009 to 2017, but underperformed thereafter. The rising difference in performance is perhaps explained by an increase in Quality ETFs in recent years, which likely feature different factor definitions. We define Quality as a combination of return-on-equity and debt-over-equity, but definitions are quite diverse for this factor.
We observe that the market outperformed the Quality factor since 2009, which is to be expected. Quality stocks tend to have betas below 1, so underperform in rising markets.
Source: FactorResearch
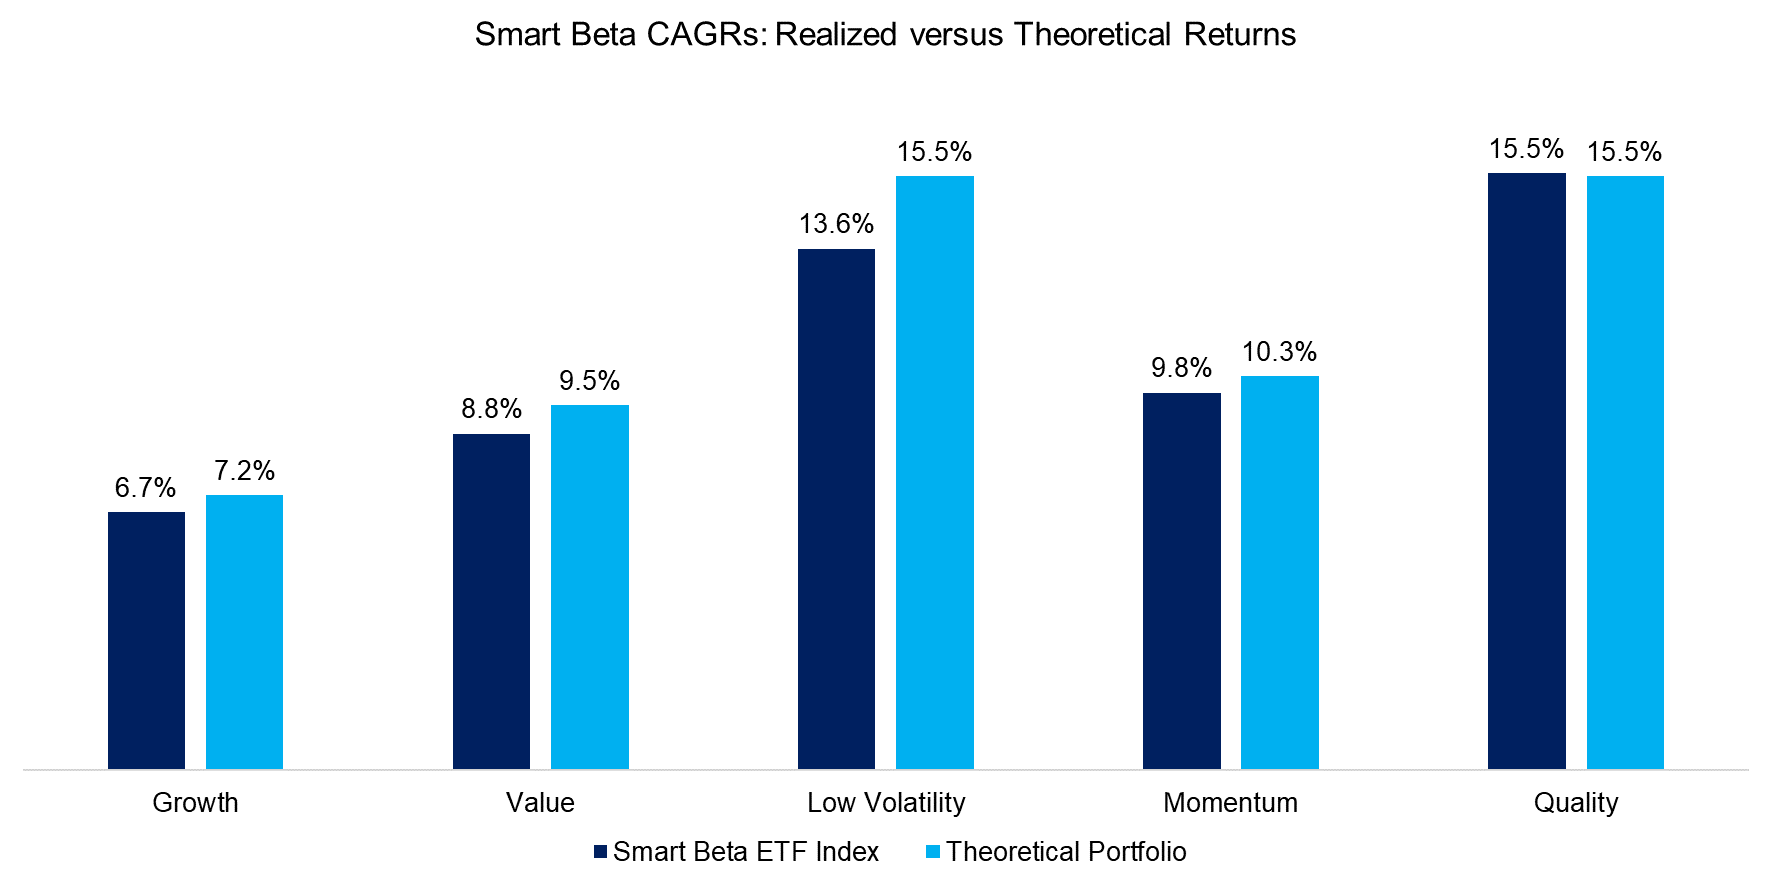
Finally, we compare the CAGRs of all Smart Beta ETF indices to their theoretical benchmark portfolios. Given different starting points, which depend on when smart beta ETFs were first launched, the CAGRs differ across categories. We notice that the Smart Beta ETF indices show lower returns than the theoretical benchmark portfolios, but that can partially be explained by the lack of management fees for the theoretical portfolios. Broadly speaking smart beta ETFs are generating performance similar to the theoretical portfolios, i.e. are in line with investors’ expectations.
Source: FactorResearch
FURTHER THOUGHTS
This short research note benchmarks smart beta ETFs to theoretical long-only factor portfolios and highlights similar performance. However, as we discussed in previous research notes, there tends to be a difference between excess returns from smart beta and long-short factor returns as seen in research papers. Investors would gain from long-short factor-based ETFs as these would not only allow to harvest factor returns more efficiently, but also provide attractive diversification benefits for a long-only equity portfolio.
RELATED RESEARCH
ABOUT THE AUTHOR
Nicolas Rabener is the CEO & Founder of Finominal, which empowers professional investors with data, technology, and research insights to improve their investment outcomes. Previously he created Jackdaw Capital, an award-winning quantitative hedge fund. Before that Nicolas worked at GIC and Citigroup in London and New York. Nicolas holds a Master of Finance from HHL Leipzig Graduate School of Management, is a CAIA charter holder, and enjoys endurance sports (Ironman & 100km Ultramarathon).
Connect with me on LinkedIn or X.

