Building a Long Volatility Strategy without Using Options – III
A systematic approach to creating portfolio protection
August 2021. Reading Time: 10 Minutes. Author: Nicolas Rabener.
SUMMARY
- Long volatility strategies can be built without using options
- Securities can be selected on different risk metrics like the VIX or high yield spread
- Although portfolios differ, the strategies exhibited similar trends
INTRODUCTION
We started our exploration of long volatility strategies by analyzing the Eurekahedge Long Volatility Hedge Fund Index and highlighted that this would have provided investors with attractive diversification benefits since 2004. However, the index suffers from survivorship bias and requires investors to conduct due diligence on mostly complex option-based strategies, which are rather unattractive features (read Building a Long Volatility Strategy without Using Options).
Manager selection is already difficult when comparing fund managers pursuing simple U.S. large-cap strategies, and it does not become easier with higher complexity. Given this, we investigated creating systematic and simple long volatility strategies without using options. The approach was to select asset classes based on their correlation to the VIX, which resulted in portfolios primarily comprised of certain currency pairs and government bonds.
However, the VIX is a difficult time series to work with given its extreme volatility and limited data history. It has caused the downfall of many models and managers. In this research note, we will explore other risk indicators for creating a systematic long volatility strategy without using options.
CONSTRUCTING A DYNAMIC & SYSTEMATIC LONG VOLATILITY STRATEGY
We continue to use the same framework as in our previous research papers and select securities from a set of 59 indices that essentially comprises all available asset classes – equities, bonds, commodities, and currencies. The security selection process focuses on selecting the top 5% of indices, i.e. three securities that are most highly correlated to risk sentiment. We use a one-year lookback for calculating the correlation and use the securities from a week ago to achieve a realistic strategy implementation (read Building a Long Volatility Strategy without Using Options – II).
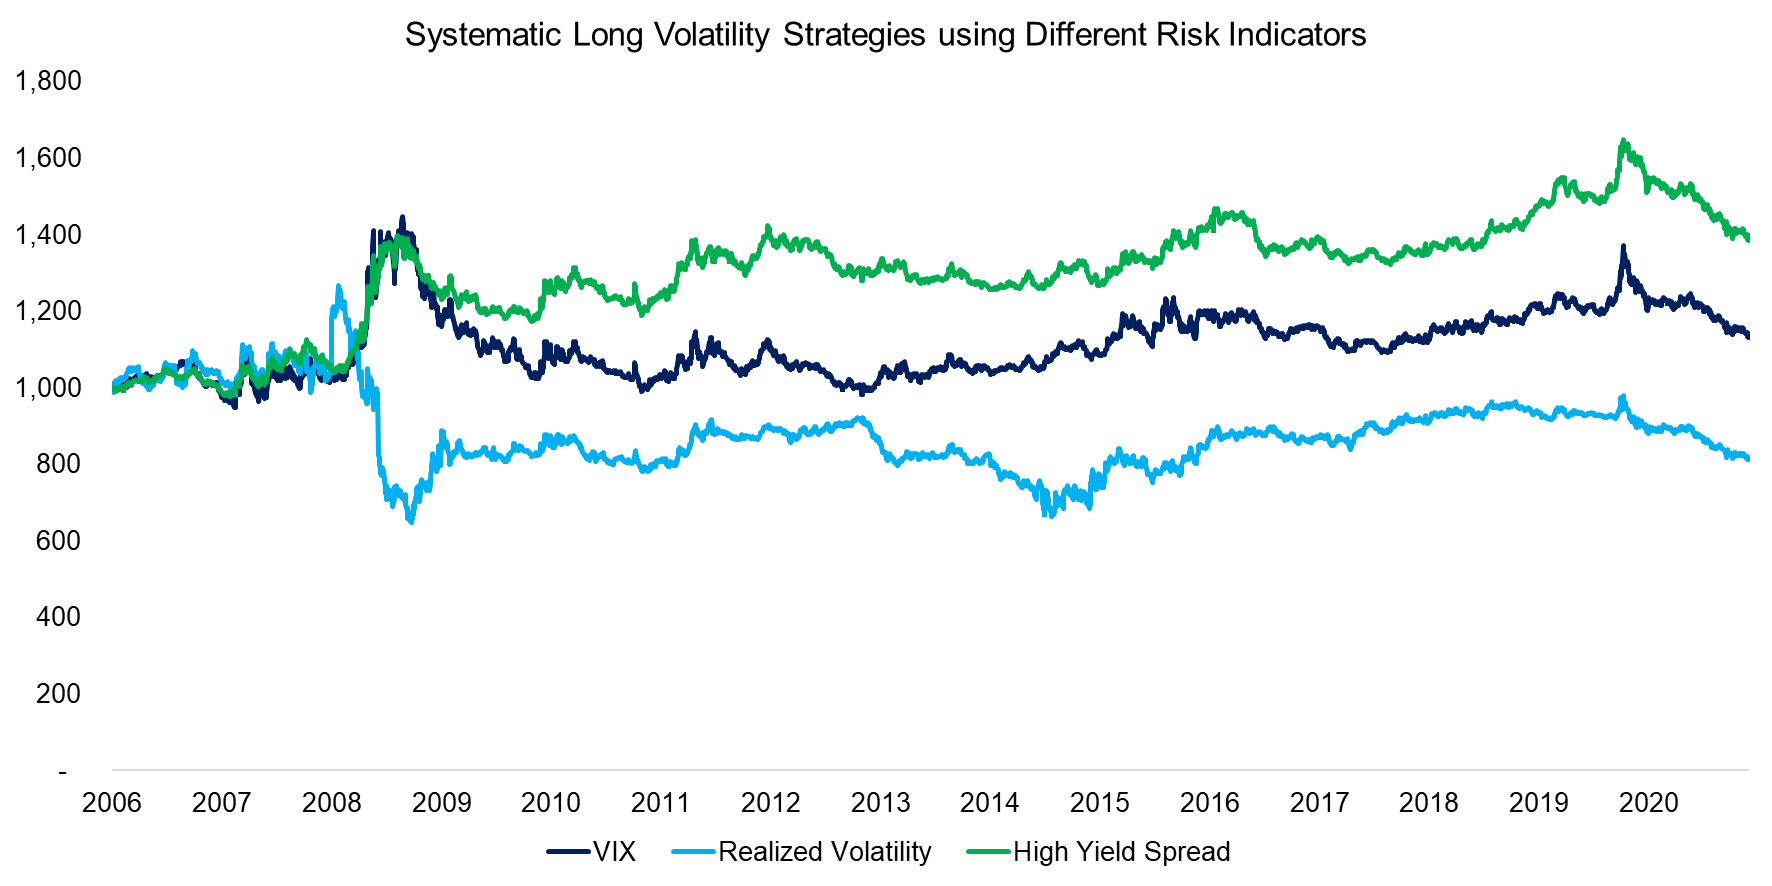
Instead of just using the VIX as a risk indicator, we expand the analysis to include realized volatility and the U.S. option-adjusted high yield spread to treasuries. We observe that although the returns of the three systematic long volatility strategies were different over the period from 2006 to 2021, the trends in performance were similar.
Source: FactorResearch
LONG VOLATILITY STRATEGIES: BREAKDOWN BY ASSETS
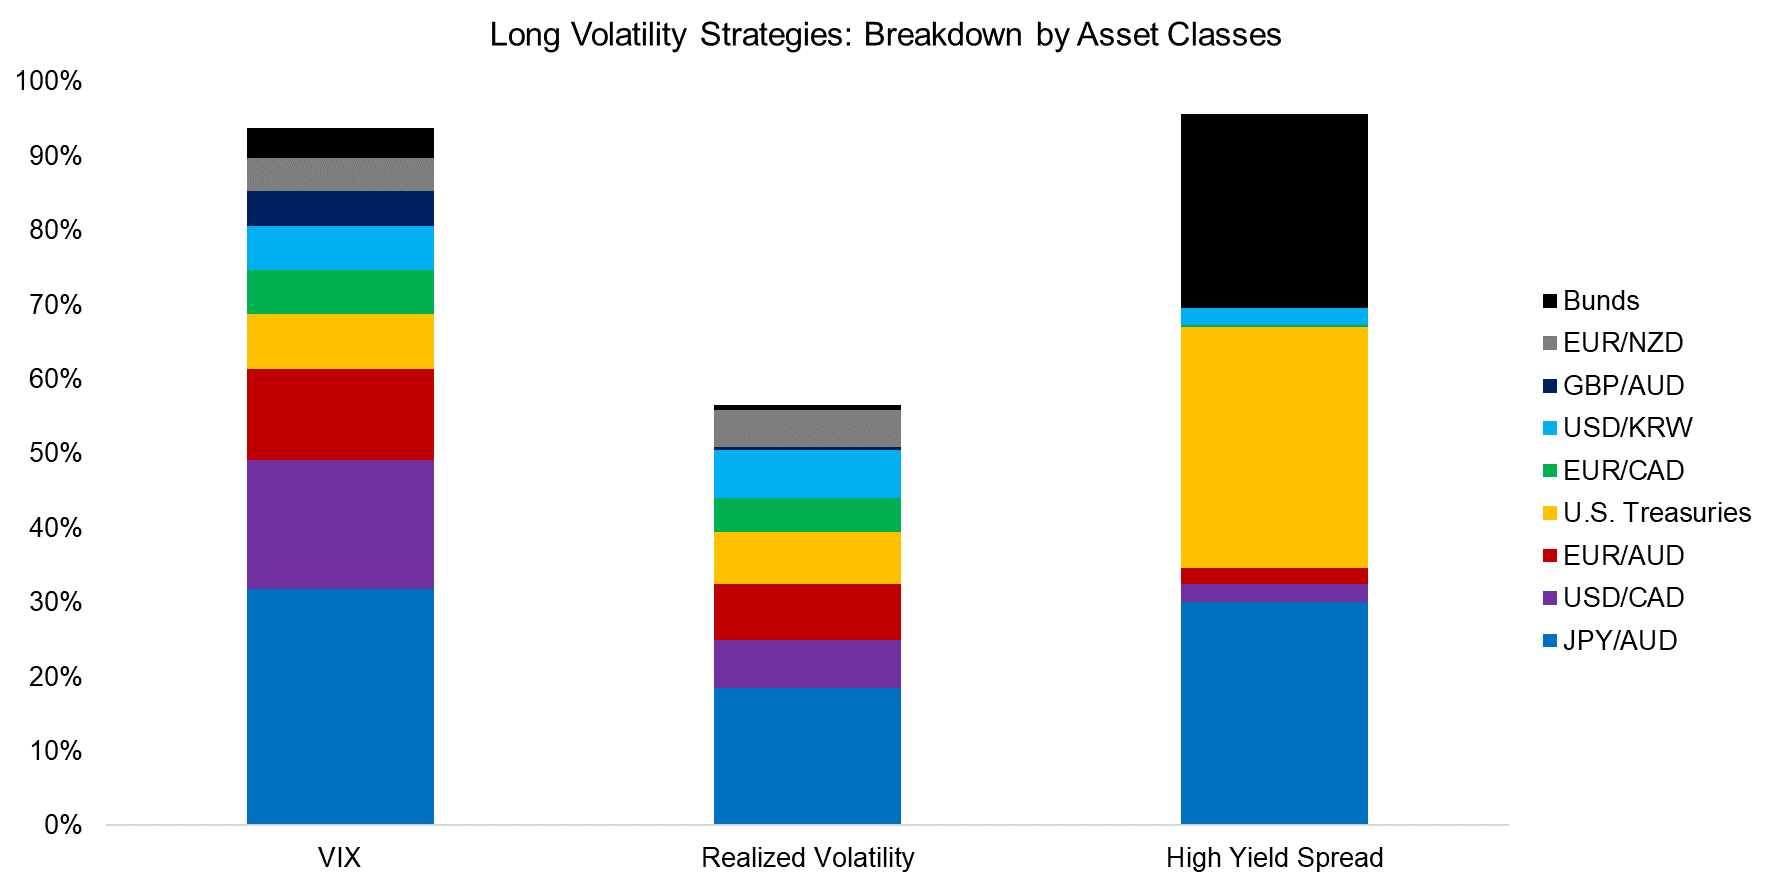
Given the similarities in performance, we would expect that the portfolios exhibited the same exposures to asset classes. Broadly speaking this assumption is correct as all three portfolios were almost exclusively comprised of currency pairs and government bonds.
However, the portfolios differed in their composition of these safe-haven instruments, e.g. the portfolio based on the high yield spread had basically only three constituents: German bunds, U.S. treasuries, and JPY / AUD, which made up the portfolio 89% of the time. The long volatility portfolio based on realized volatility was much more diverse and had exposure to significantly more indices over time.
Source: FactorResearch. We only show indices that contributed more than 5% to the portfolio on average.
RISK INDICATORS: CHANGE IN VALUES VS ABSOLUTE LEVELS
In our most recent research note on long volatility, we tested the sensitivity of the long volatility strategy to the assumptions in the last research note, e.g. by calculating the correlation to the VIX using a three-month, one-year, or three-year lookback. Overall we noted that the model was fairly robust to the changes in assumptions.
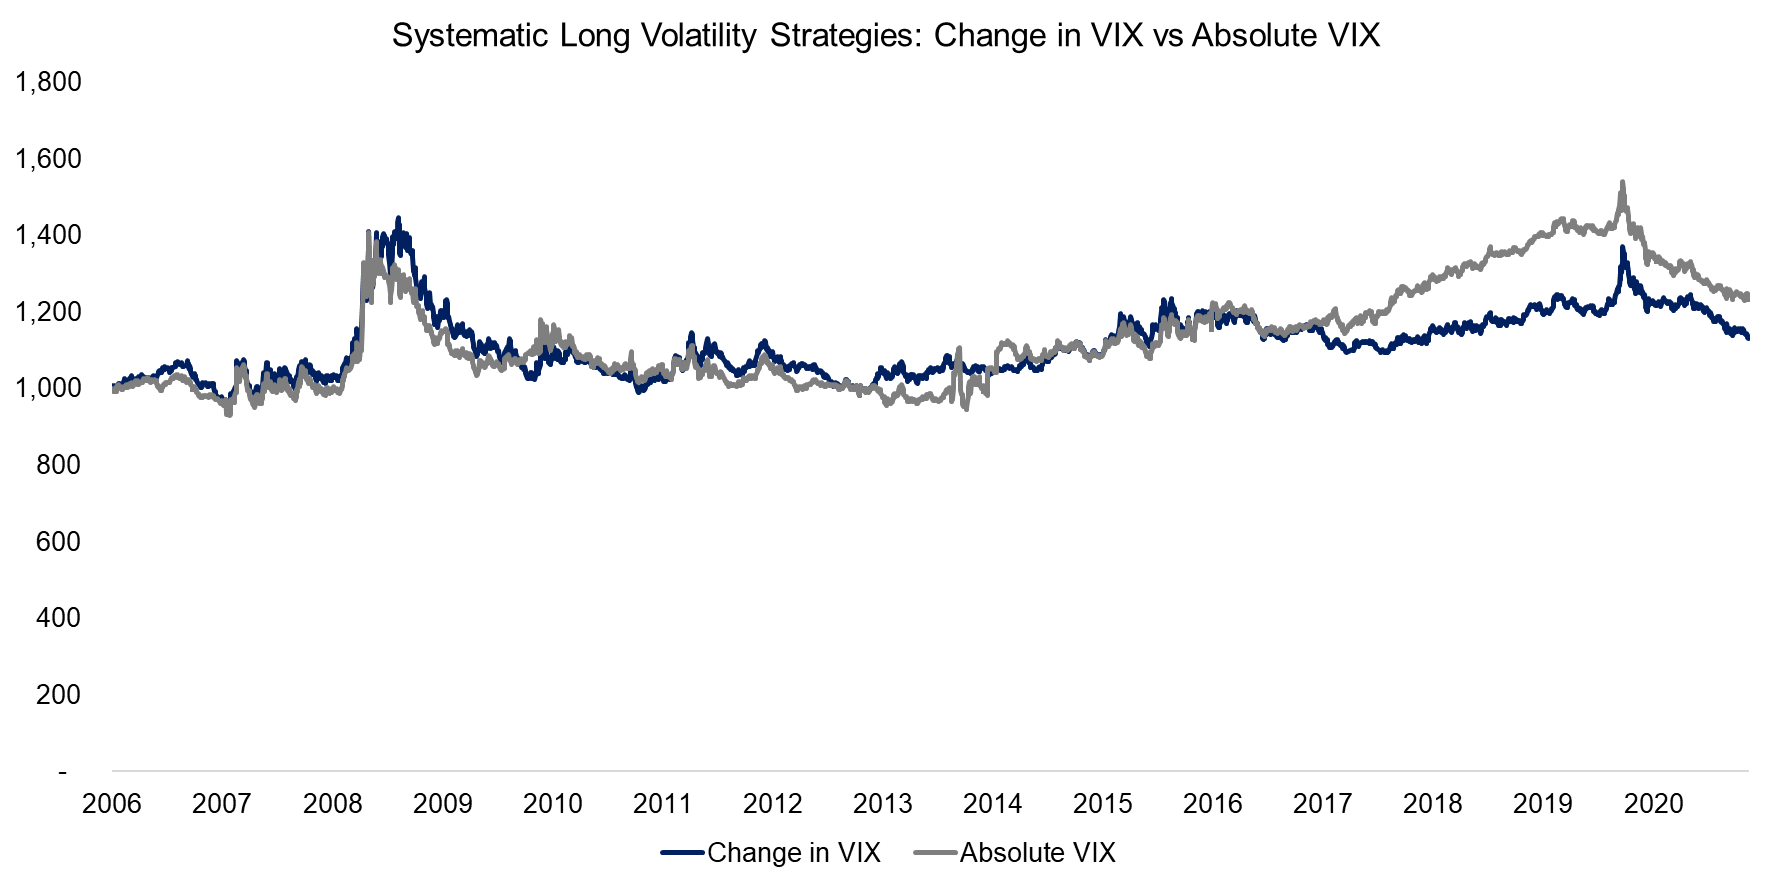
When calculating the correlation of two securities, we should use the returns rather than absolute values. Having said this, with regards to the VIX, which is already expressed in percentage points, this would have made only a minor difference.
Source: FactorResearch
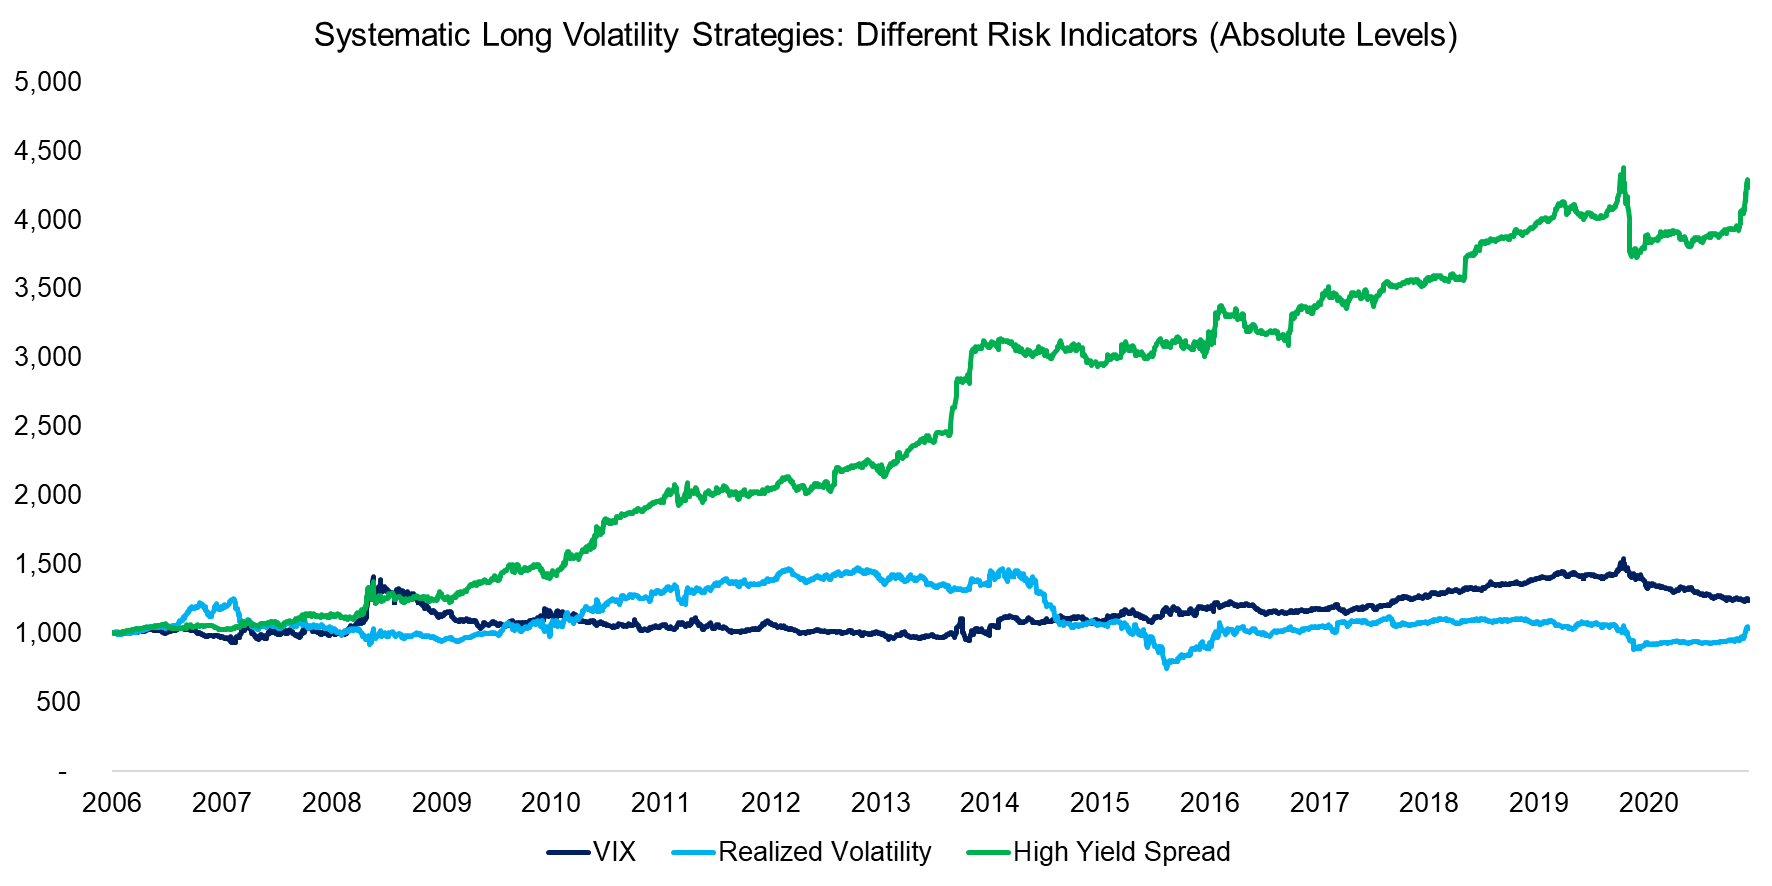
The performance of the long volatility portfolios based on the correlation to the VIX or realized volatility is almost identical when using the changes in the risk indicators rather than their absolute values. However, the profile of the high yield spread portfolio changed significantly and generated almost consistently positive returns.
Source: FactorResearch
Looking at the high risk-adjusted returns of the portfolio based on the high yield spread should have the alarm bells of every quant ringing. Have we stumbled across something truly interesting, or is there some hindsight bias that explains the attractive returns?
When we contrast the breakdown of the portfolios by assets then this highlights a more diverse portfolio when using the absolute levels of the high yield spread rather than the changes in it. The portfolio has become far more diverse, although that does not explain the strong performance.
The model is relatively simple and the only change in input is the high yield data, which implies a relatively low model risk. An average across the returns of all asset classes would have returned random performance with a zero performance, as it should. Partially the returns can be attributed to the bond positions, which made up approximately 40% and performed strongly given the bull market in fixed income. However, we do not have a firm conclusion yet and will conduct further research.
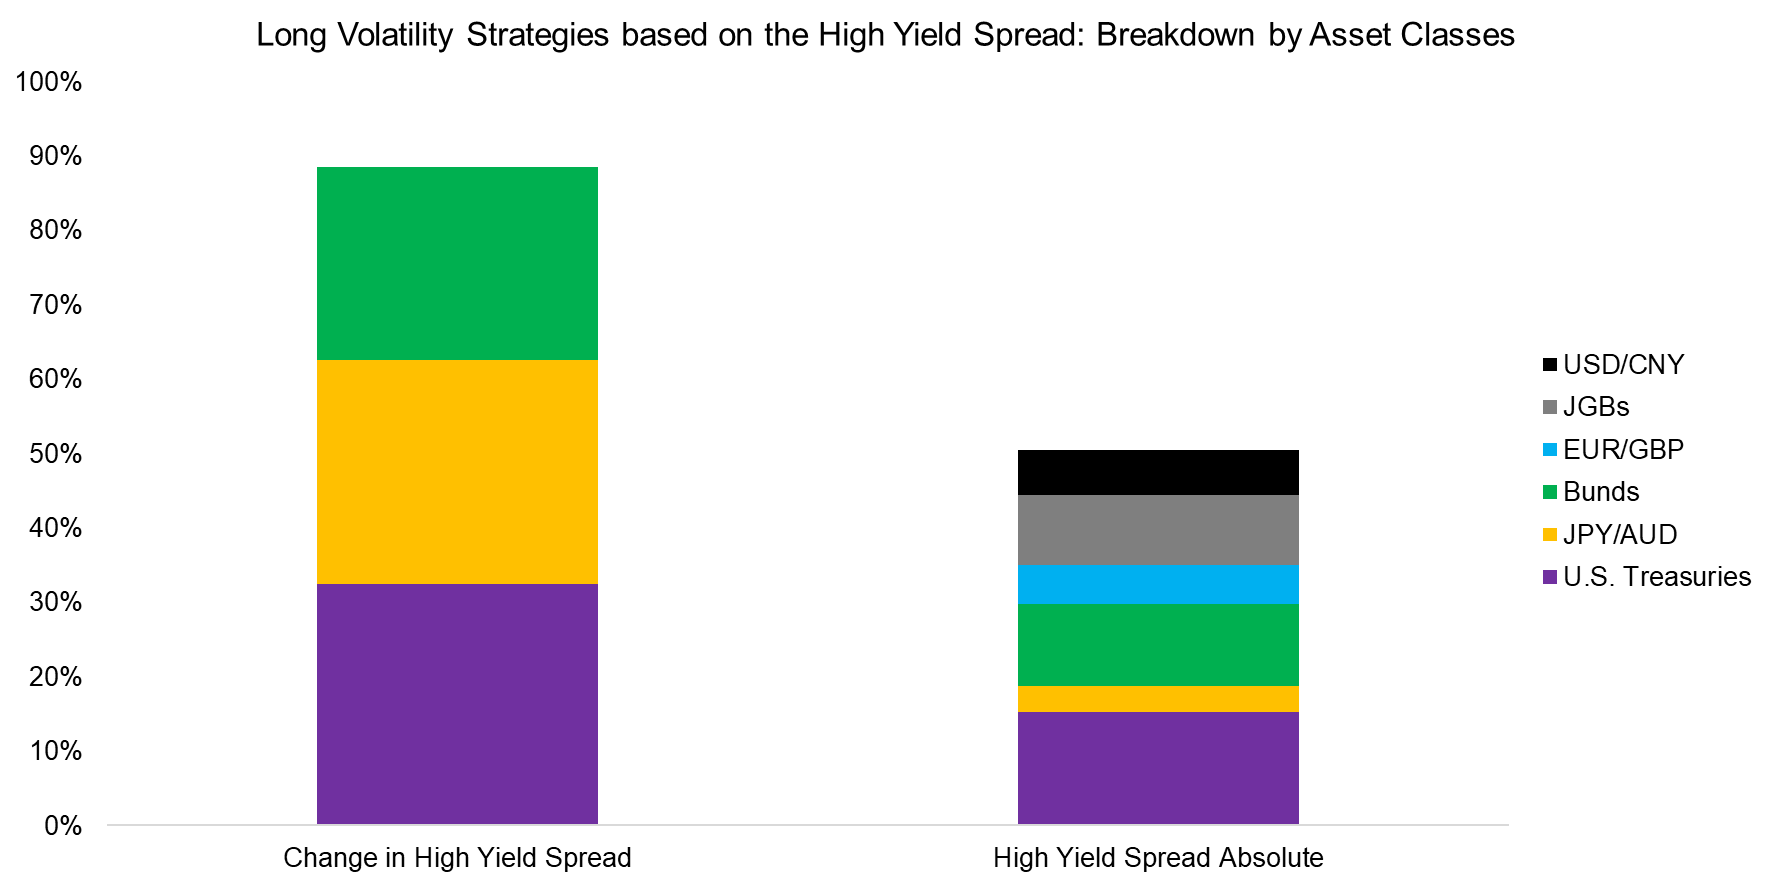
Source: FactorResearch. We only show indices that contributed more than 5% to the portfolio on average.
DIVERSIFICATION BENEFITS FROM LONG VOLATILITY STRATEGIES
Using only the VIX creates an undesirable dependency on one variable. Financial markets are full of surprises and we can mitigate this model risk by creating a multi-metric approach that selects securities correlated to changes in the VIX, realized volatility, and the high yield spread.
The return profile of the multi-metric long volatility portfolio does not change significantly compared to the single-metric portfolios, but it seems a more robust approach. If an investor would have allocated to such a long volatility portfolio, then this would have increased the risk-adjusted returns of an equities portfolio in the period from 2006 to 2021 given a largely negative correlation between stocks and volatility. The return would have decreased slightly, but the maximum drawdown would have declined even further.
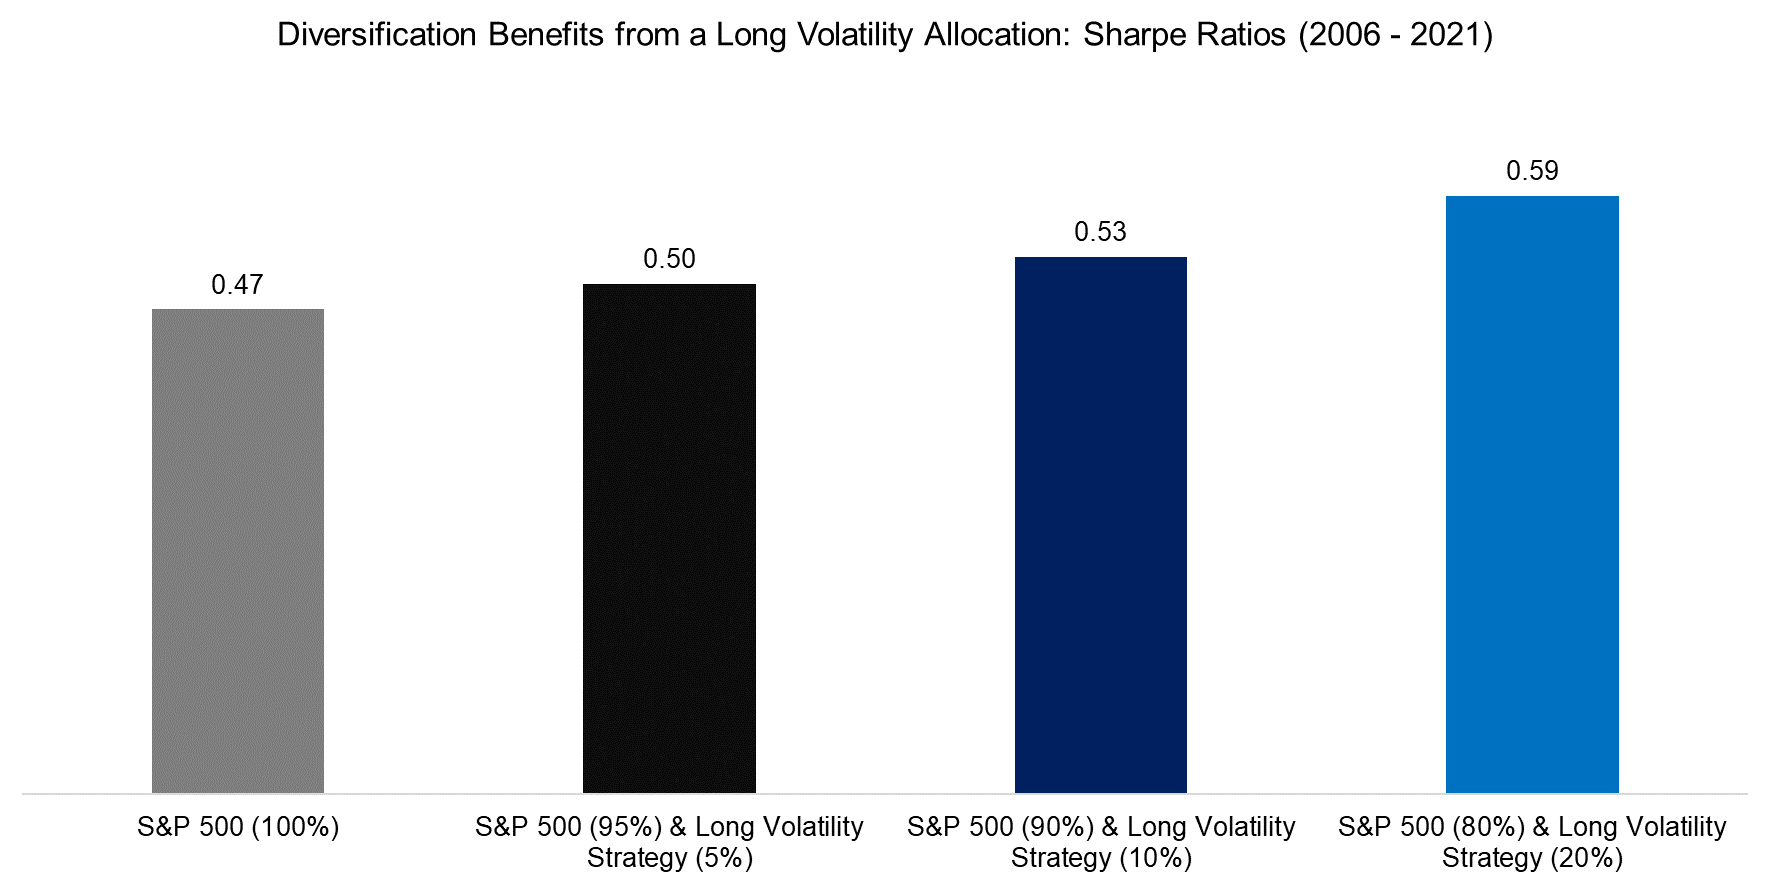
Source: FactorResearch
FURTHER THOUGHTS
As we continue to explore long volatility strategies it seems that relatively simple strategies can be built without using options. Perhaps these lack the explosive character of long volatility strategies offered by hedge funds, but they are cheap and easy to construct via futures. And they can also be made more explosive by using leverage, if desired.
Investors have a preference for complex over simple strategies as intuitively something more sophisticated is assumed to be better. Asset managers exploit this behavioral bias as they also prefer complexity given higher fees on complex products. Unfortunately, most research highlights little additional value from complex strategies, e.g. hedge funds.
One of the core mantras of every investor should be to continuously reduce complexity in their portfolios. Investing will never be simple, but we should strive to make it as simple as possible.
RELATED RESEARCH
60/40 Portfolios without Bonds
Creating Anti-Fragile Portfolios
ABOUT THE AUTHOR
Nicolas Rabener is the CEO & Founder of Finominal, which empowers professional investors with data, technology, and research insights to improve their investment outcomes. Previously he created Jackdaw Capital, an award-winning quantitative hedge fund. Before that Nicolas worked at GIC and Citigroup in London and New York. Nicolas holds a Master of Finance from HHL Leipzig Graduate School of Management, is a CAIA charter holder, and enjoys endurance sports (Ironman & 100km Ultramarathon).
Connect with me on LinkedIn or X.

