Building an Inflation Portfolio Using Asset Classes
Long commodities?
August 2021. Reading Time: 10 Minutes. Author: Nicolas Rabener.
SUMMARY
- An inflation-proxy portfolio can be created by combining various asset classes
- Can be implemented efficiently via futures
- Would have included primarily currency pairs, not commodities
INTRODUCTION
We recently explored using stocks to create an inflation-proxy portfolio that resulted in a collection of stocks with strong sector and factor biases. Specifically, the portfolio exhibited overweights in energy and financial stocks, perhaps as expected, as well as a long position in the value and short positions in the momentum and quality factors.
However, despite selecting stocks based on their correlation to inflation, this was not significantly higher than the correlation of the broad stock market to inflation (read Building an Inflation Portfolio Using Stocks).
Some investors like equity mutual fund managers are constrained to exclusively investing in stocks and are forced to make such bets, but most others are more flexible and can utilize the entire spectrum of asset classes, which should enable them to create a superior inflation portfolio.
In this research note, we will explore combining various asset classes to build an inflation portfolio.
CONSTRUCTING AN INFLATION PORTFOLIO
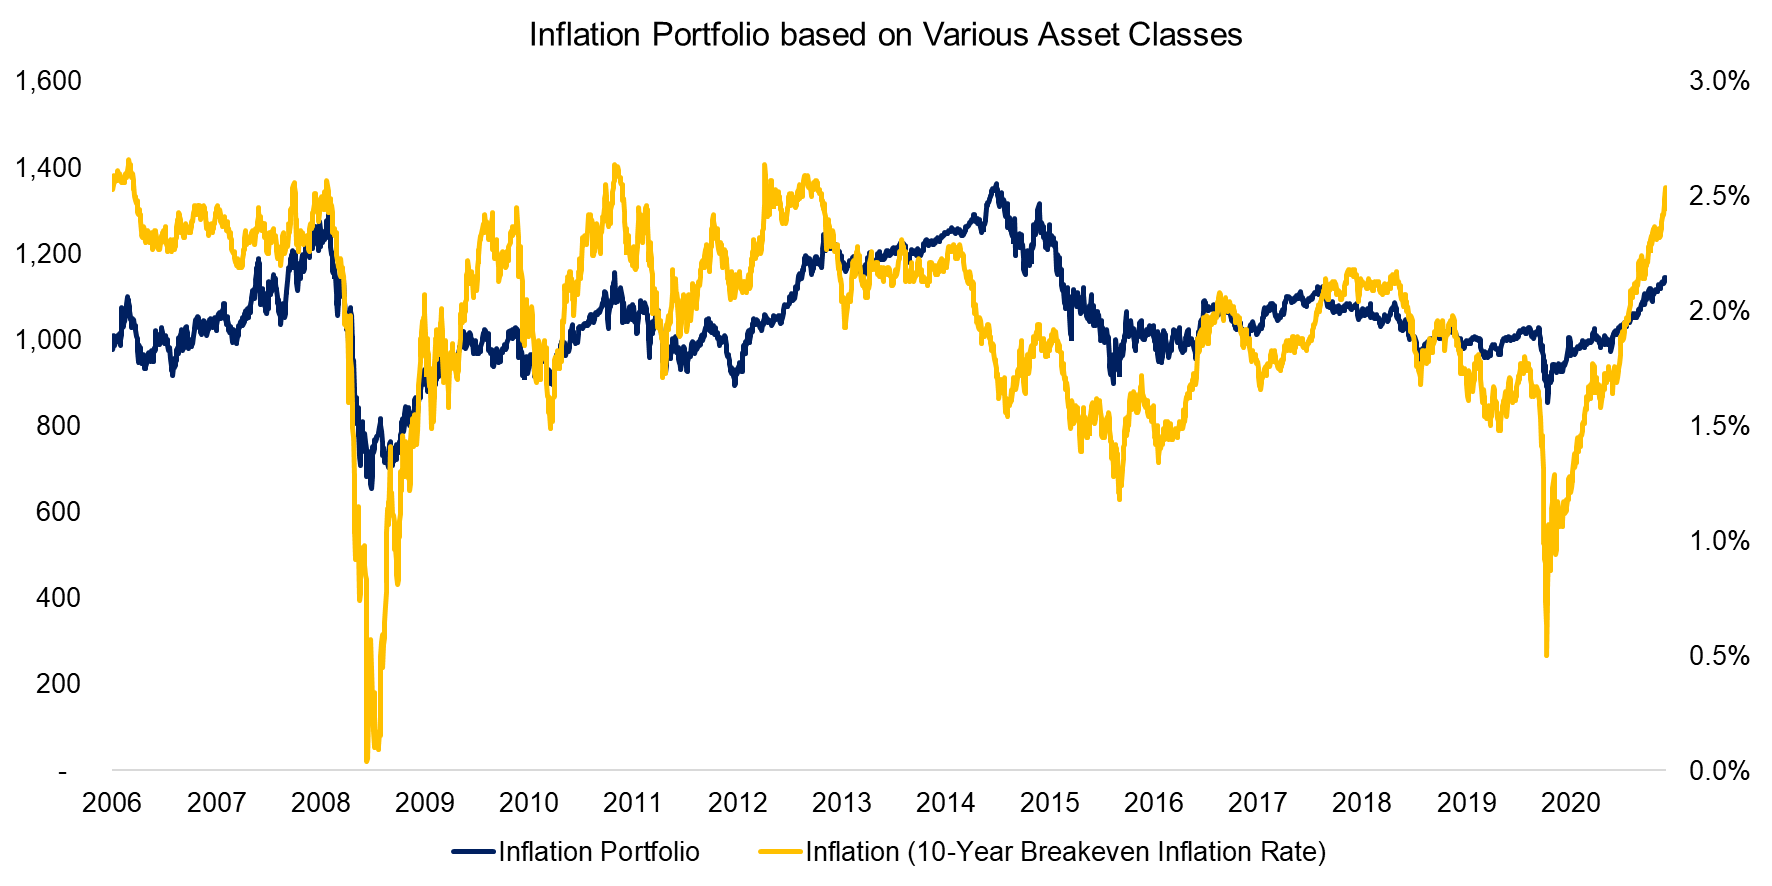
We create a framework to select asset classes from a set of 59 indices that are highly correlated to the U.S. 10-Year breakeven inflation rate using daily data and a one-year lookback. Specifically, we select the top 10% of indices that were most highly correlated, which results in a concentrated portfolio of six securities. The set of indices comprises all available asset classes – equities, bonds, commodities, and currencies.
Daily inflation data is only available since 2006, which unfortunately constraints our analysis to a period where inflation ranged between 0% and 3%, i.e. it does not include a phase of high inflation that typically worries investors.
We observe that the inflation portfolio broadly mirrored the trends of inflation. However, we should highlight that the inflation portfolio is not structured as a specific hedge against high inflation as the securities are selected based on their correlation to inflation, regardless of it increasing or decreasing. If inflation has been declining for a while, then the portfolio would likely contain securities that benefit from deflation.

Source: Inflation data from St Louis Fed, FactorResearch
INFLATION PORTFOLIO: BREAKDOWN BY ASSETS
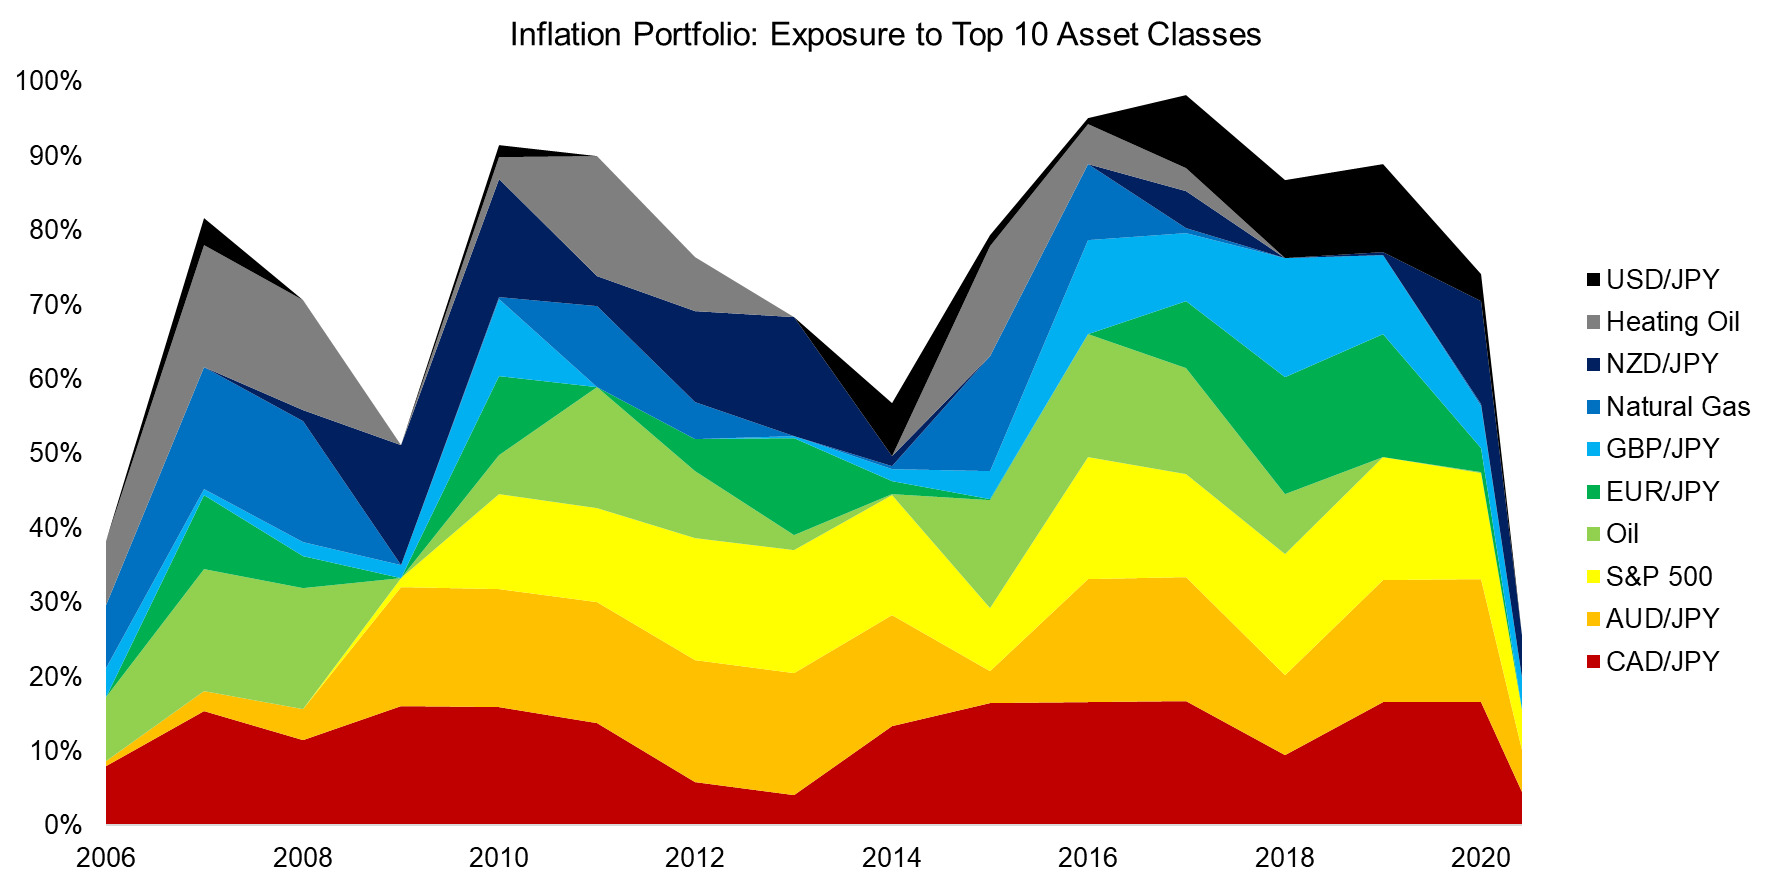
Next, we analyze the composition of the inflation portfolio by sectors. Investors might expect that the portfolio is dominated by commodities like energy or gold that are typically referenced in inflation discussions. However, although there was some exposure to heating oil, natural gas, and oil during the period from 2006 to 2021, these only contributed 19% of the portfolio (read Equity Factors & Inflation).
The majority of the portfolio was comprised of currency pairs and specifically developed market currencies like the USD and GBP against the JPY. Japan’s inflation rate has been close to zero over the last two decades, while countries such as the US and the UK have mildly positive inflation, which is reflected in the performance of these pairs.

Source: FactorResearch
CORRELATION TO INFLATION
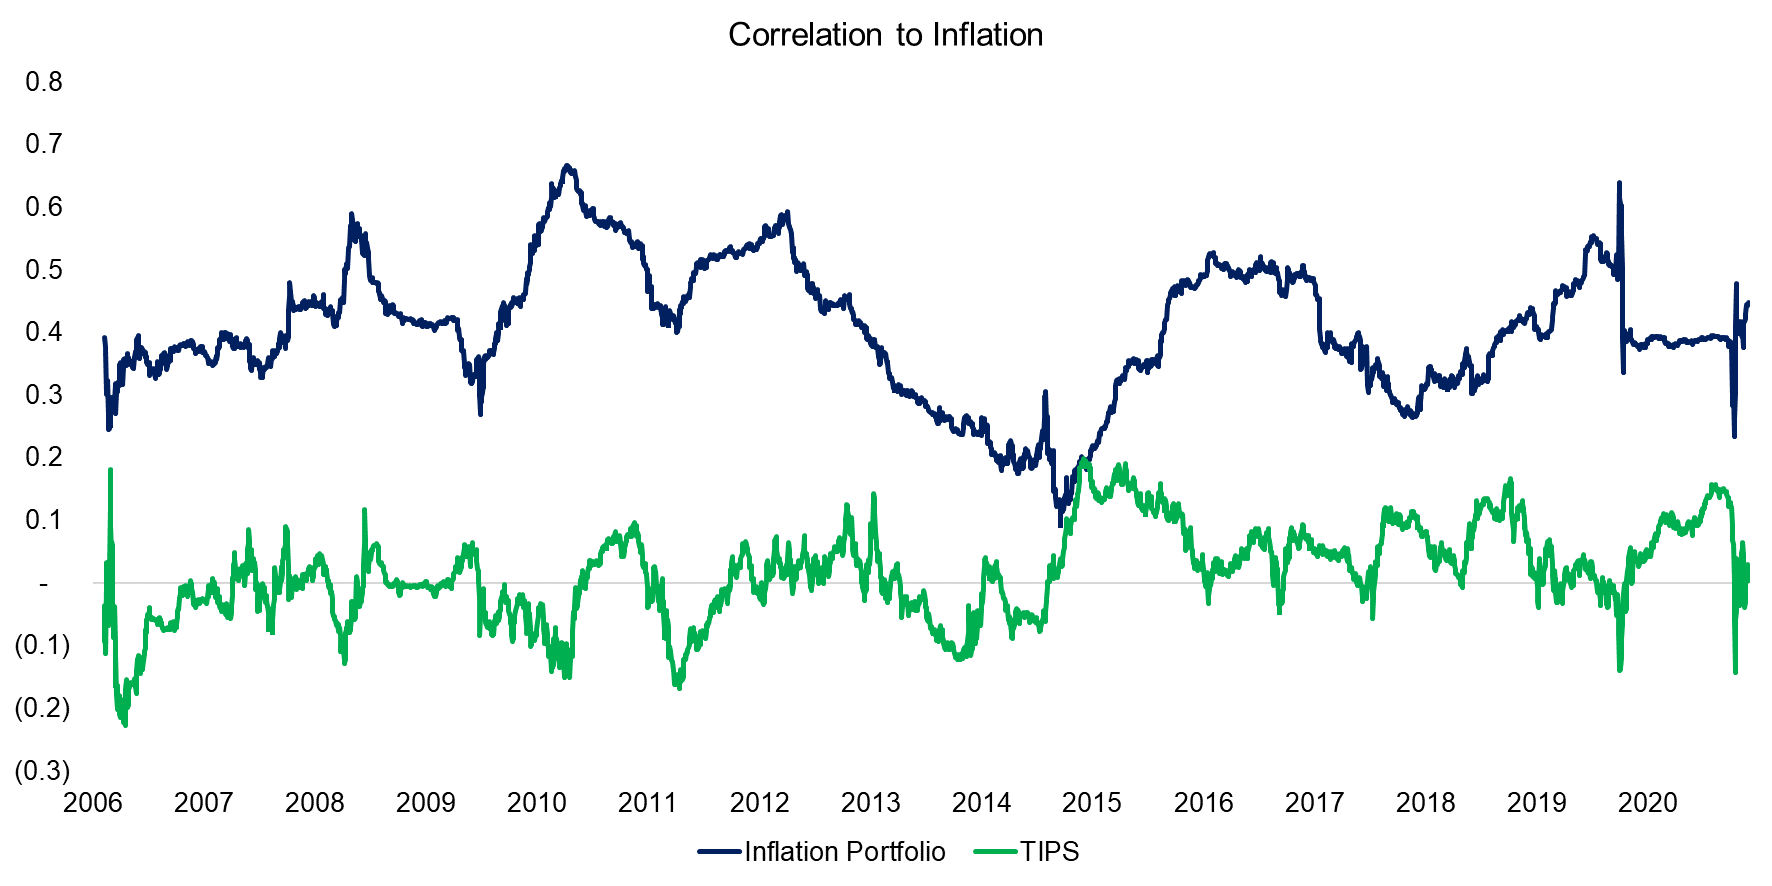
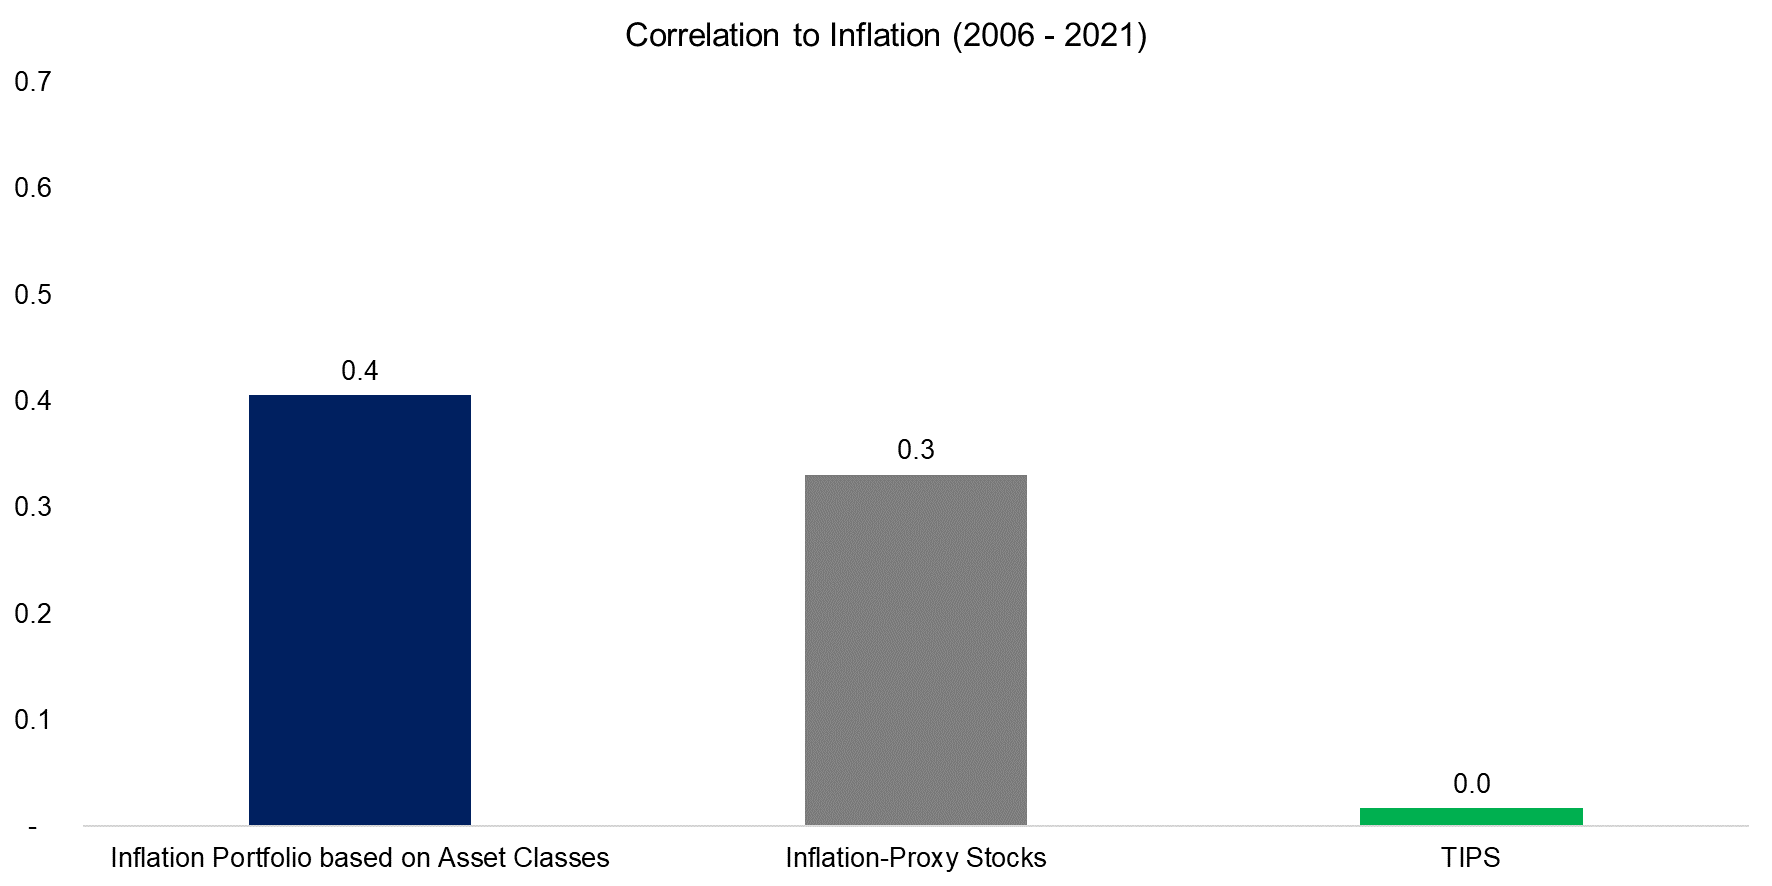
Finally, we calculate the correlation of the portfolio to inflation. Although the asset classes were selected based on their correlation to inflation, the average correlation to inflation was only 0.4 during the period from 2006 to 2021. Investors might regard this as low, but the correlation of TIPS, which are popular inflation instruments, was approximately 0.

Source: FactorResearch.
We started this research note with the theory that an inflation portfolio comprised of various asset classes should be superior to one made up of stocks. Based on the correlations to inflation, this theory is only marginally correct as the correlations of both portfolios were comparable.
However, we should recall that the inflation portfolio mirrored the trends of inflation relatively accurately. It will never be a perfect replication given the one-year lookback used to calculate the correlation, i.e. a time delay is introduced. Similarly, the low correlation of TIPS to inflation is also explained by inflation data flowing into the principal and coupon calculation with a delay.

Source: FactorResearch.
FURTHER THOUGHTS
It is somewhat surprising that the usual suspects like gold or energy commodities were only marginal components of the inflation portfolio. Perhaps this reflects some flaws in our simple framework, our short observation period that lacked a phase of high inflation, but it might also suggest that some commodities are far less effective inflation proxies than commonly thought.
RELATED RESEARCH
ABOUT THE AUTHOR
Nicolas Rabener is the CEO & Founder of Finominal, which empowers professional investors with data, technology, and research insights to improve their investment outcomes. Previously he created Jackdaw Capital, an award-winning quantitative hedge fund. Before that Nicolas worked at GIC and Citigroup in London and New York. Nicolas holds a Master of Finance from HHL Leipzig Graduate School of Management, is a CAIA charter holder, and enjoys endurance sports (Ironman & 100km Ultramarathon).
Connect with me on LinkedIn or X.

