Building an Inflation Portfolio Using Stocks
Identifying Inflation-Proxy Stocks
August 2021. Reading Time: 10 Minutes. Author: Nicolas Rabener.
SUMMARY
- An inflation portfolio can be created by systematically selecting stocks correlated to inflation
- This would have resulted in a portfolio with strong sector and factor biases
- However, the correlation to inflation would not have been significantly higher than for stocks overall
INTRODUCTION
Measuring inflation is as challenging as calculating our body weight changes using only a mirror. We might feel heavier and our pants might seem unusually tight after the Christmas period, but it is tough knowing the exact number without a scale. Economists are not short of tools that measure inflation, it is more a question of which is the most relevant one. There are plenty of metrics, and then official and shadow statistics, making inflation a complex topic.
The quick economic recovery from the COVID-19 crisis has created unexpected levels of inflation and made it the most discussed topic in financial markets, after cryptocurrencies, in 2021. Both topics are related as many cryptocurrency enthusiasts are seeking to move their wealth away from fiat currencies as they believe the actual inflation is higher than reported, or significant inflation is ahead. However, the volatility of cryptocurrencies makes it a difficult asset class and there is little evidence that these do protect against inflation.
The traditional instruments for hedging against inflation are commodities, treasury inflation-protected securities (TIPS), and stocks. Most academic research suggests that commodities have the best inflation-protection characteristics, but holding commodities has been difficult given poor performance. The Goldman Sachs Commodities Index (S&P GSCI) trades at the same level as in 1991. TIPS protect against inflation, but they currently exhibit low yields and will not contribute much return to a portfolio. That leaves investors with stocks.
In this research note, we will analyze stocks that are highly correlated to inflation and can be used to create an inflation portfolio.
CONSTRUCTING AN INFLATION PORTFOLIO USING STOCKS
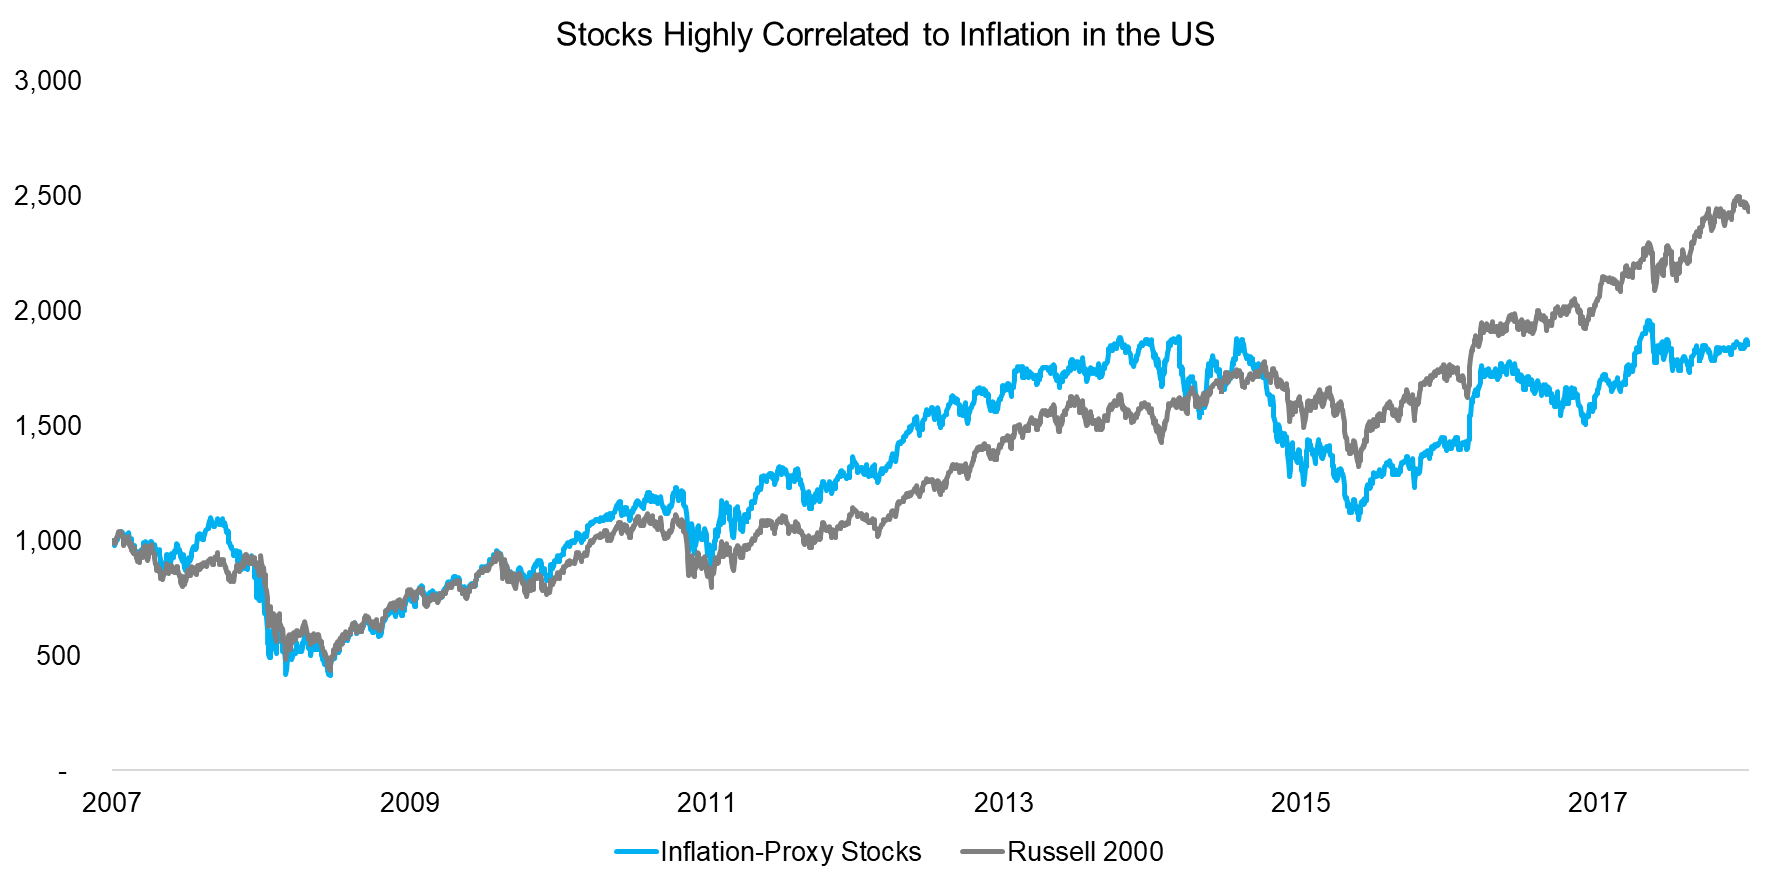
We focus on all stocks in the US with a market capitalization above $1 billion in the period from 2007 to 2018. We calculated the correlation of each stock to the US 10-Year breakeven inflation rate and created an equal-weighted portfolio selecting the top 5% of stocks that were most highly correlated to inflation. The portfolio is rebalanced monthly and includes 10 basis points of transaction costs.
We observe that the portfolio of inflation-proxy stocks exhibited approximately the same trends in performance as the Russell 2000 over the 11-year period. There was an outperformance between 2011 and 2014, and then underperformance thereafter, which is primarily explained by the equal-weighting. A few stocks like Apple or Amazon have been driving the majority of stock market returns since 2015, but these have had lower weights in the inflation-proxy portfolio than in the Russell 2000.
It is worth highlighting that these inflation-proxy stocks do not necessarily protect against inflation as they only exhibit the same trends, regardless if inflation is increasing or decreasing. The stocks simply represent securities that move with inflation (read Myth Busting: Equities are an Inflation Hedge).
Source: Inflation data from St Louis Fed, FactorResearch
INFLATION-PROXY STOCKS: BREAKDOWN BY SECTORS
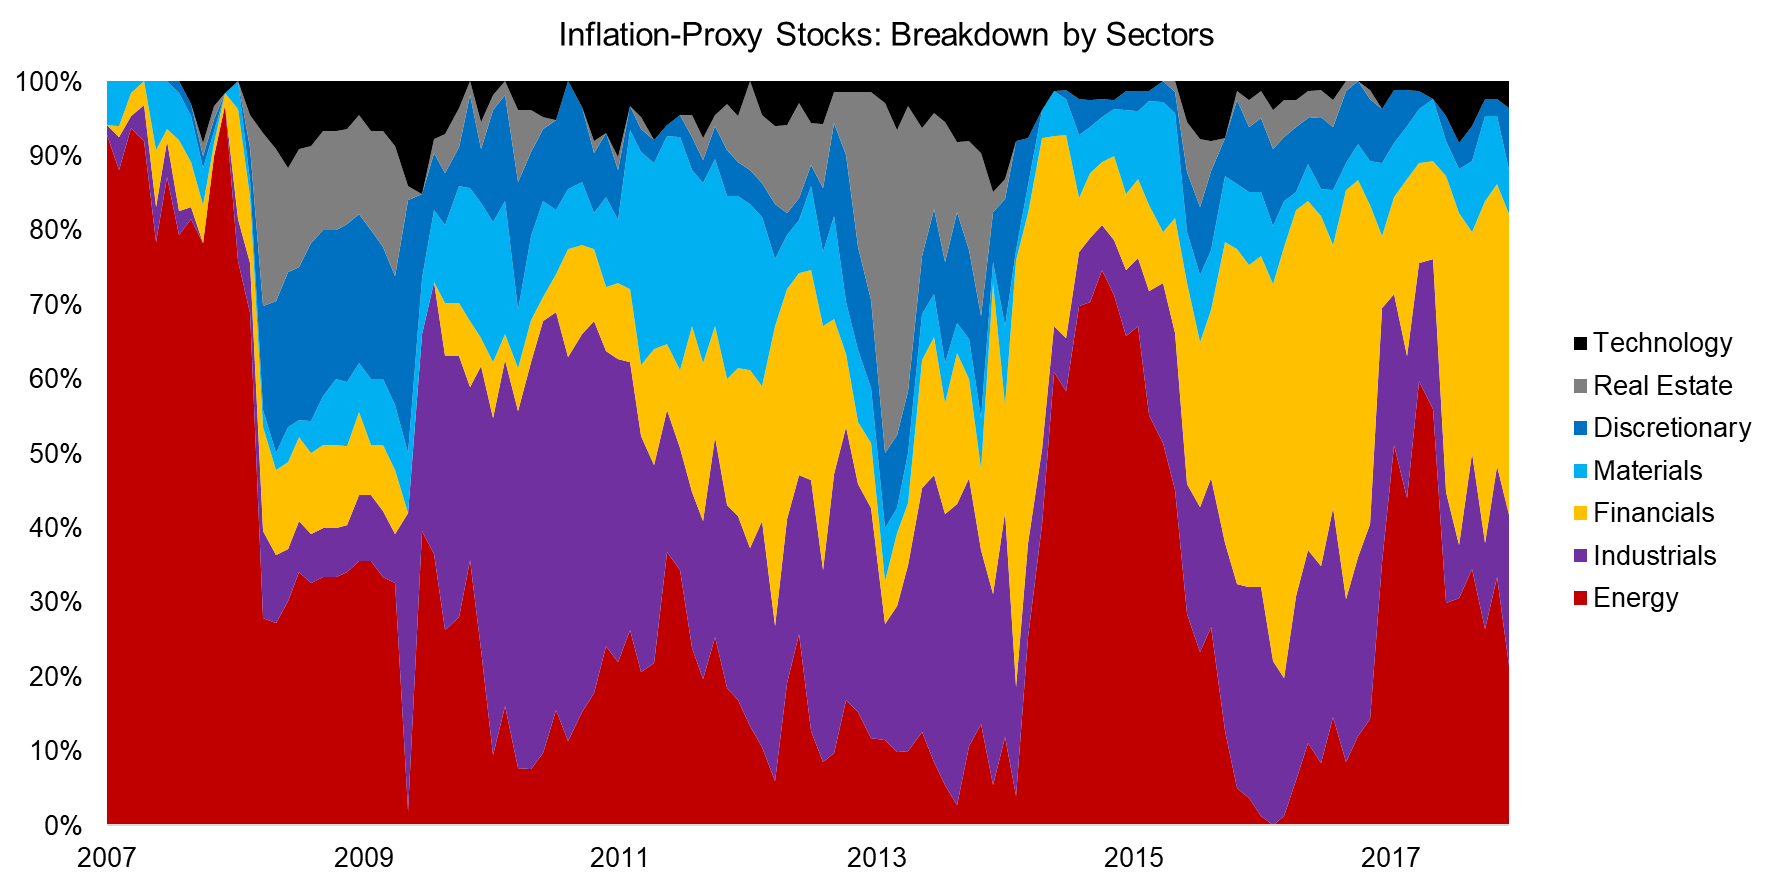
Next, we analyze the composition of the inflation-proxy portfolio by sectors. In line with the consensus that commodities represent the best inflation hedge, the energy sector contributed most stocks, followed by financials and industrials. These top three sectors contributed 70% of the stocks in the period from 2007 to 2021.
The real estate industry often emphasizes the inflation-proxy characteristics when marketing its asset class. However, real estate stocks were not highly correlated to inflation on a relative basis.
Source: FactorResearch. We only show sectors that contributed >4% of stocks on average.
THE INFLATION FACTOR
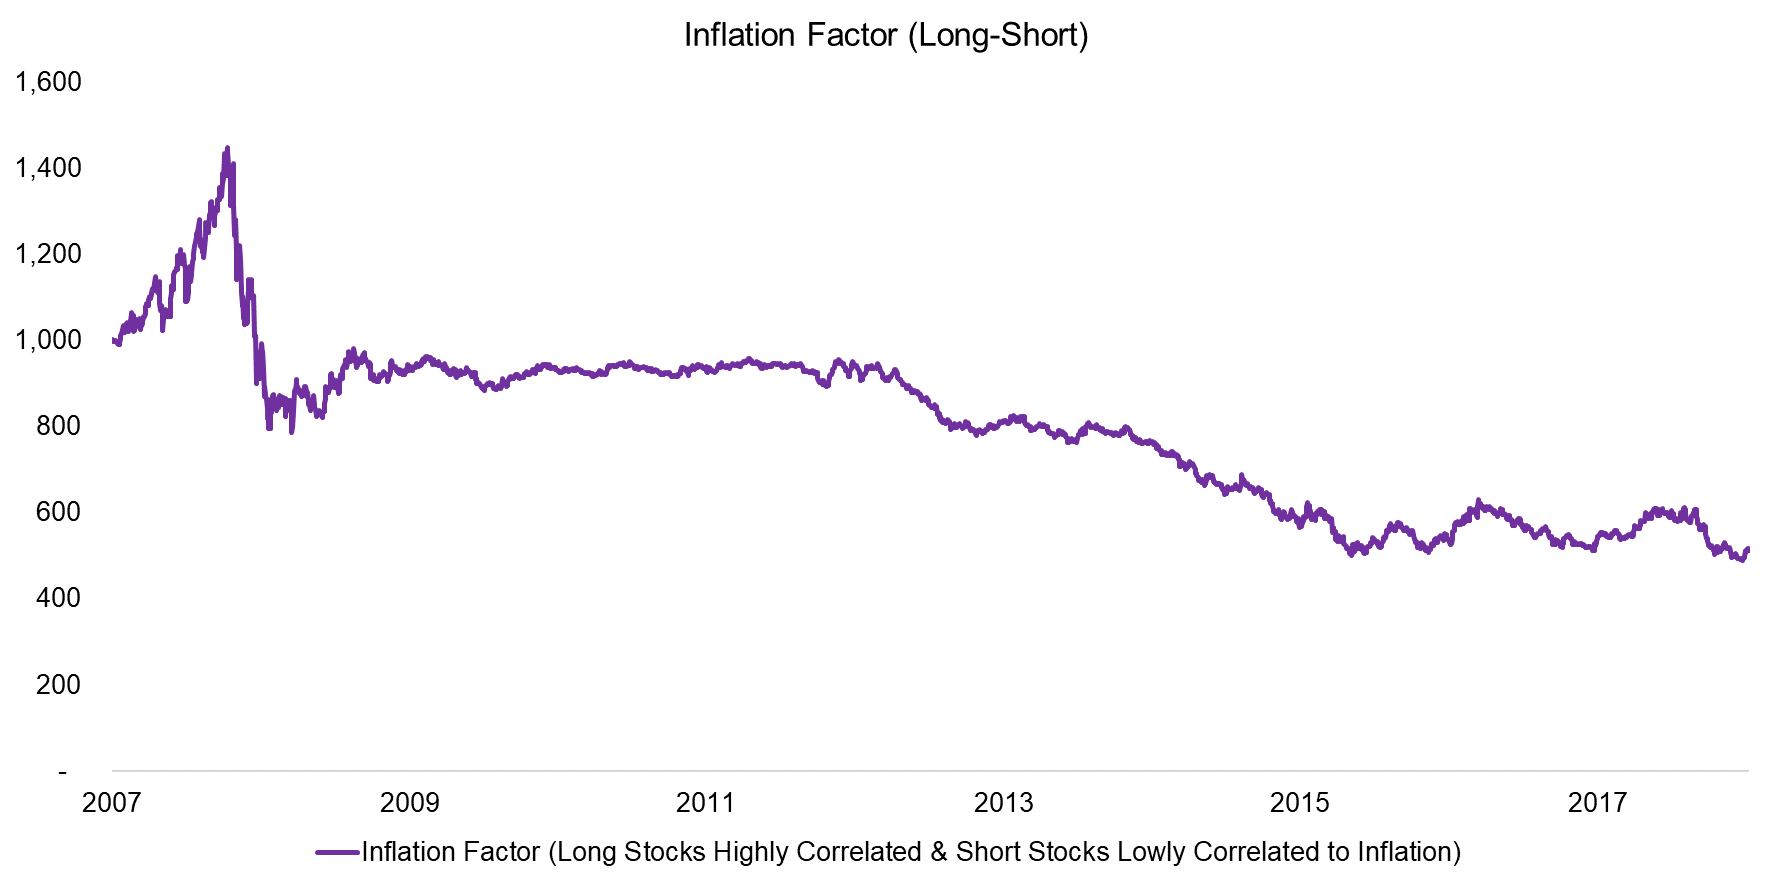
In addition to a long-only portfolio of inflation-proxy stocks, we also create a long-short portfolio. In this case, the long portfolio is comprised of stocks with a high correlation to inflation and the short portfolio of stocks that have a negative or low correlation to inflation. The portfolio is constructed beta-neutral, so has zero exposure to the stock market.
Aside from a significant spike during the global financial crisis in 2008, this long-short portfolio has been declining consistently since 2012. At this point, it is worth highlighting that there is no economic rationale for an investor to pursue such a strategy as stocks with a high correlation to inflation should not outperform stocks with a low correlation over the long term.
Source: FactorResearch.
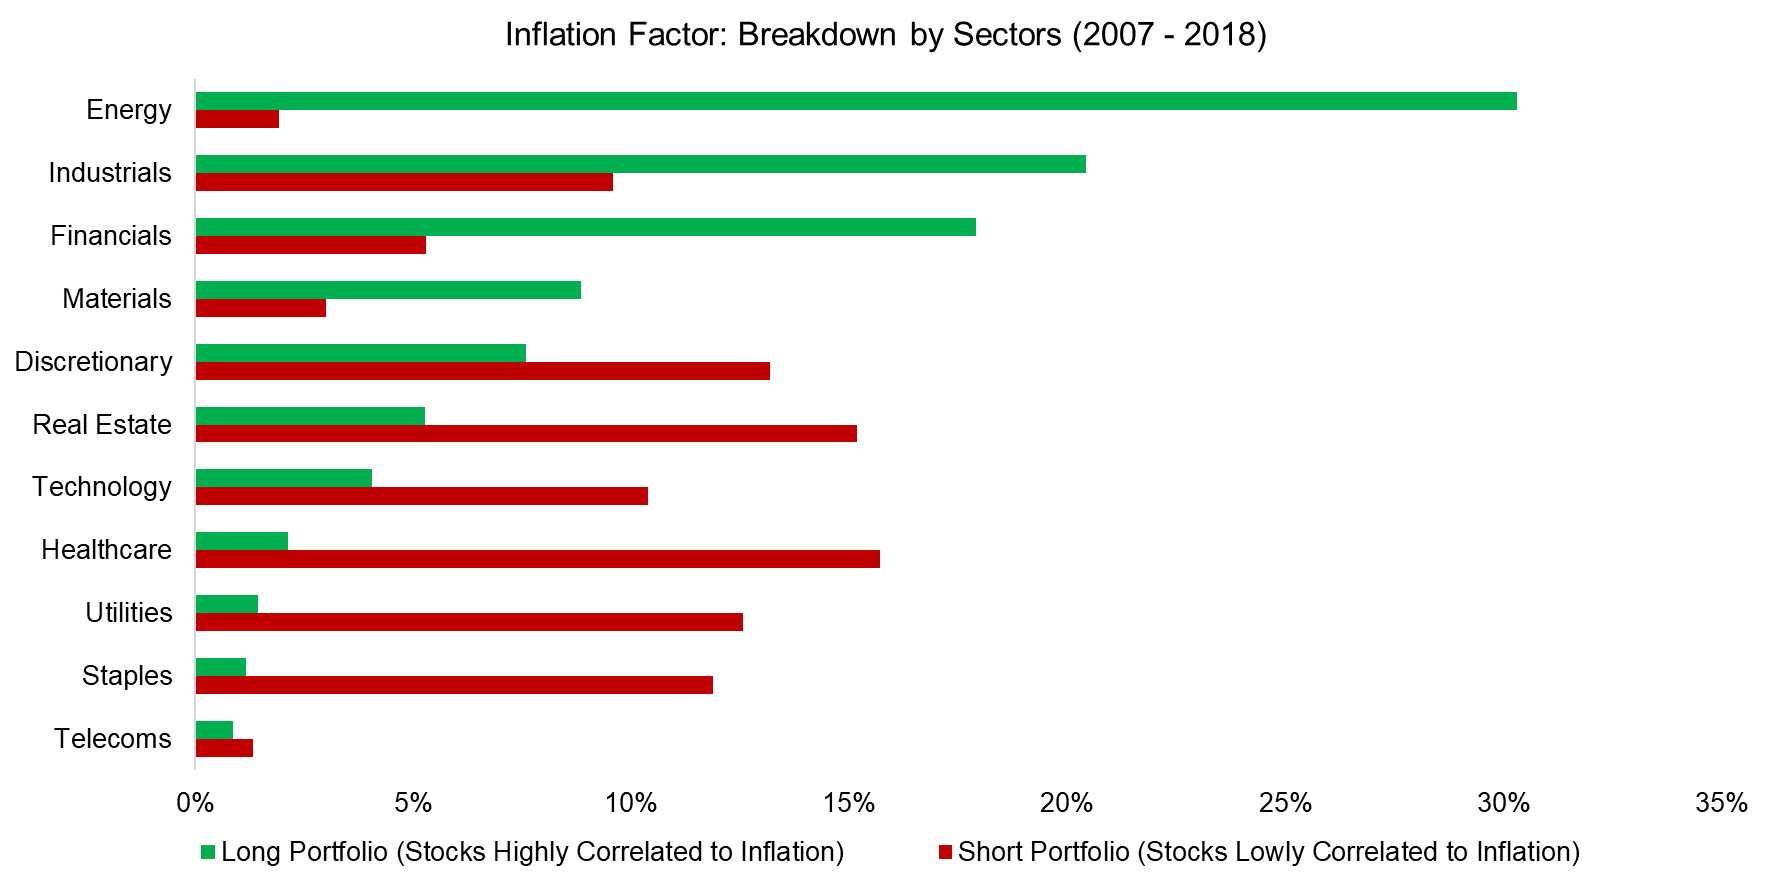
Although an inflation factor is perhaps not a sensible strategy, it is still intellectually interesting. Similar to before, we analyze the long and short portfolios by sectors. We observe that the short portfolio had less extreme sector overweights than the long portfolio. In fact, it was almost distributed equally with seven sectors contributing more than 10% of the stocks on average.
The portfolio composition also explains the consistently negative performance in recent years as the portfolio was long poorly-performing energy and financial stocks, while being short well-performing technology companies. From a factor perspective, the exposure was long the value and short the momentum and quality factors (read Equity Factors & Inflation).
Source: FactorResearch.
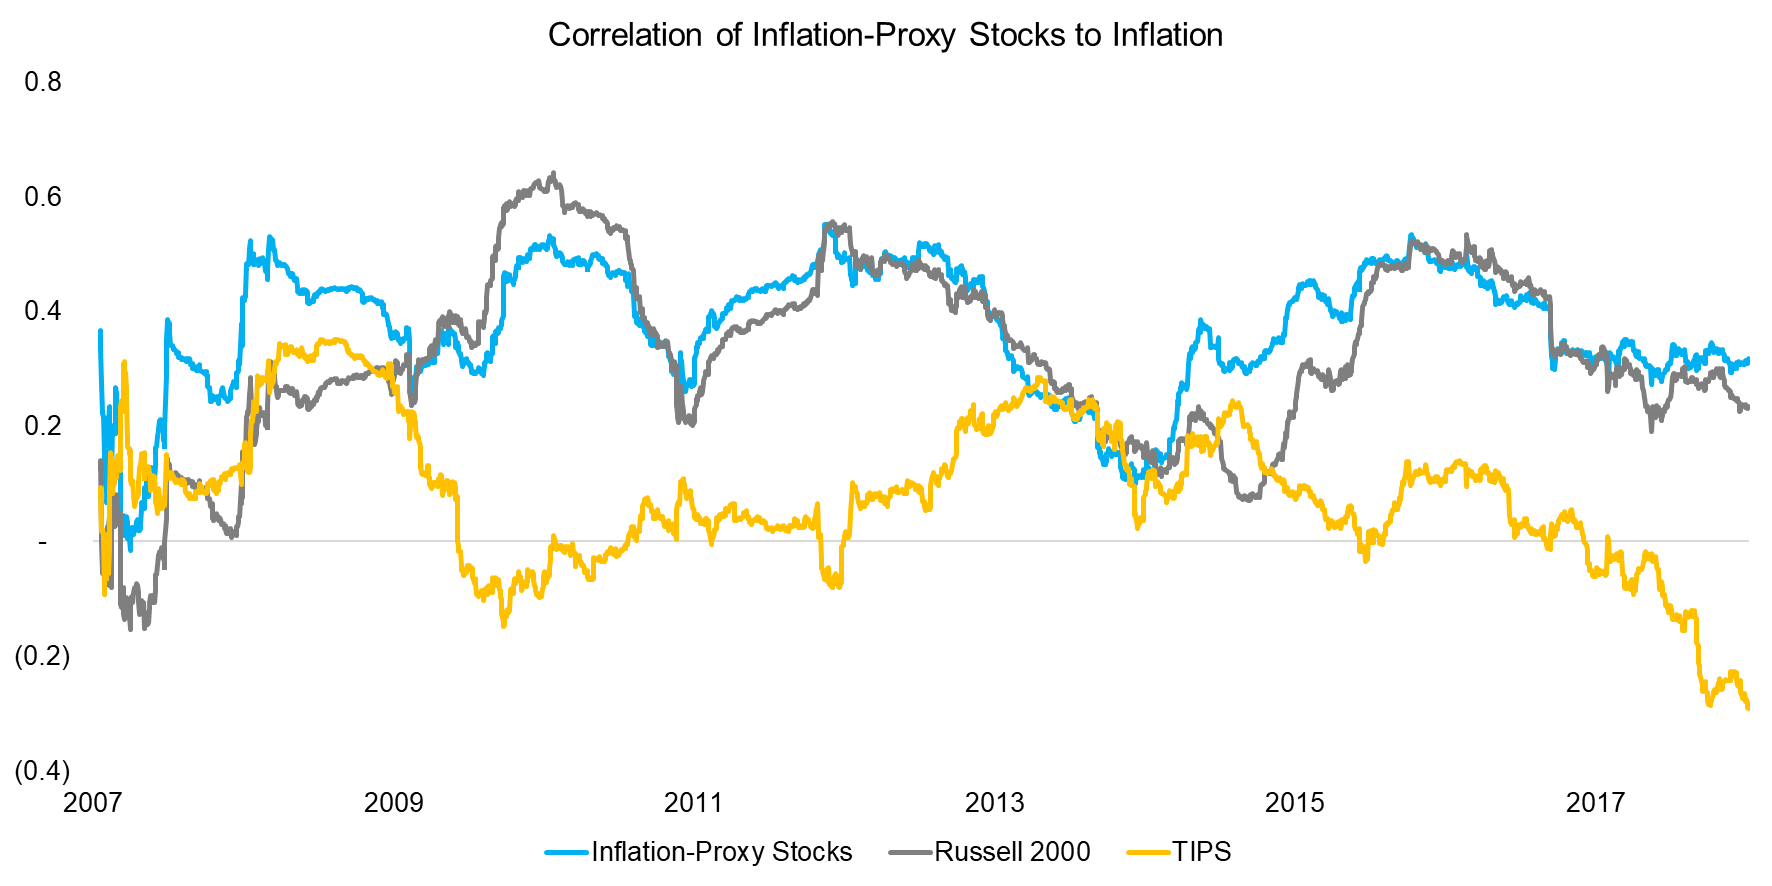
Although we selected stocks based on their correlation to inflation, we have not analyzed how effective these stocks are as inflation-proxies. The average correlation was 0.4 in the period from 2007 to 2018, which is only marginally higher than the 0.3 of the Russell 2000. Given that the performance of both portfolios was approximately similar, this is not surprising.
However, perhaps more surprising is that the correlation of other inflation-proxies like TIPS was not high either. In fact, the correlation of TIPS to inflation was 0.1 over the same time period, which is explained by the lagged inflation data that feeds into the TIPS principal and coupon calculation.
Source: FactorResearch.
FURTHER THOUGHTS
It is interesting to consider that we selected stocks that move with inflation rather than correlate to high or rising inflation, and still derived portfolios that had the largest overweight to the energy sector, which likely is explained by oil and gas being core components of the inflation calculation.
Even more interesting would have been to analyze the performance of the inflation-proxy portfolio during the high inflation periods of the US in the 1970s, especially the real returns. Unfortunately, daily inflation data is only available since 2003, where the 10-year breakeven inflation has been consistently below 3%.
RELATED RESEARCH
ABOUT THE AUTHOR
Nicolas Rabener is the CEO & Founder of Finominal, which empowers professional investors with data, technology, and research insights to improve their investment outcomes. Previously he created Jackdaw Capital, an award-winning quantitative hedge fund. Before that Nicolas worked at GIC and Citigroup in London and New York. Nicolas holds a Master of Finance from HHL Leipzig Graduate School of Management, is a CAIA charter holder, and enjoys endurance sports (Ironman & 100km Ultramarathon).
Connect with me on LinkedIn or X.

