Carry versus Trend Following
Which one will carry you further?
May 2024. Reading Time: 10 Minutes. Author: Nicolas Rabener.
SUMMARY
- The carry strategy has become more attractive given higher yields
- However, the strategy is highly correlated to equities in periods of market stress
- CTAs are better diversifiers
INTRODUCTION
Carry strategies were widely popular before the global financial crisis in 2009, but less thereafter given a substantial drawdown during the crisis when investors reversed their positions and fled to safe but low-yielding currencies like the USD or CHF.
Although the carry strategy recovered in 2010 and 2011, investors’ interest remained muted in the following decade. Partially we can attribute the limited interest to a lack of performance, which in turn can be explained by the low-interest rate environment that made betting on the spread between high yielding and low yielding currencies less attractive.
However, this changed in 2022 when central banks started raising interest rates and the spread widened again as central bank policies were not synchronous across the globe.
Another strategy, namely trend following funds, also called CTAs or managed futures strategies, similarly suffered from little interest in the decade post the GFC, despite having performed strongly during the crisis (Managed Futures: The Empire Strikes Back).
Many asset managers combine these two strategies and such a combination has even become available as an ETF via JP Morgan’s Managed Futures UCITS ETF, albeit only for a brief period between 2017 and 2020 when the product was liquidated due to poor performance.
In this research note, we will contrast the carry versus trend following strategies.
PERFORMANCE OF CARRY VERSUS CTAS
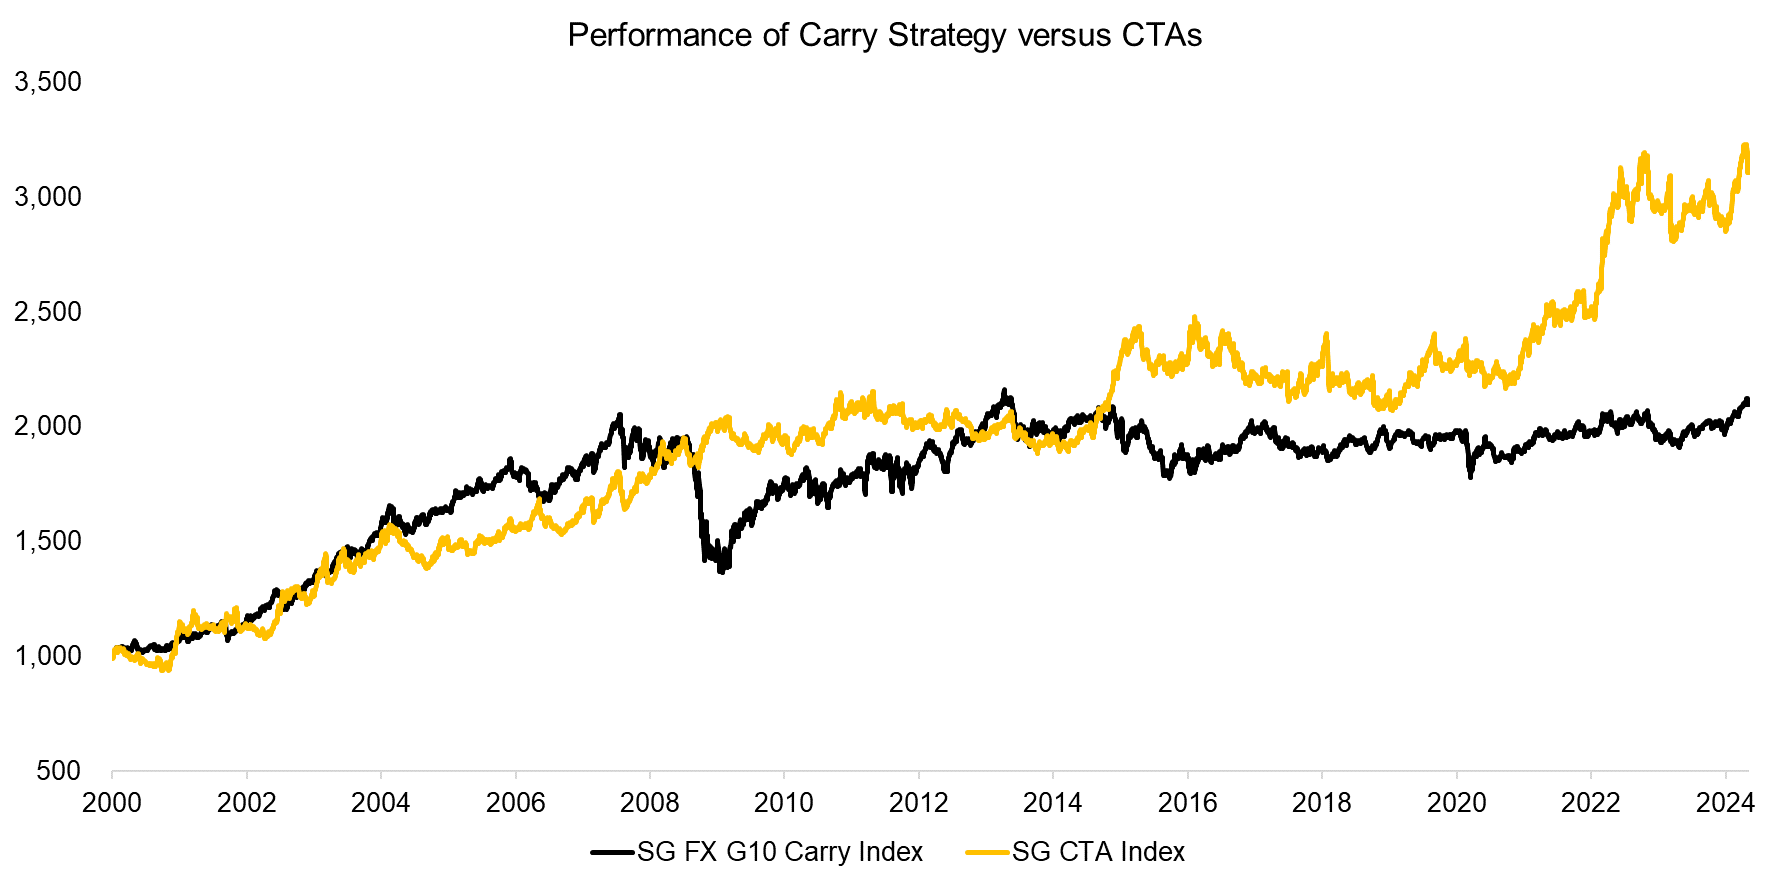
We will use two indices from Societe Generale as proxies for the carry trade and trend following strategy. The carry trade can be implemented across asset classes, but is most established in currencies where investors buy the highest and short the lowest yielding currencies. The SG FX G10 Carry Index represents a portfolio of long positions in the three currencies with the highest yield and short positions in the three currencies with the lowest yield from the G10 currency universe.
The SG CTA Index is the benchmark index for the managed futures industry. CTAs create diversified portfolios of long and short positions across asset classes based on exploiting trends.
We observe that both strategies generated relatively consistent excess returns from 2000 up to the global financial crisis in 2009, where carry experienced a significant drawdown while CTAs generated strong diversification benefits with positive returns. The performance in the following decade was muted for both strategies until the war in Ukraine started when CTAs again produced attractive returns (read Replicating a CTA via Factor Exposures).

Source: SG, Finominal
CORRELATION ANALYSIS
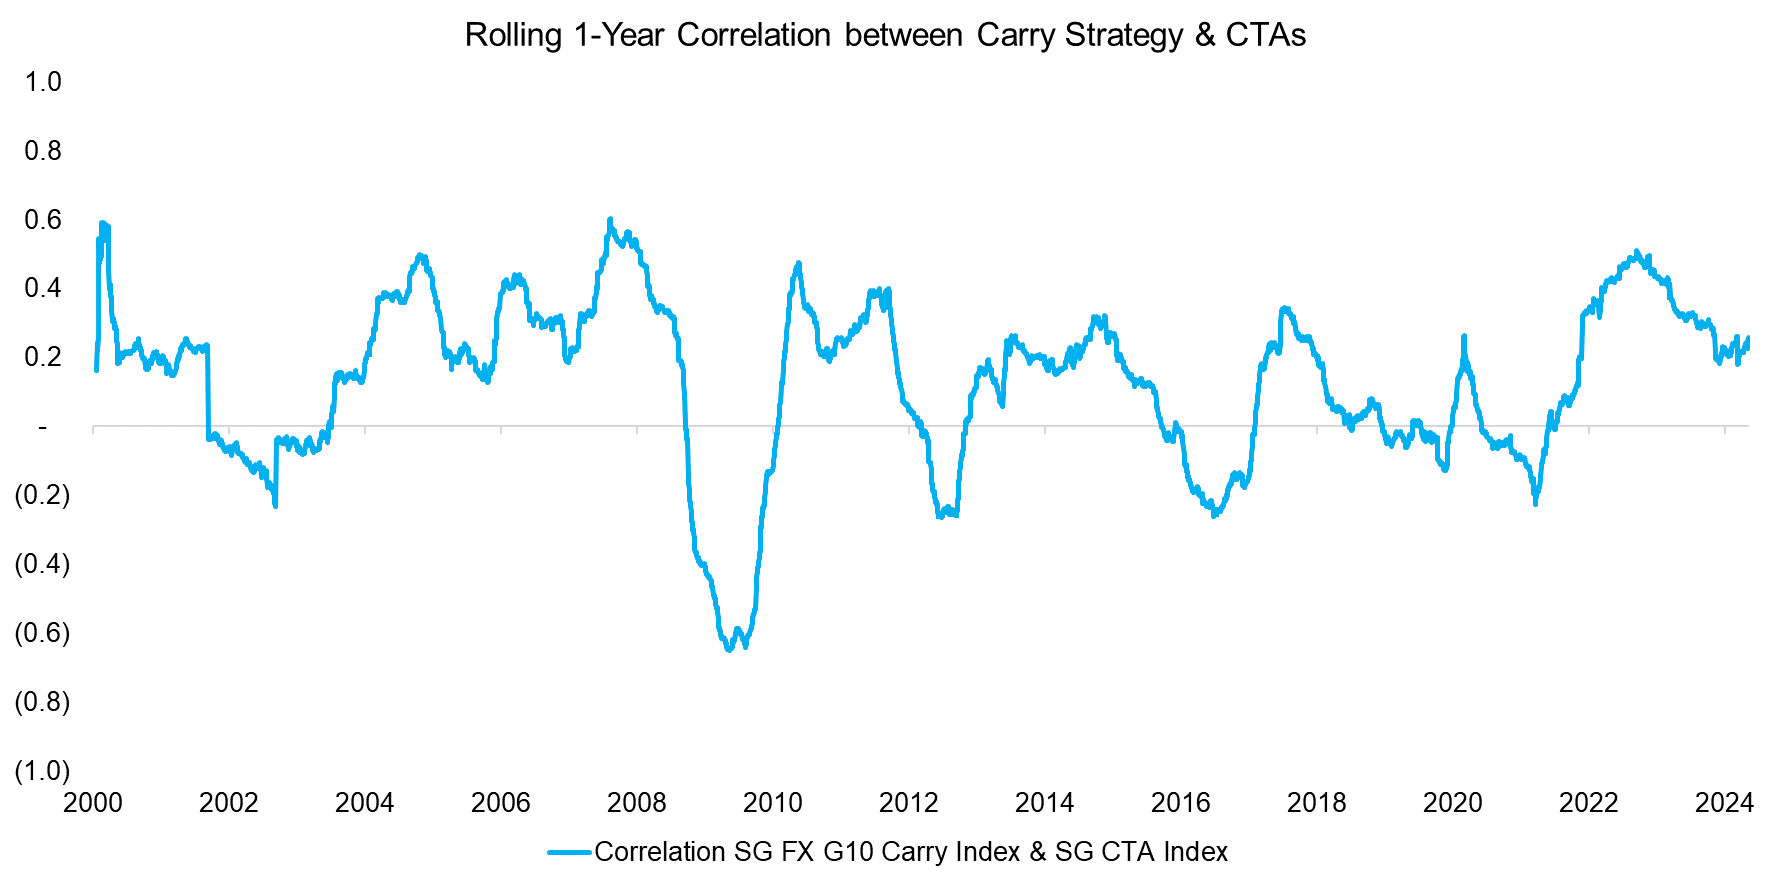
Although CTAs also take long and short positions in currencies when they identify trends in these, there is little overlap in portfolios between these two alternative strategies, which results in a correlation of 0.1 between 2000 and 2024.
Average correlations often deceive investors, but plotting the rolling one-year correlation between the carry strategy and CTA index does not highlight many periods were these were positively correlated. They were most negatively correlated during the GFC in 2009.

Source: Finominal
MEASURING DIVERSIFICATION BENEFITS
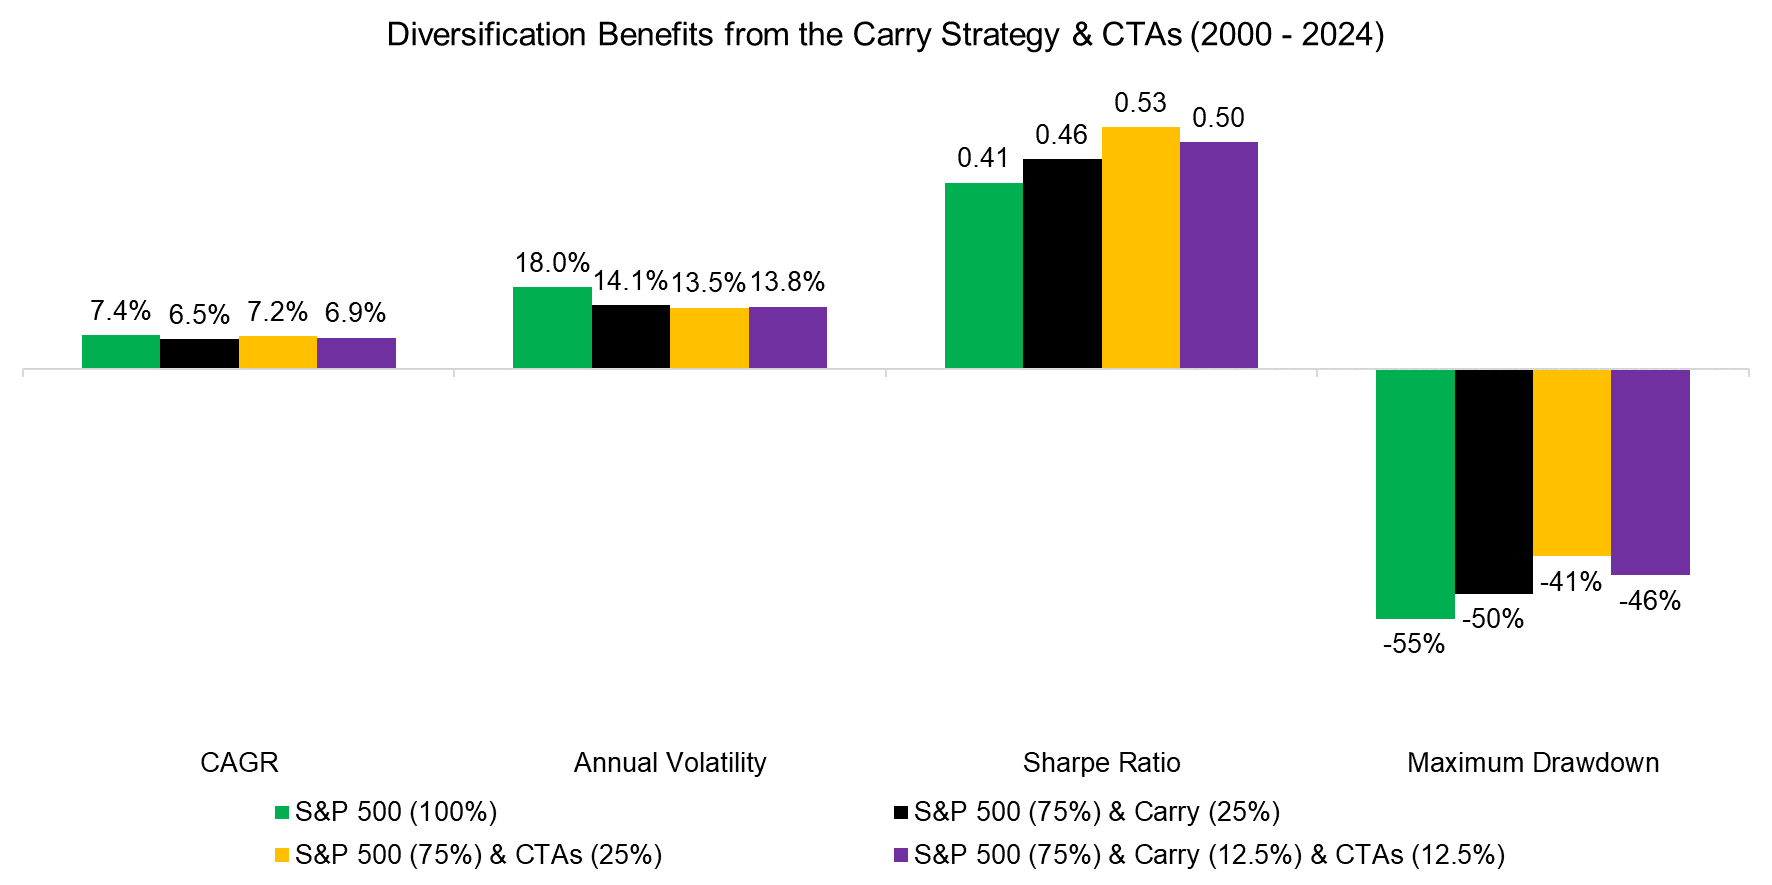
Next, we evaluate the diversification benefits of the carry strategy and CTAs by simulating adding these to an equities portfolio comprised exclusively of the S&P 500. We observe that a 25% allocation to carry would have decreased the CAGR and annual volatility from 2000 to 2024, but also would have increased the Sharpe ratio from 0.41 to 0.46.
However, adding 25% to CTAs would have generated significantly higher diversification benefits as the Sharpe ratio would have reached 0.53. This combination would have also featured the lowest drawdown with -41%, compared to -55% for the S&P 500 and -50% with a 25% allocation to carry.

Source: Finominal
We also ran the scenario of adding a combination of the carry strategy and CTAs to the equities portfolio, which theoretically should be attractive as these two alternative strategies have a correlation of close to zero. However, this portfolio was worse in terms of Sharpe ratio and maximum drawdown than when allocating only to CTAs.
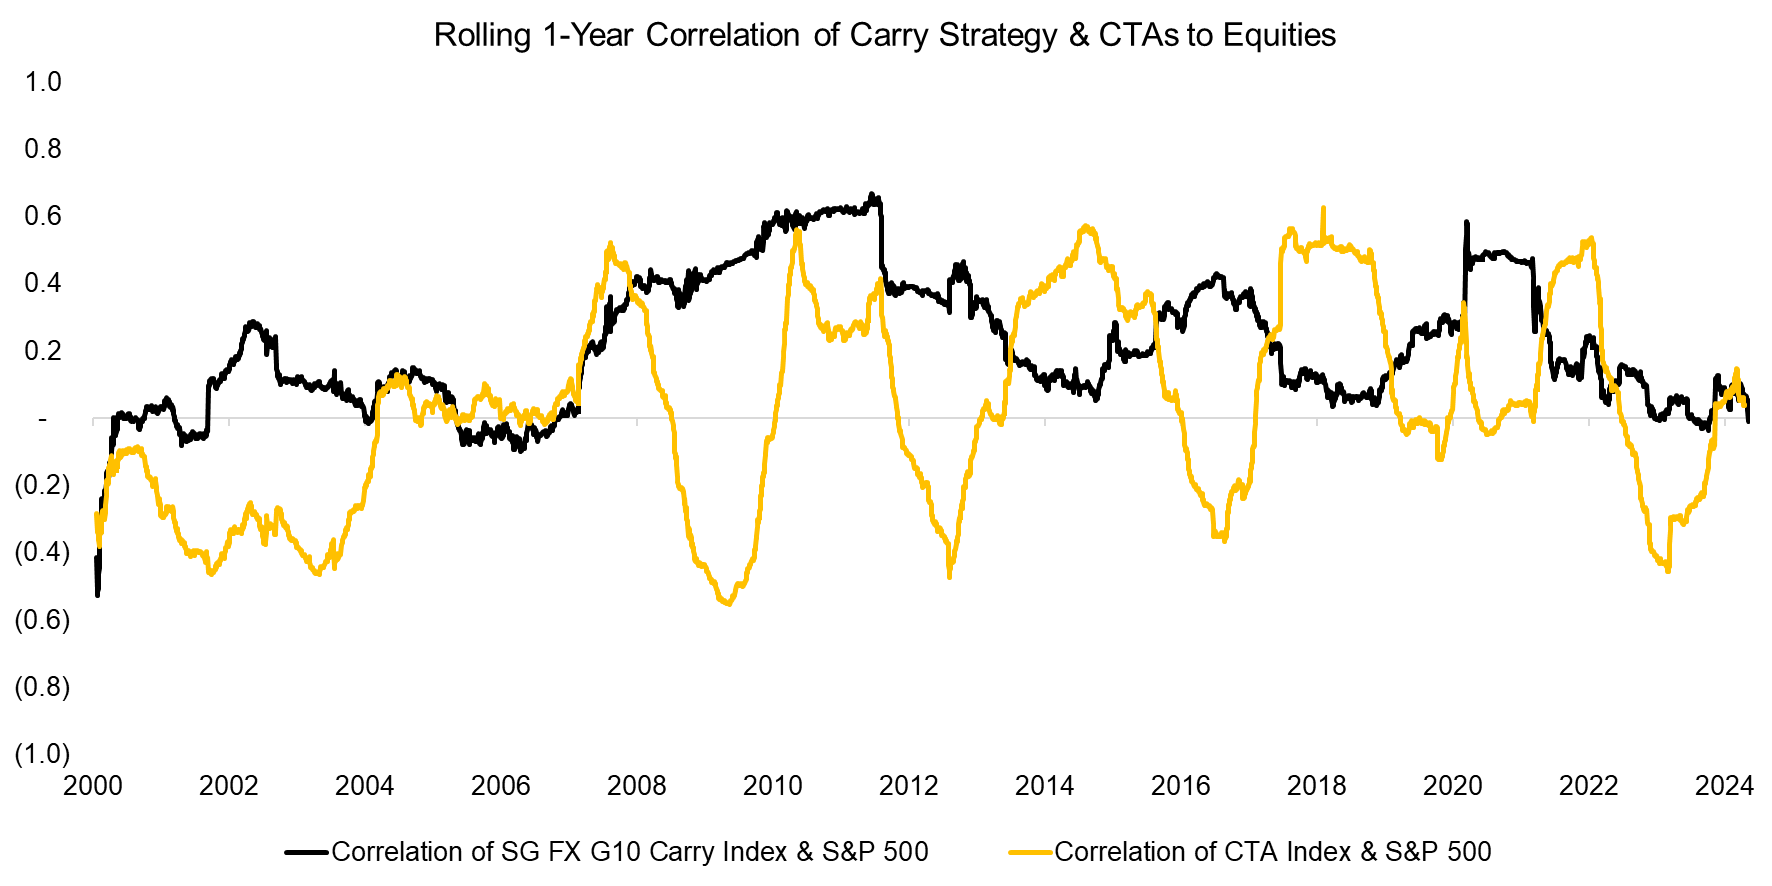
We can explain this result by the nature of the carry strategy, which represents a fair-weather strategy like merger arbitrage. In good times, investors are happy to speculate on getting higher yields from riskier currencies, but this behavior changes when stocks crash and investors flee to safe assets, which happens across all asset classes.
The carry strategy does seem like an uncorrelated and diversifying strategy as its average correlation to the S&P 500 was only 0.3 over the last 24 years, but this has become significantly more positive in times of stock market turmoil like the GFC or the COVID-19 crisis in 2020 (read Is the Carry Trade a Diversifying Strategy? and Don’t Get Carried Away by Carry).

Source: Finominal
FURTHER THOUGHTS
Given that many currencies are featuring high yields again, some investors are viewing the carry trade as attractive again (hello again Ms Watanabe!), but they should be wary of repeating past mistakes. The downside beta of the carry strategy to the S&P 500 is positive and larger than its upside beta, which is not a favorable characteristic for a strategy.
In contrast, CTAs feature negative downside betas. Keep calm and don’t get carried away.
RELATED RESEARCH
Is the Carry Trade a Diversifying Strategy?
Don’t Get Carried Away by Carry
Value, Carry, and Momentum Across Asset Classes
Bank Risk Premia Indices: Unbankable?
Trend Following in Equities
Trend Following in Bear Markets
Replicating a CTA via Factor Exposures
Creating a CTA from Scratch – II
CTAs vs Global Macro Hedge Funds
Managed Futures: The Empire Strikes Back
Managed Futures: Fast & Furious vs Slow & Steady
Hedging via Managed Futures Liquid Alts
ABOUT THE AUTHOR
Nicolas Rabener is the CEO & Founder of Finominal, which empowers professional investors with data, technology, and research insights to improve their investment outcomes. Previously he created Jackdaw Capital, an award-winning quantitative hedge fund. Before that Nicolas worked at GIC and Citigroup in London and New York. Nicolas holds a Master of Finance from HHL Leipzig Graduate School of Management, is a CAIA charter holder, and enjoys endurance sports (Ironman & 100km Ultramarathon).
Connect with me on LinkedIn or X.

