CLOs – Diversifier, or another Equity Clone?
Investigating Collateralized Loan Obligations
SUMMARY
- Multiple collateralized loan obligation (CLO) ETFs have been launched since 2020
- CLOs are promoted as low-risk fixed-income products
- However, these simply represent diluted equity exposure and offer limited diversification benefits
INTRODUCTION
The U.S. leveraged loan market has increased from $100 billion in 2000 to $1.4 trillion in 2022, according to data from S&P Global, which is remarkable given that this period includes the global financial crisis in 2008 when many loans defaulted. The key role during that crisis was played by subprime mortgage debt that was promoted as low-risk securities via collateralized debt obligations (CDOs) to all types of investors.
Although CDOs have not had a major comeback, their cousin, namely collateralized loan obligations (CLOs), have become popular due to investors’ search for yield in the low-interest rate environment of the 2010s. Most of these loans are sourced from private equity firms that require financing for purchasing companies. The growth in the leveraged loan market mirrors that of the private equity industry, where the assets under management have increased to over $4 trillion (read Private Equity: Fooling Some People All the Time?).
Asset managers have capitalized on this demand by launching ETFs that offer access to CLOs to even retail investors. Recent issuers include Invesco, Janus Henderson, VanEck, PGIM, and BlackRock. However, given the poor track record of CDOs, investors might be wary of CLOs.
In the research article, we will evaluate CLOs.
UNIVERSE OF CLO ETFS
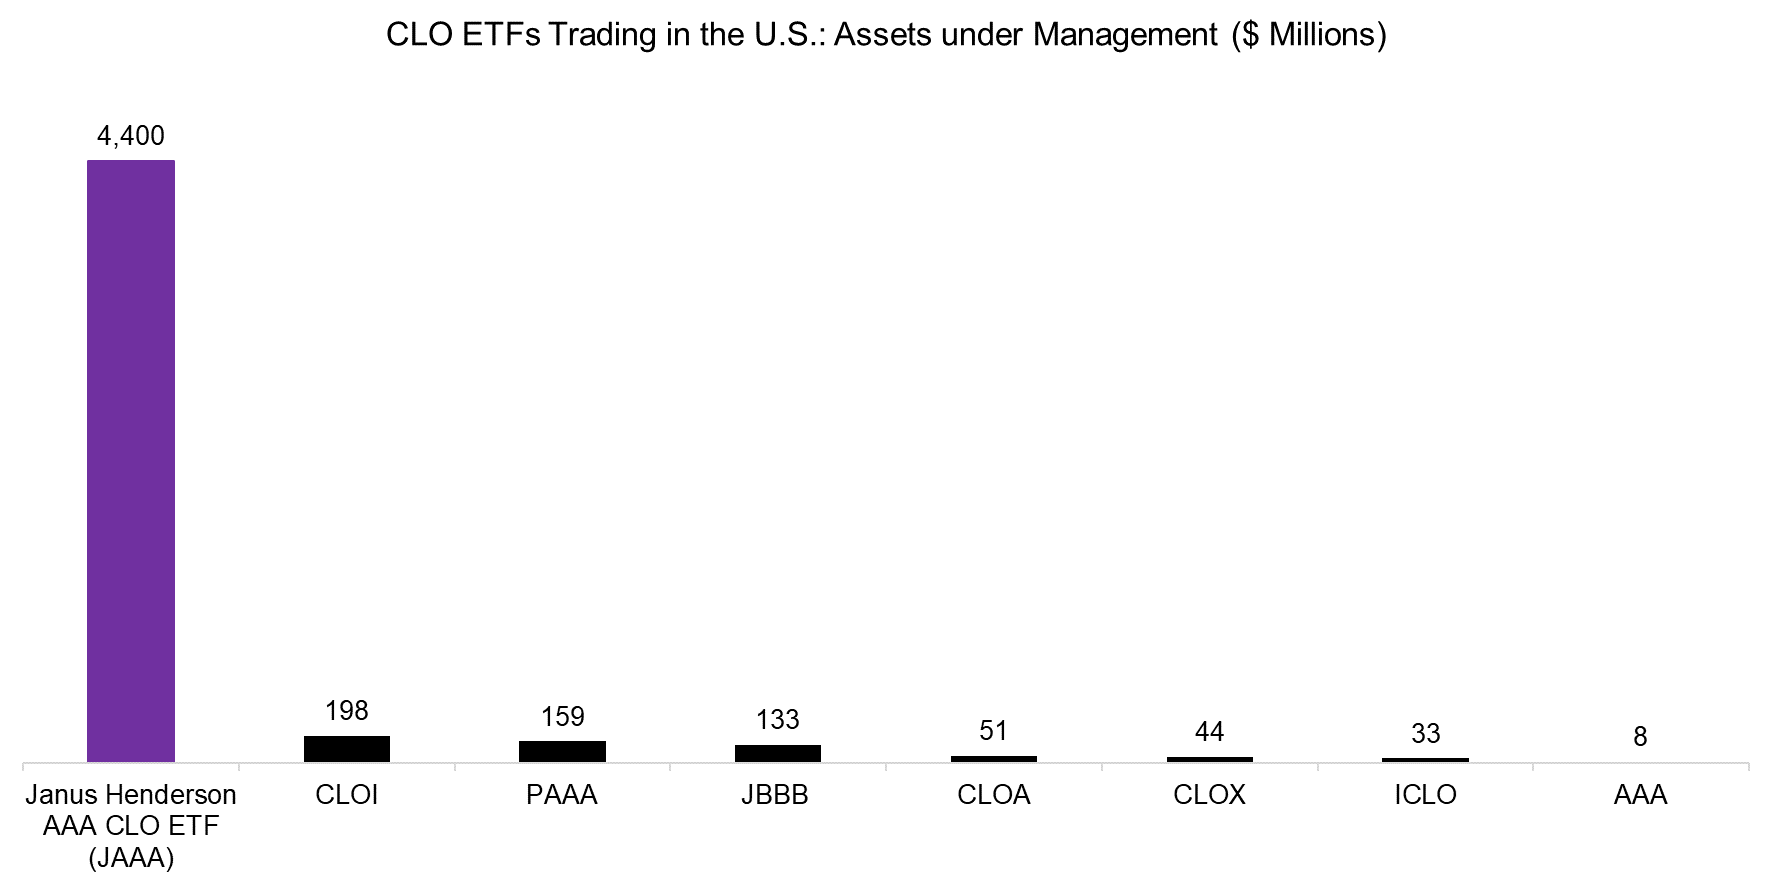
First, we review the universe of ETFs trading in the U.S. that offer exposure to CLOs, which amounts to eight products that were all launched over the last three years. The total assets under management are approximately $5 billion, but Janus Henderson’s AAA CLO ETF (JAAA) dominates this space with $4.4 billion. The management fees range from 0.19% to 0.50%, and the credit exposure varies from AAA to BBB.
Source: Finominal
PERFORMANCE OF CLO ETFS VERSUS CLO INDEX
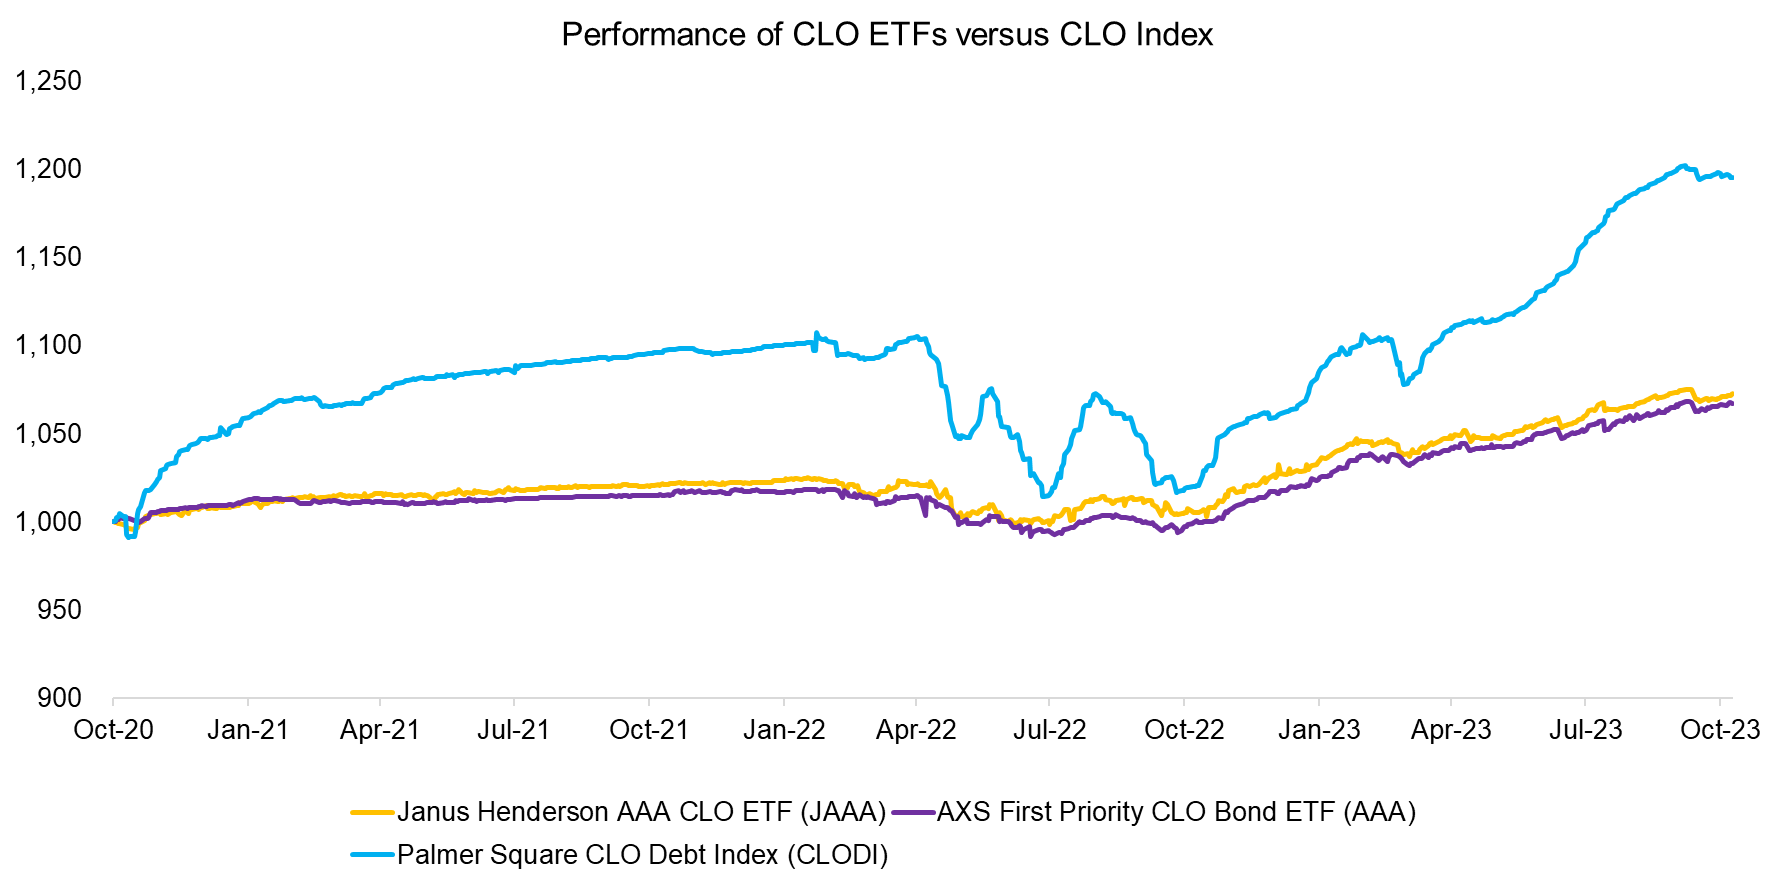
There are only two ETFs, namely the Janus Henderson AAA CLO ETF (JAAA) and AXS First Priority CLO Bond ETF (AAA), that have a track record of approximately three years. Their performance was almost identical over that period, which reflects the same type of underlying credit exposure.
We can benchmark the performance of these two ETFs to the Palmer Square CLO Debt Index (CLODI), which can be considered one of the benchmark indices for CLOs. CLODI is comprised of approximately 1,000 leveraged loans with credit ratings ranging from A to BB and is managed by Palmer Square Capital Management, a fixed-income specialist asset manager. The current average loan life is 5.5 years and the yield to maturity is 9.5%.
We observe that the two ETFs and CLODI exhibited the same trends in performance between 2020 and 2023, although CLODI was more volatile given its lower credit quality.
Source: Finominal
CLO INDEX PERFORMANCE
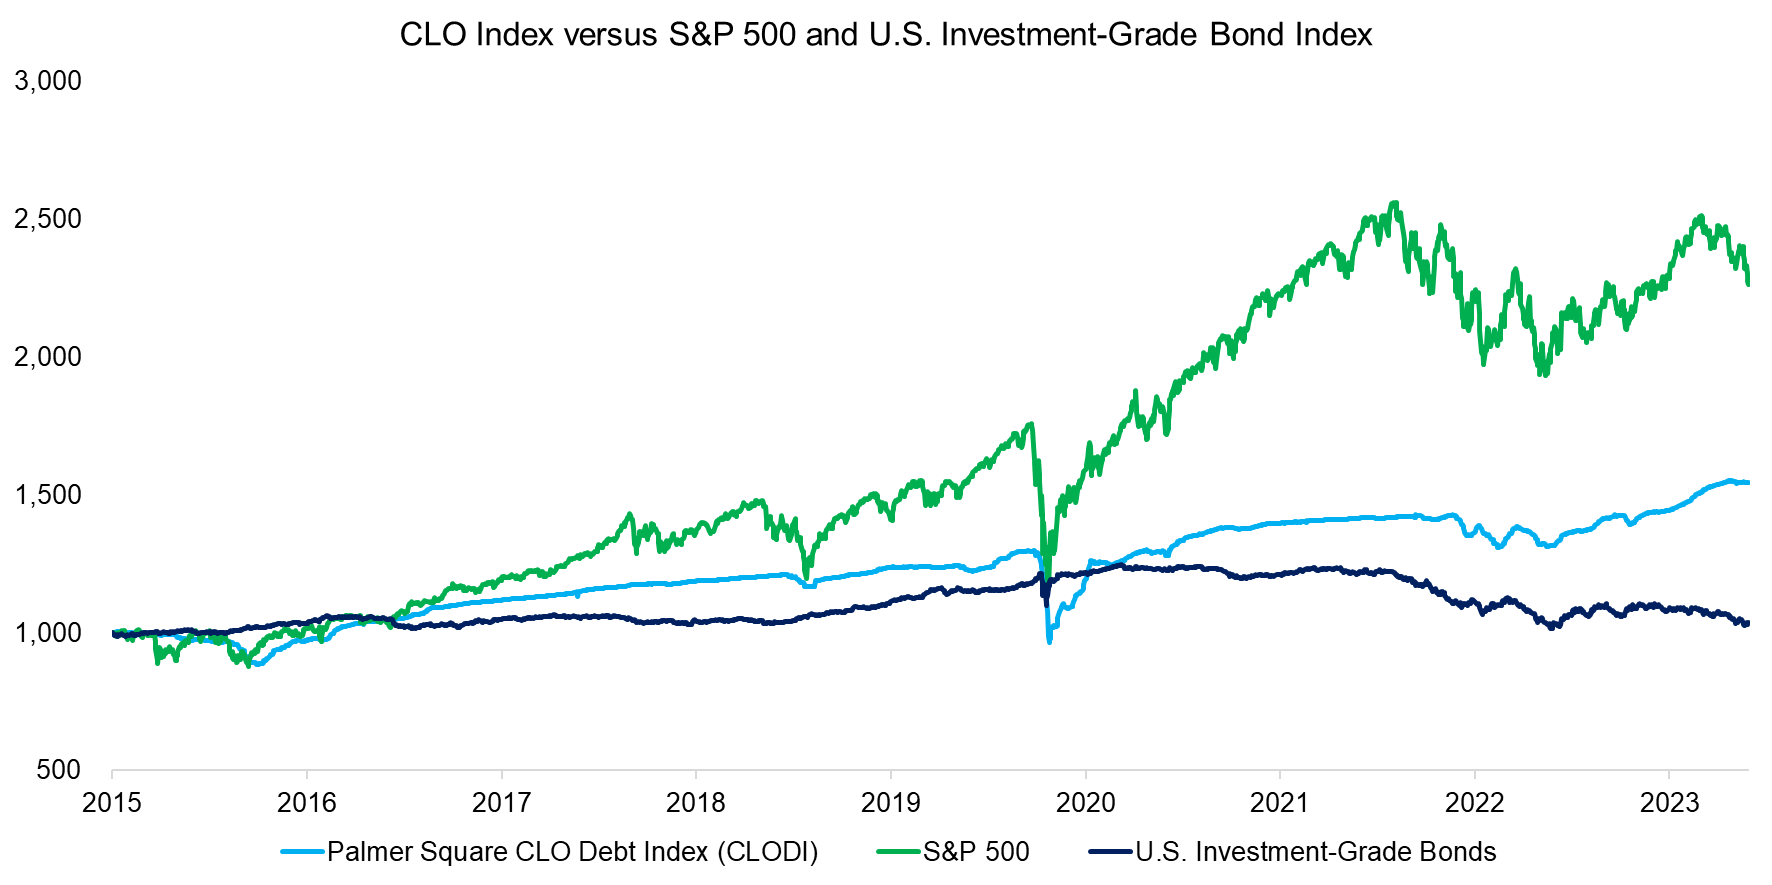
Given the limited track record of CLO ETFs, we focus on the Palmer Square CLO Debt Index for the remainder of this analysis. First, we compare the performance of CLODI to the S&P 500 and a U.S. Investment-Grade Bond Index.
Intuitively, the bond index makes more sense as a benchmark given that CLOs represent a fixed-income product. Asset managers like Blackstone or the Carlyle Group create CLOs by securitizing leveraged loans and combining them into a fund. The loans are typically senior secured loans and each CLO is structured as a series of tranches of interest-paying bonds, along with a small portion of equity. The portfolio construction is similar to that of CDOs, however, issuers improved the quality of CLOs by reducing the average maturity and increasing the credit standards post the global financial crisis in 2008.
However, when we compare the performance of CLODI to the S&P 500 and the bond index, it seems that the trends mirrored those of the U.S. stock rather than the bond market. CLODI and the S&P 500 both experienced drawdowns during 2016, 2020, and 2022.
Source: Finominal
CORRELATION ANALYSIS
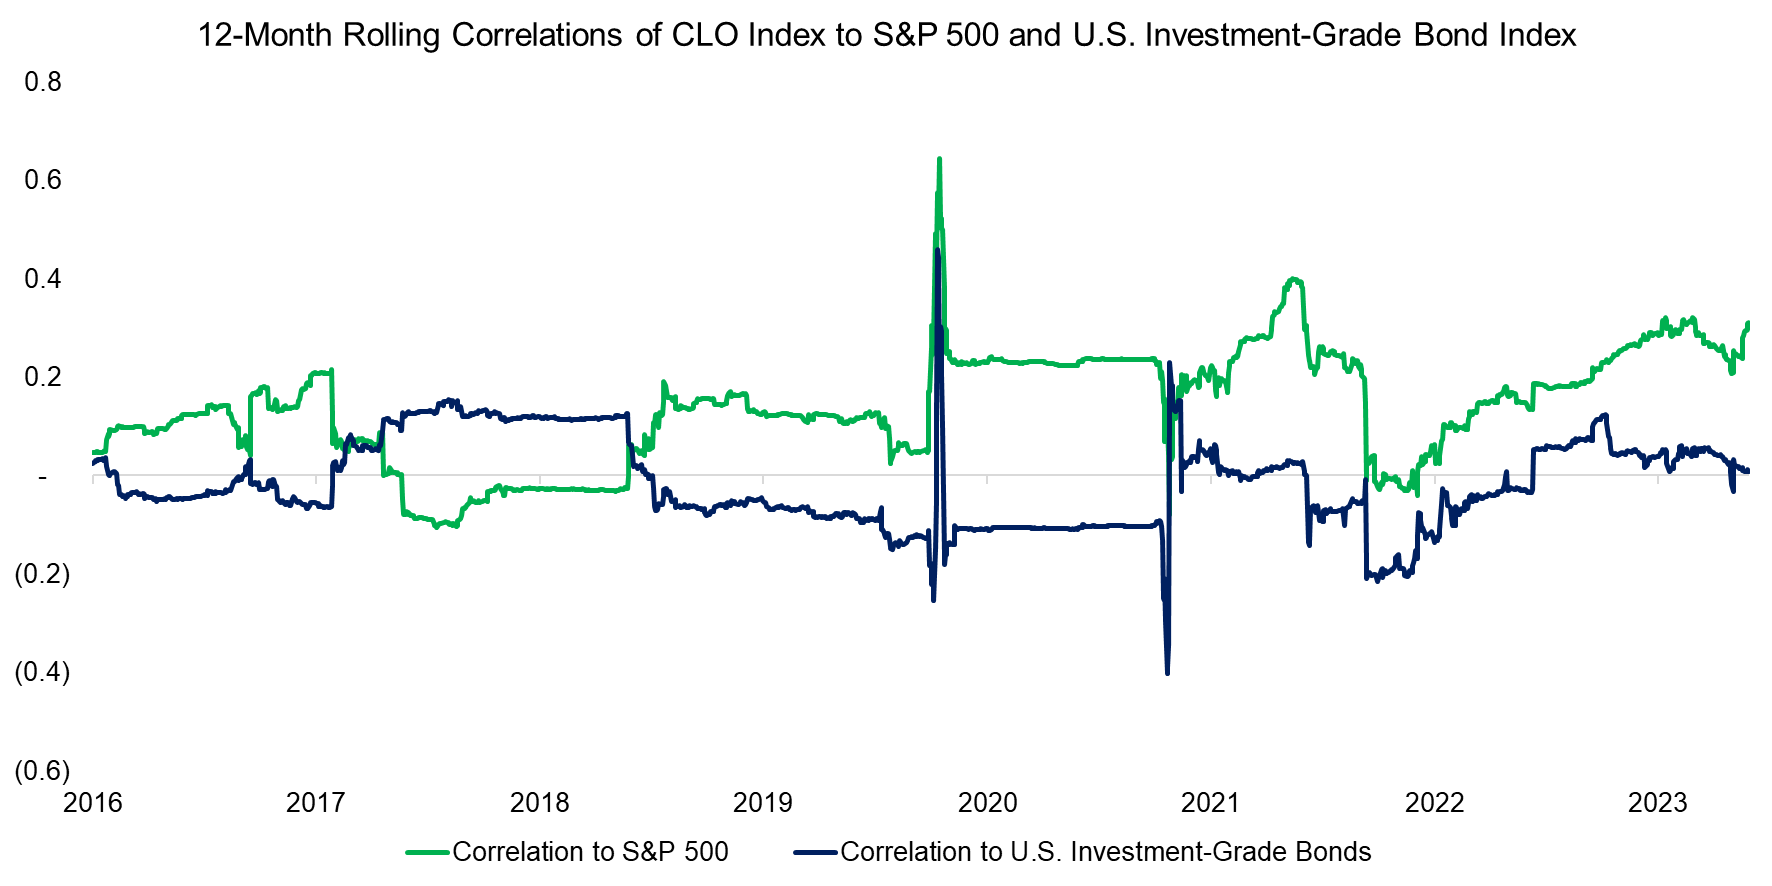
We calculate the 12-month rolling correlations between CLODI and the S&P 500 and the bond index between 2016 and 2023, which highlights zero correlations on average. However, during crisis periods like the pandemic in 2020, correlations spiked as the expectations for loan defaults increased.
It is worth highlighting that the correlation of CLODI to the S&P 500 has steadily increased since 2022, although it is still low at 0.3 from an absolute perspective.
Source: Finominal
CLO INDEX REPLICATION
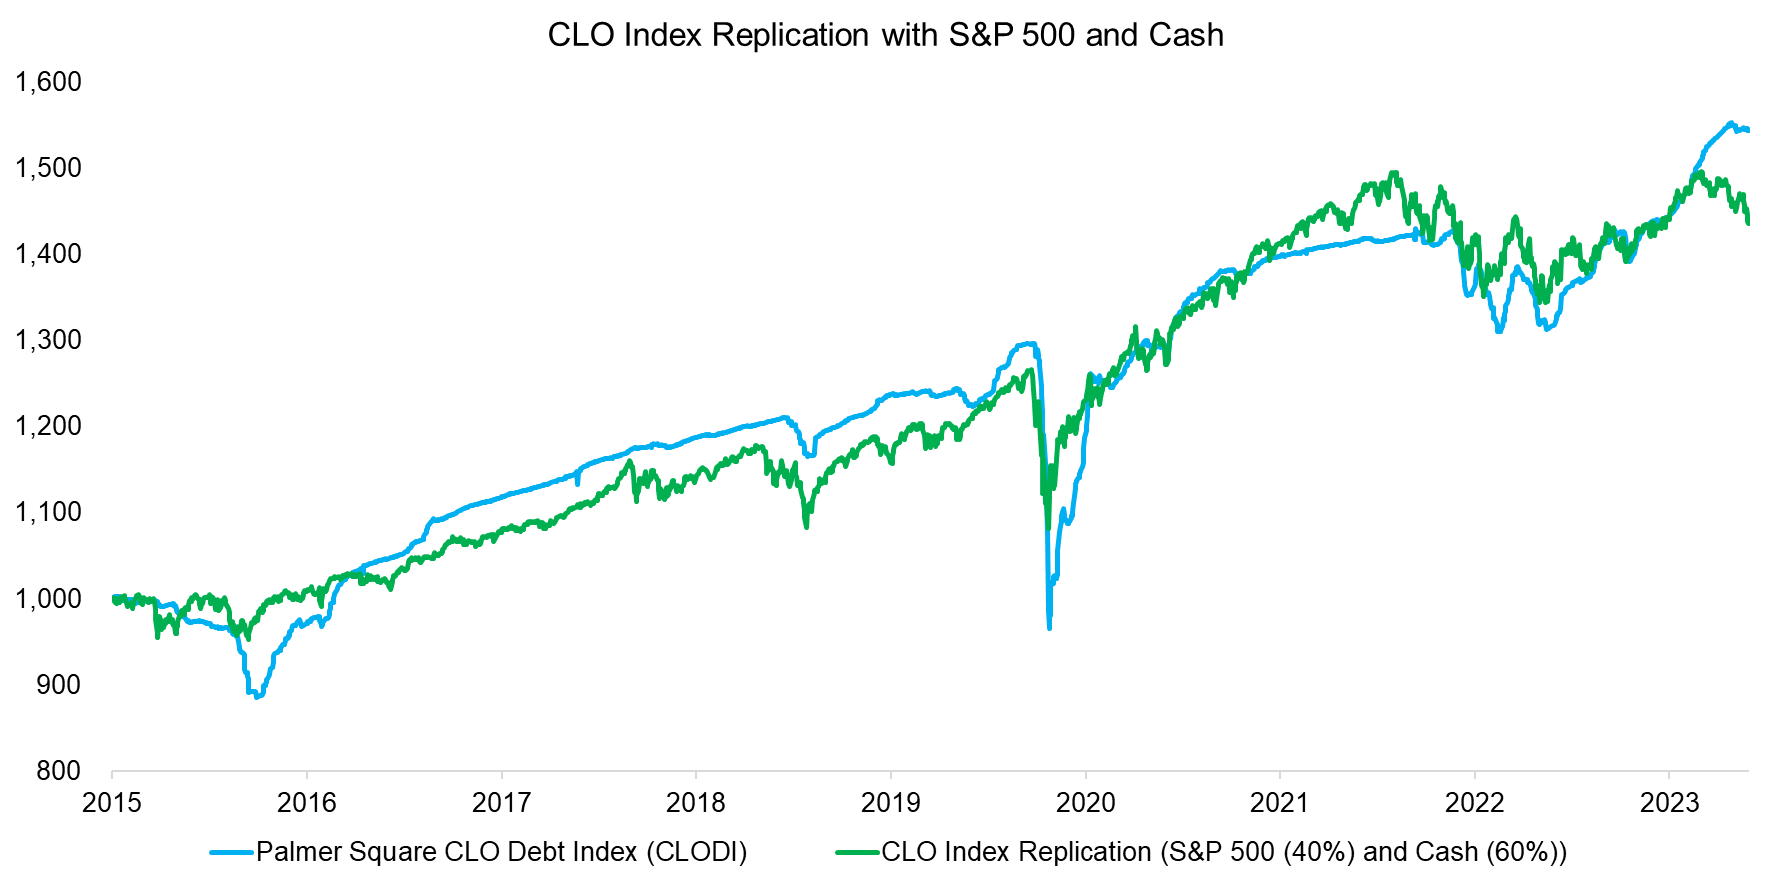
Although the correlation of the CLO index to stocks was close to zero over the last eight years, investors should be concerned that both exhibited drawdowns simultaneously as that indicates similar underlying risk exposures. In the course of our research, we have found that many alternative strategies and esoteric asset classes simply represent diluted equity exposure.
Therefore, we create a replication index comprised of a 40% allocation to the S&P 500 and 60% to non-interest-bearing cash, which would have replicated the performance of CLODI closely since the index’s inception in 2015. The returns over CLODI were less volatile, except during crisis periods. CLOs are not marked-to-market, but marked-to-model, and it seems that the valuers are only adjusting the loan valuations during times of significant market moves (read A Crescendo in Private Credit?).
FURTHER THOUGHTS
One of the selling points of CLO products is that they diversify fixed-income portfolios, which is correct given the low correlation to U.S. investment-grade bonds. However, given that the CLO benchmark index can be replicated simply with the S&P 500 and cash, they can only diversify fixed-income portfolios with equity risk, which naturally is not desirable.
Although CLOs have high credit ratings, the underlying economic exposure seems to be more equity than credit risk, which likely reflects the risky nature of leveraged loans. Overall, CLOs seem reminiscent of CDOs before the global financial crisis, which often featured AAA ratings, but turned out to have much higher default rates than the rating implied (read Don’t Convert to Convertible Bonds and BDCs: Better Don’t Choose?).
RELATED RESEARCH
A Crescendo in Private Credit?
Don’t Convert to Convertible Bonds
BDCs: Better Don’t Choose?
Covered Call Strategies Uncovered
Preferential Times for Preferred Income Strategies?
Analyzing Floating Rate ETFs
The Case Against REITs
The Case Against Equity Income Funds
Resist the Siren Call of High Dividend Yields
Dividend Yield Combinations
Building Better High Yield Portfolios
Private Equity: Fooling Some People All the Time?
Myth Busting: Alts’ Uncorrelated Returns Diversify Portfolios
ABOUT THE AUTHOR
Nicolas Rabener is the CEO & Founder of Finominal, which empowers professional investors with data, technology, and research insights to improve their investment outcomes. Previously he created Jackdaw Capital, an award-winning quantitative hedge fund. Before that Nicolas worked at GIC and Citigroup in London and New York. Nicolas holds a Master of Finance from HHL Leipzig Graduate School of Management, is a CAIA charter holder, and enjoys endurance sports (Ironman & 100km Ultramarathon).
Connect with me on LinkedIn or X.

