Creating a CTA from Scratch
How sophisticated are managed futures strategies?
November 2022. Reading Time: 10 Minutes. Author: Nicolas Rabener.
SUMMARY
- CTAs have become popular again given their positive returns in 2022
- However, they are typically difficult to grasp given their ever-changing portfolios
- Building a CTA from scratch is not complicated and reduces the opaqueness
INTRODUCTION
2022 has been a long year of disappointments for investors. Growth stocks do not go up forever. TIPS do not protect against high inflation. And cryptocurrencies like Bitcoin do not preserve their value.
However, some parts of the capital markets are zero-sum games, i.e. for every loser, there must be a winner. The U.S. Dollar is a clear one, and so are commodities like natural gas that benefit from the war in Ukraine. Some global macro funds have made outsized returns, e.g. Crispin Odey’s main hedge fund is up more than 190%, albeit after years of suffering double-digit losses.
Managed futures strategies, also known as commodity trading advisors (CTAs) or trend following funds, have also generated strong returns. These strategies have become available via ETFs, where the assets under management increased from $200 million to more than $1 billion over the last 12 months (read: Managed Futures: The Empire Strikes Back).
CTAs have a long track record and have been well-researched. However, given their nature of going long or short any market, makes them difficult to understand as their portfolios are ever-changing. We could run a factor exposure analysis to reveal their risk exposures and replicate their returns historically, but instead, we will attempt to create a CTA from scratch.
BUILDING A CTA
The basic investment strategy of a CTA is to follow and exploit trends, regardless of their direction, which is called time-series momentum in academic research. Futures are used in portfolio construction and trends are measured in as many markets as possible. A portfolio might be long the USD / JPY, short the S&P 500, long lean hogs, short gold, etc. Essentially, it’s a highly dynamic but diversified portfolio of long and short positions across a variety of markets. The goal is to provide diversification benefits by offering uncorrelated positive returns to traditional asset classes, which was the case in 2022.
We include 11 bond, 5 equity, 19 currency, and 24 commodity indices in our universe of tradable markets, which is relatively narrow as some CTAs trade up to 200 markets. Trends are defined as positive when the rolling 12-month return is positive, and negative when the return is negative. We are either long or short a market, but never neutral. Rebalancing occurs monthly and trades are entered with a day delay. Transaction costs are excluded (read Momentum Variations).
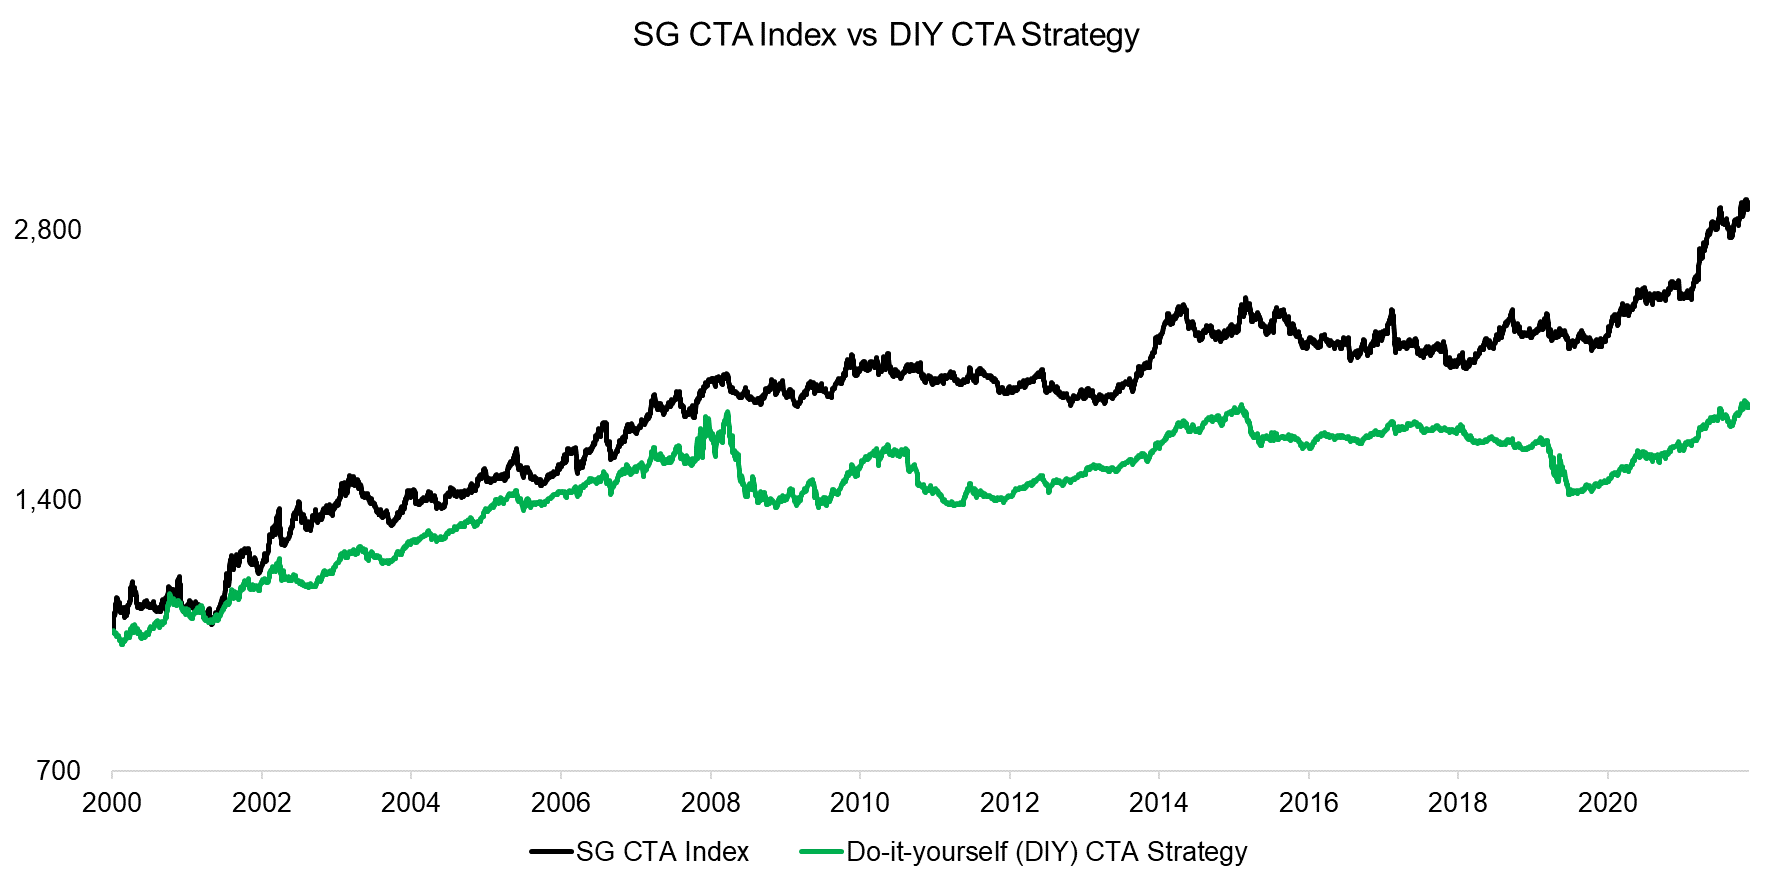
Based on this methodology, we create four indices for each of the asset classes, namely bonds, equities, currencies, and commodities, whose returns are equally-weighted to create a do-it-yourself (DIY) CTA Strategy. We compare this to Societe Generale’s CTA index, which is a benchmark index for the CTA industry, and observe that the trends in performance were approximately similar, but that the CTA index generated a significantly higher return in the period from 2000 to 2022.
Source: Societe Generale, Finominal
VOLATILITY OPTIMIZATION
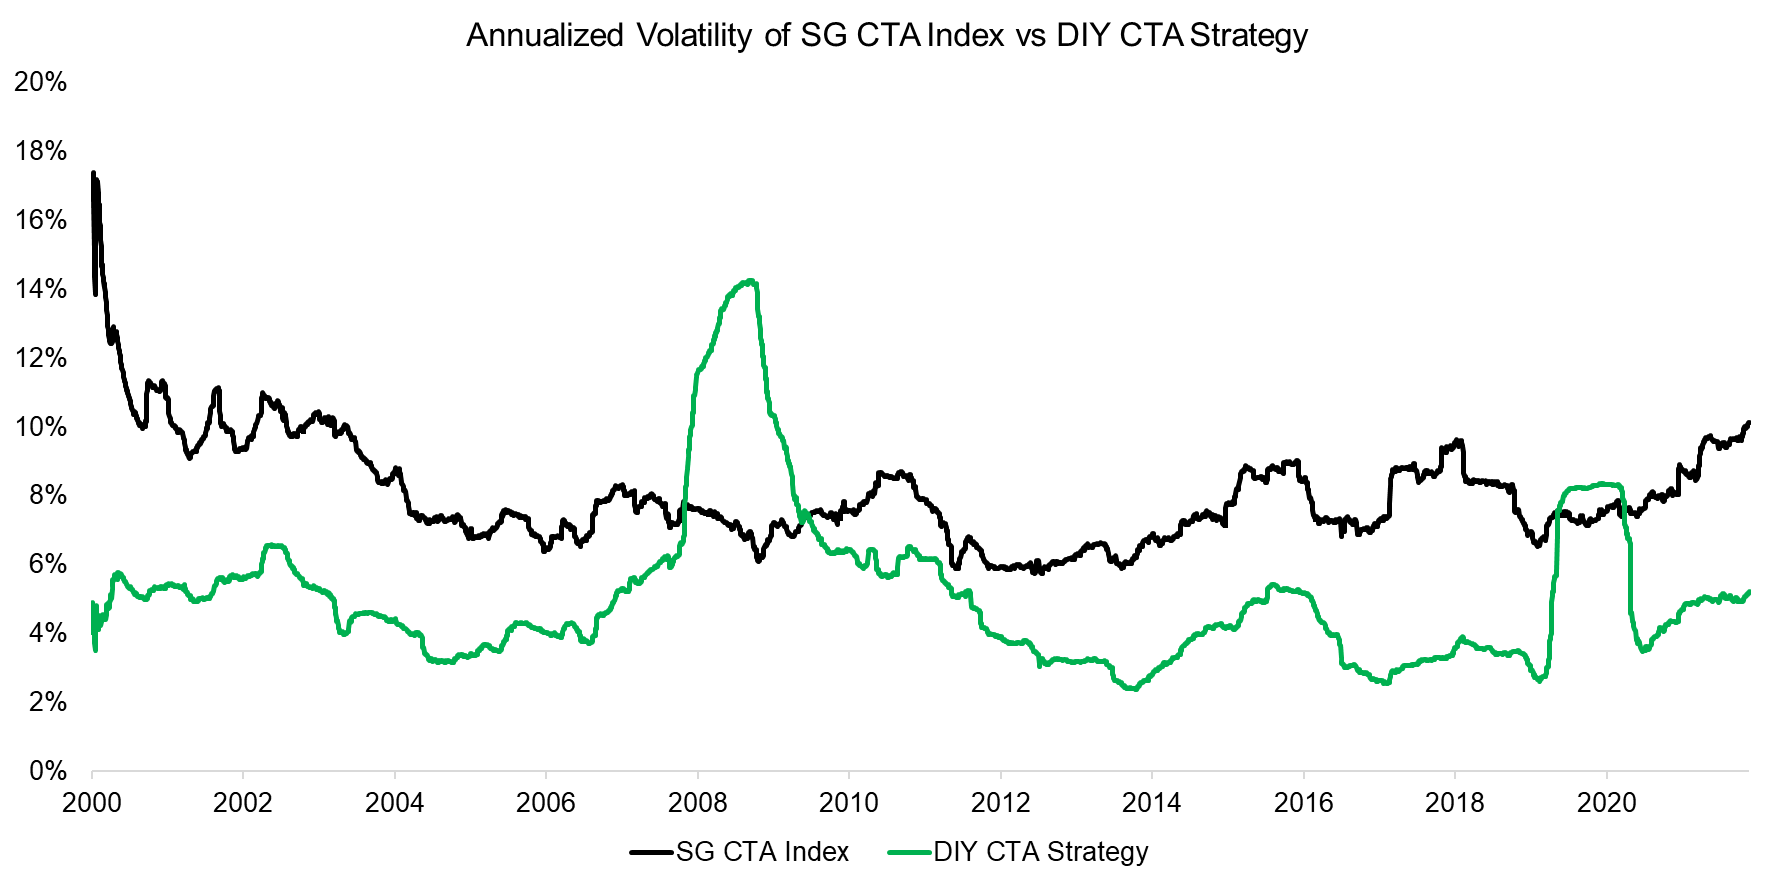
One of the key differences between the SG CTA index and the DIY CTA Strategy is their volatility profiles. The former had an average volatility of 8%, compared to 5% for the latter. Single CTAs can be highly volatile, but this is significantly reduced by combining a few managers into an index like the SG CTA index.
Furthermore, although there were periods where the trend in volatility was similar, e.g. between 2014 and 2016, there were also two markedly different periods, namely the global financial crisis in 2008 and the COVID-19 crisis in 2020. The differences in volatility can be explained by the DIY CTA Strategy having had a higher exposure to equities, i.e. 25% as per its methodology, than the average CTA.
Source: Societe Generale, Finominal
CTA use futures in portfolio construction, which require only a fraction of the available capital for margin. These funds tend to set a target volatility for the portfolio and increase their exposure to markets to reach that. Practically speaking this means leveraging up exposure to low-risk markets such as bonds and currencies, but only moderately to more volatile asset classes like equities and commodities.
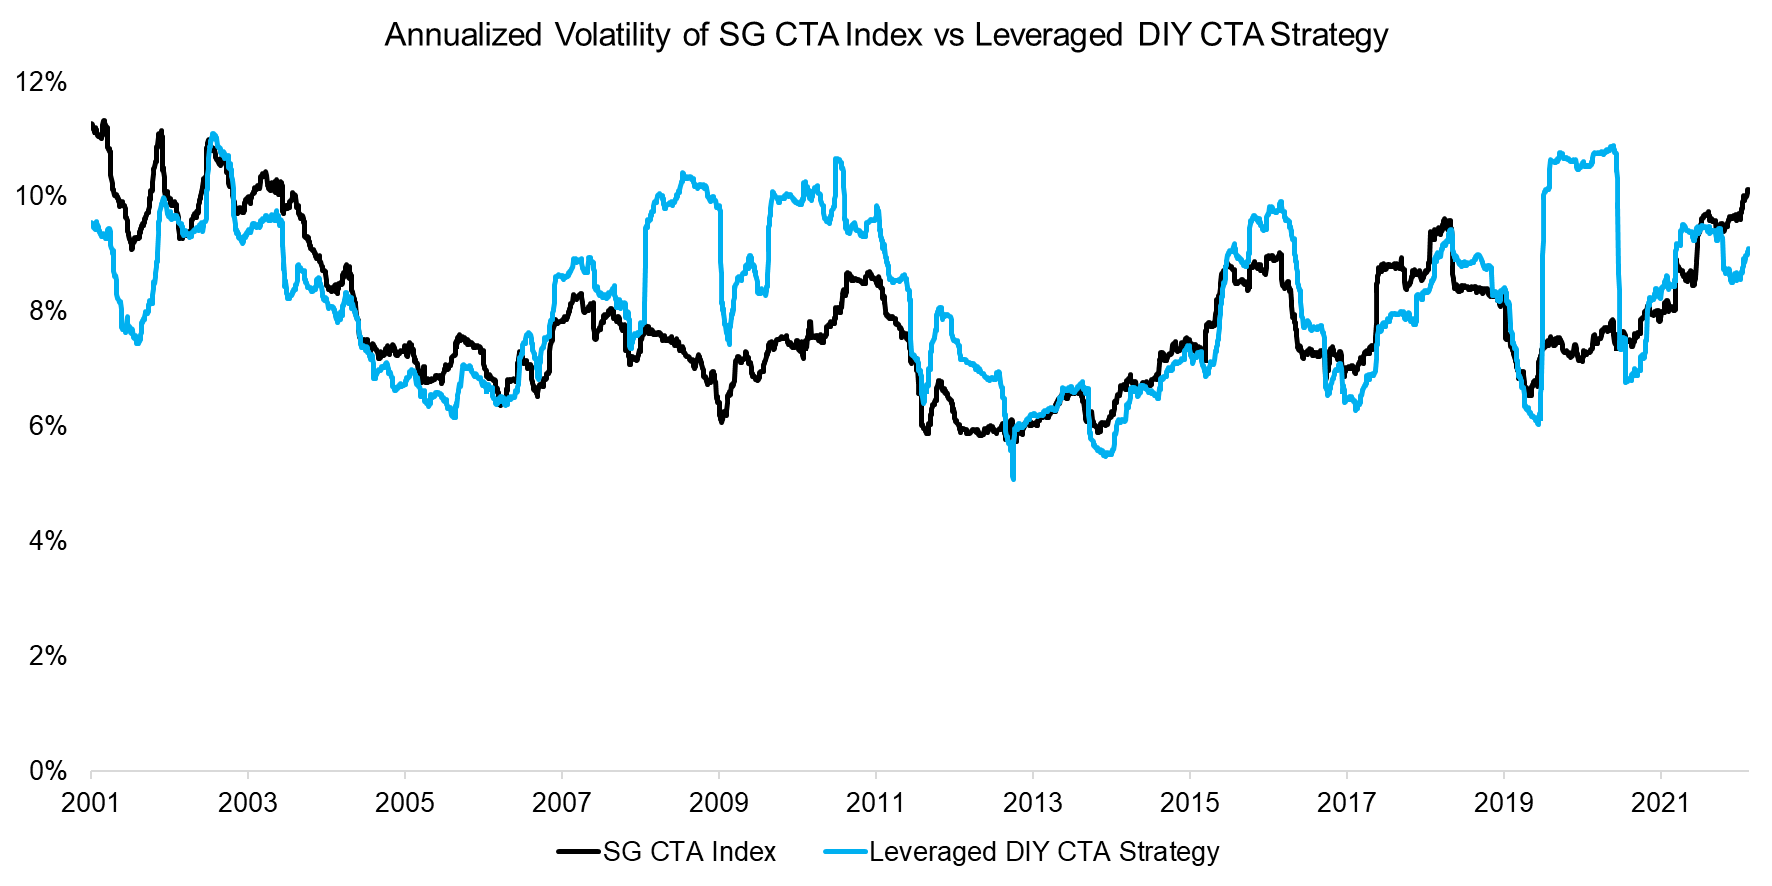
We replicate this by leveraging the four asset classes in the DIY CTA Strategy to the same volatility as the SG CTA Index. Post this operation, the volatility profiles of both are more comparable.
Source: Finominal
LEVERAGED DIY CTA STRATEGY VS SG CTA INDEX
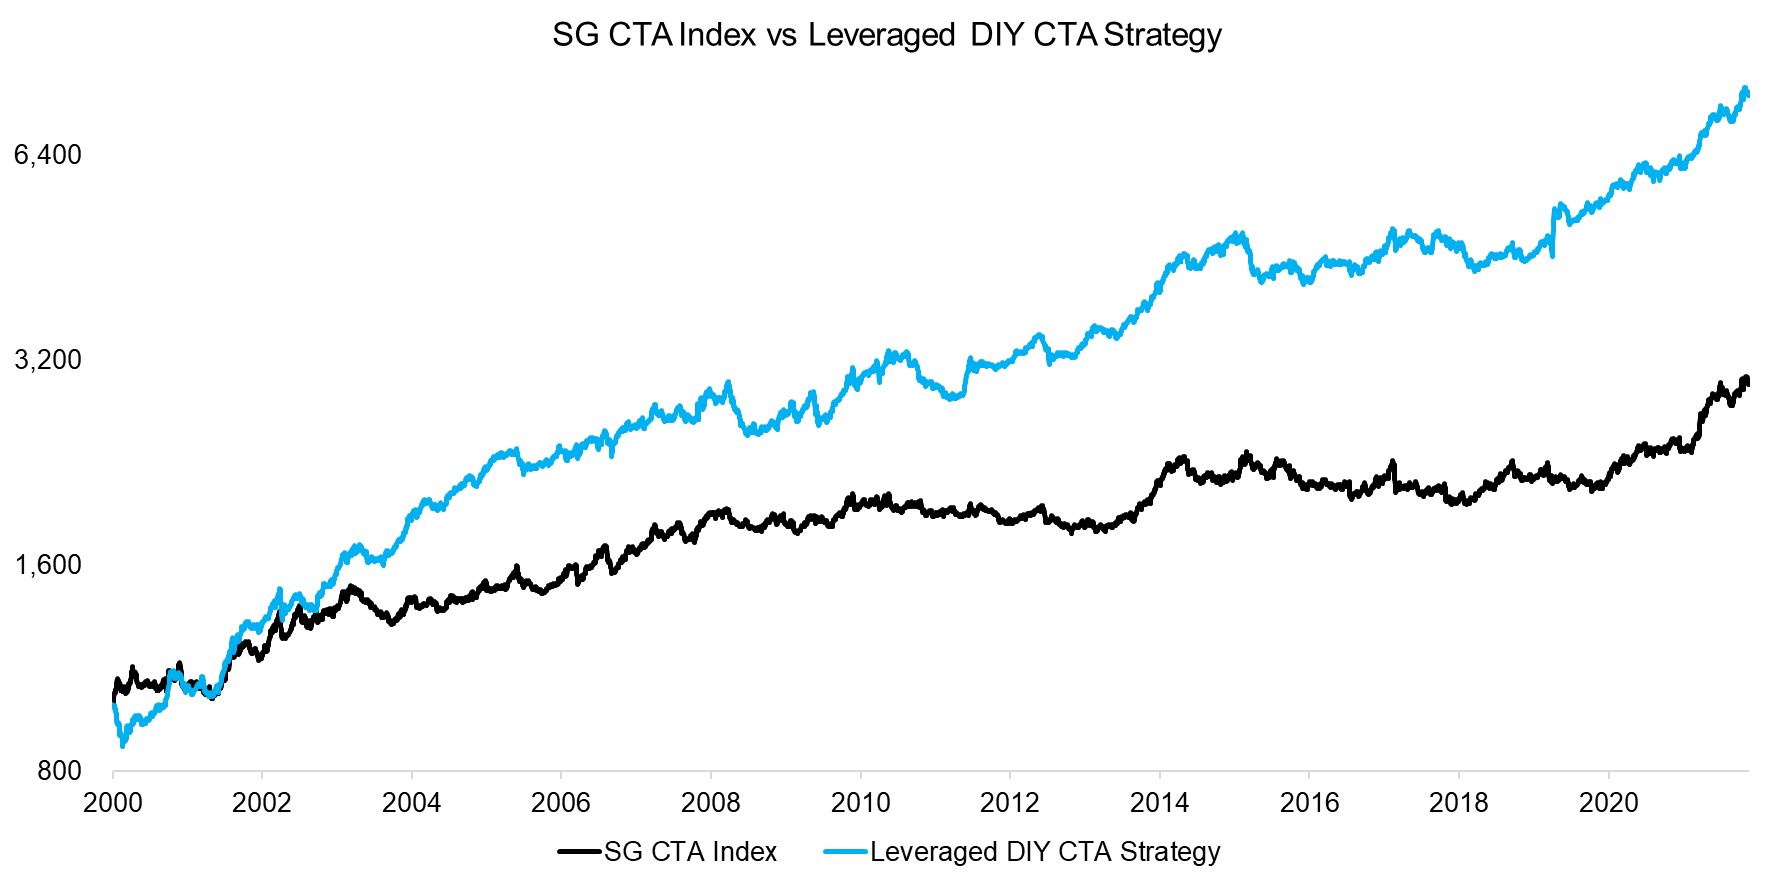
Increasing the leverage of the DIY CTA Strategy increased its performance significantly and led to a higher return than that of the SG CTA Index in the period between 2000 and 2022.
Although its return is overstated as it ignores transaction and implementation costs as well as management and performance fees that a CTA manager would charge, we observe that broadly speaking the Leveraged DIY CTA Strategy generated a similar performance to the SG CTA Index.
Source: Societe Generale, Finominal
CORRELATION ANALYSIS
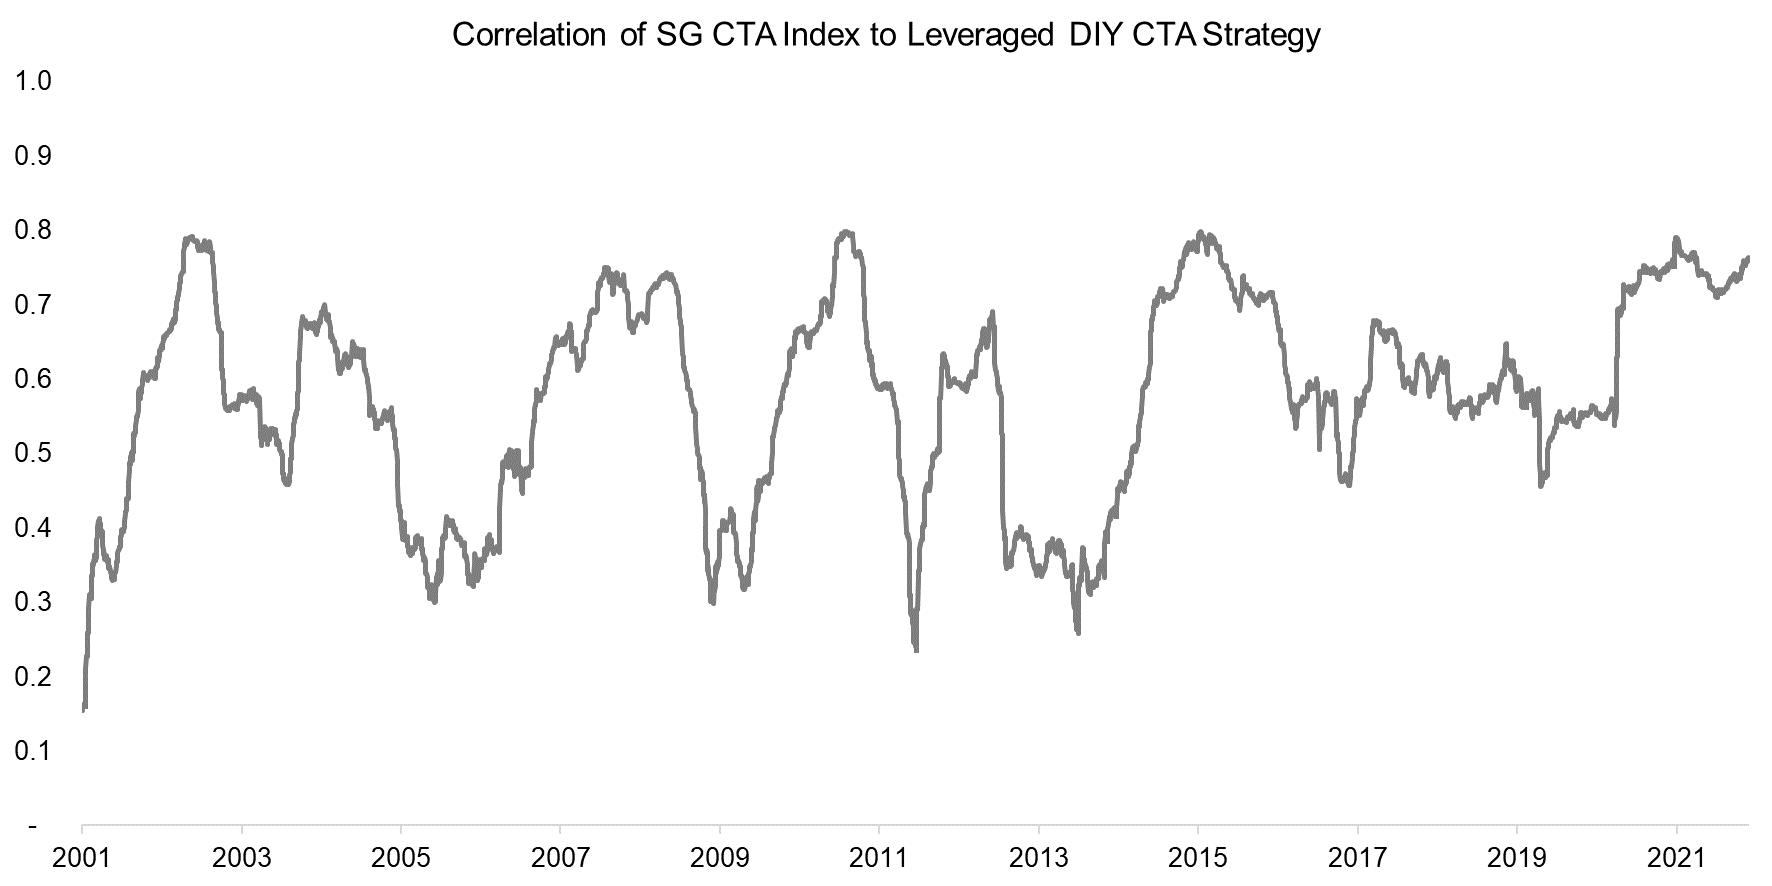
Finally, we calculate the correlation between the DIY CTA Strategy and SG CTA Index, which was 0.5 on average. At times, the correlation was close to 0.8, e.g. during the last couple of years, which indicates similar underlying portfolios.
Source: Societe Generale, Finominal
FURTHER THOUGHTS
Given an average correlation of 0.5, the DIY CTA Strategy might be discarded for not being close enough to what CTAs are doing.
However, it is worth highlighting the simplicity of creating the DIY CTA strategy. We included a relatively small number of tradable markets, used a simple 12-month rolling return to measure trends, and implemented a simple weighting methodology for capital allocations. The backtest did not require complex code in Python, but was done from scratch in Excel and took less than 3 hours to complete. Trend can be an uncomplicated friend.
RELATED RESEARCH
Managed Futures: The Empire Strikes Back
Defensive & Diversifying Strategies in YTD 2022
Building a Diversified Portfolio for the Long-Term – Part II
Managed Futures: Fast & Furious vs Slow & Steady
Hedging via Managed Futures Liquid Alts
60/40 Portfolios Without Bonds
A Horse Race of Liquid Alternatives
Liquid Alternatives: Alternative Enough?
Hedge Fund ETFs
Market Neutral Funds: Powered by Beta?
ABOUT THE AUTHOR
Nicolas Rabener is the CEO & Founder of Finominal, which empowers professional investors with data, technology, and research insights to improve their investment outcomes. Previously he created Jackdaw Capital, an award-winning quantitative hedge fund. Before that Nicolas worked at GIC and Citigroup in London and New York. Nicolas holds a Master of Finance from HHL Leipzig Graduate School of Management, is a CAIA charter holder, and enjoys endurance sports (Ironman & 100km Ultramarathon).
Connect with me on LinkedIn or X.

