CTAs: With or Without Trend Following in Equities?
Evaluating the equity risk exposure within managed futures
June 2024. Reading Time: 10 Minutes. Author: Nicolas Rabener.
SUMMARY
- CTAs benefitted significantly from pursuing trend following in equities
- Excluding equities from a managed futures strategy would have decreased the return
- However, CTAs without equities would still have generated attractive diversification benefits
INTRODUCTION
There often is a large discrepancy between what investors are talking about and what they are allocating to. Take managed futures as an example, these have become more popular in financial blogs and threads on X as they generated attractive diversification benefits in 2022 when stocks and bonds declined.
However, the assets under management in the managed futures industry are $336 billion as of the end of 2023, almost the same as the $359 billion in 2013 with hardly any meaningful in or outflows over the last decade, as per BarclayHedge (read Managed Futures: The Empire Strikes Back).
Although managed futures, which are also called CTAs, have demonstrated their utility for asset allocation in recent years, the manager returns are quite dispersed. There are differences in how trends are measured and exploited, how trades are implemented, and what the universe of tradeable instruments comprises.
One key debate is whether equities should be included as a tradable asset class as most investors already have equity exposure in their portfolios. CTAs can naturally short equities, but shorting equities is difficult as stock market crashes are often short and swift, which makes them difficult to exploit with trend following models (read Trend Following in Bear Markets).
In this article, we will contrast CTAs with and without an equities allocation.
FACTOR EXPOSURE ANALYSIS
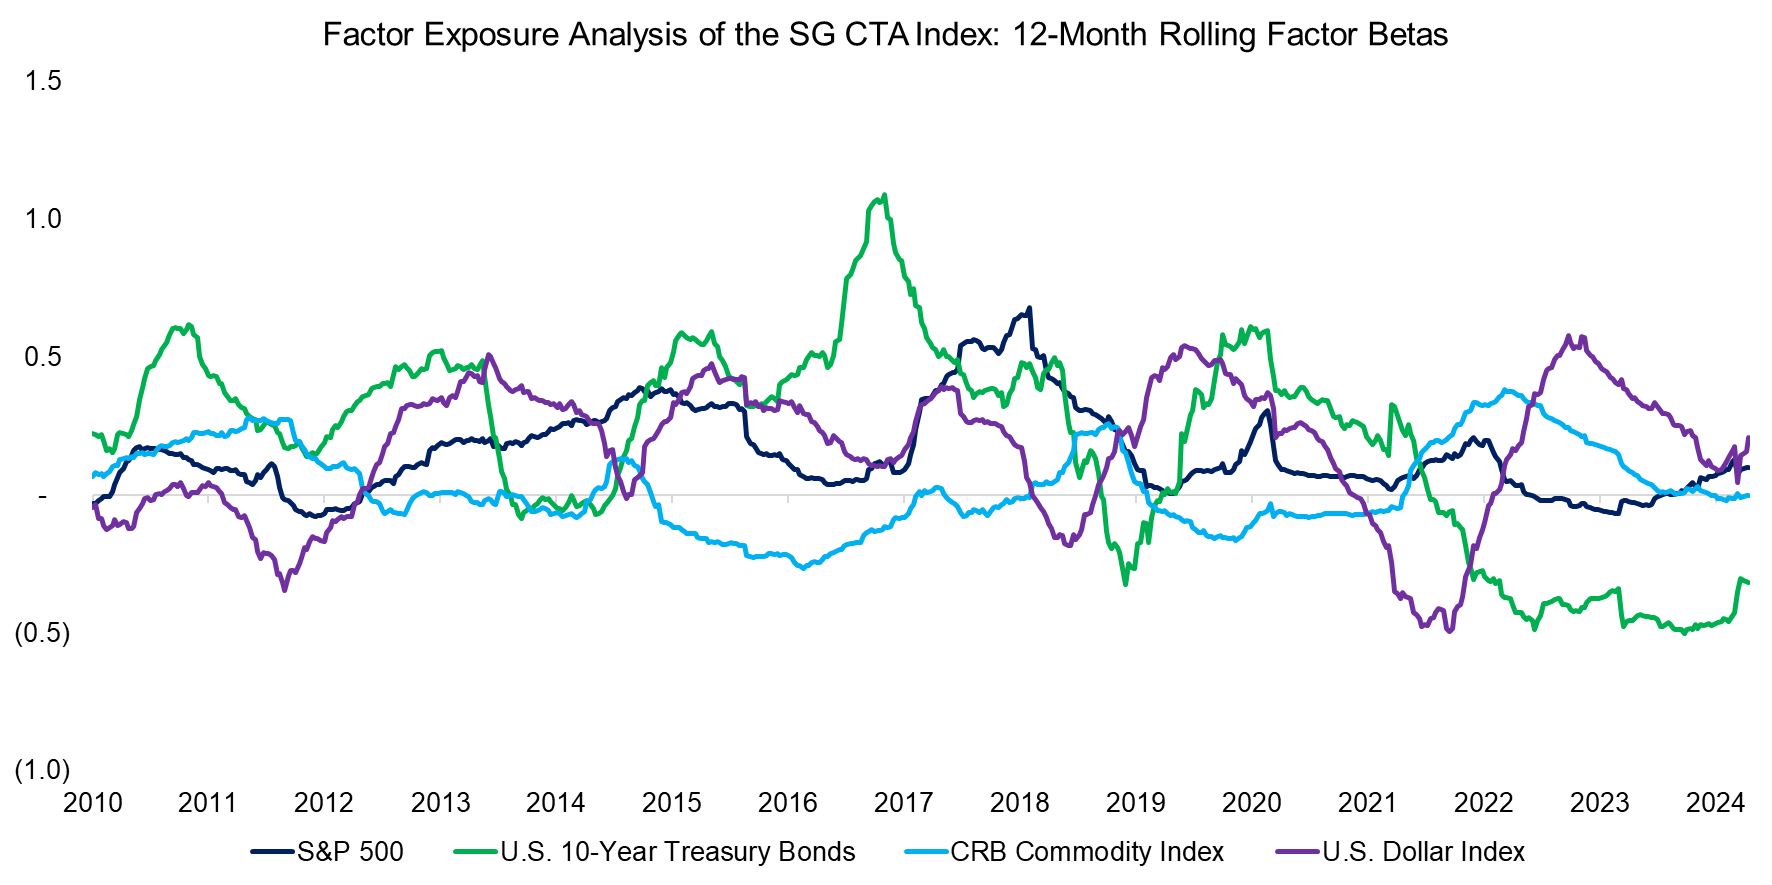
The SG CTA Index is the benchmark index for the managed futures industry. We can replicate this index from scratch by exploiting trends over numerous asset classes (read Creating a CTA from Scratch – II and Creating a CTA from Scratch) and build a portfolio bottom-up, or can measure the betas to major asset classes for a regression-based top-down replication portfolio (read Replicating a CTA via Factor Exposures). We do the latter where we measure the betas of the SG CTA Index to the S&P 500, 10-Year U.S. Treasury bonds, commodities, and the U.S. Dollar Index with a 12-month lookback, allocate to these asset classes based on their betas, and rebalance the portfolio monthly.
We observe that the exposure of the SG CTA Index to these four major asset classes has fluctuated significantly in the period since 2010, which is expected given that these markets went through multiple bull and bear markets that CTAs aimed to exploit.
Source: Finominal
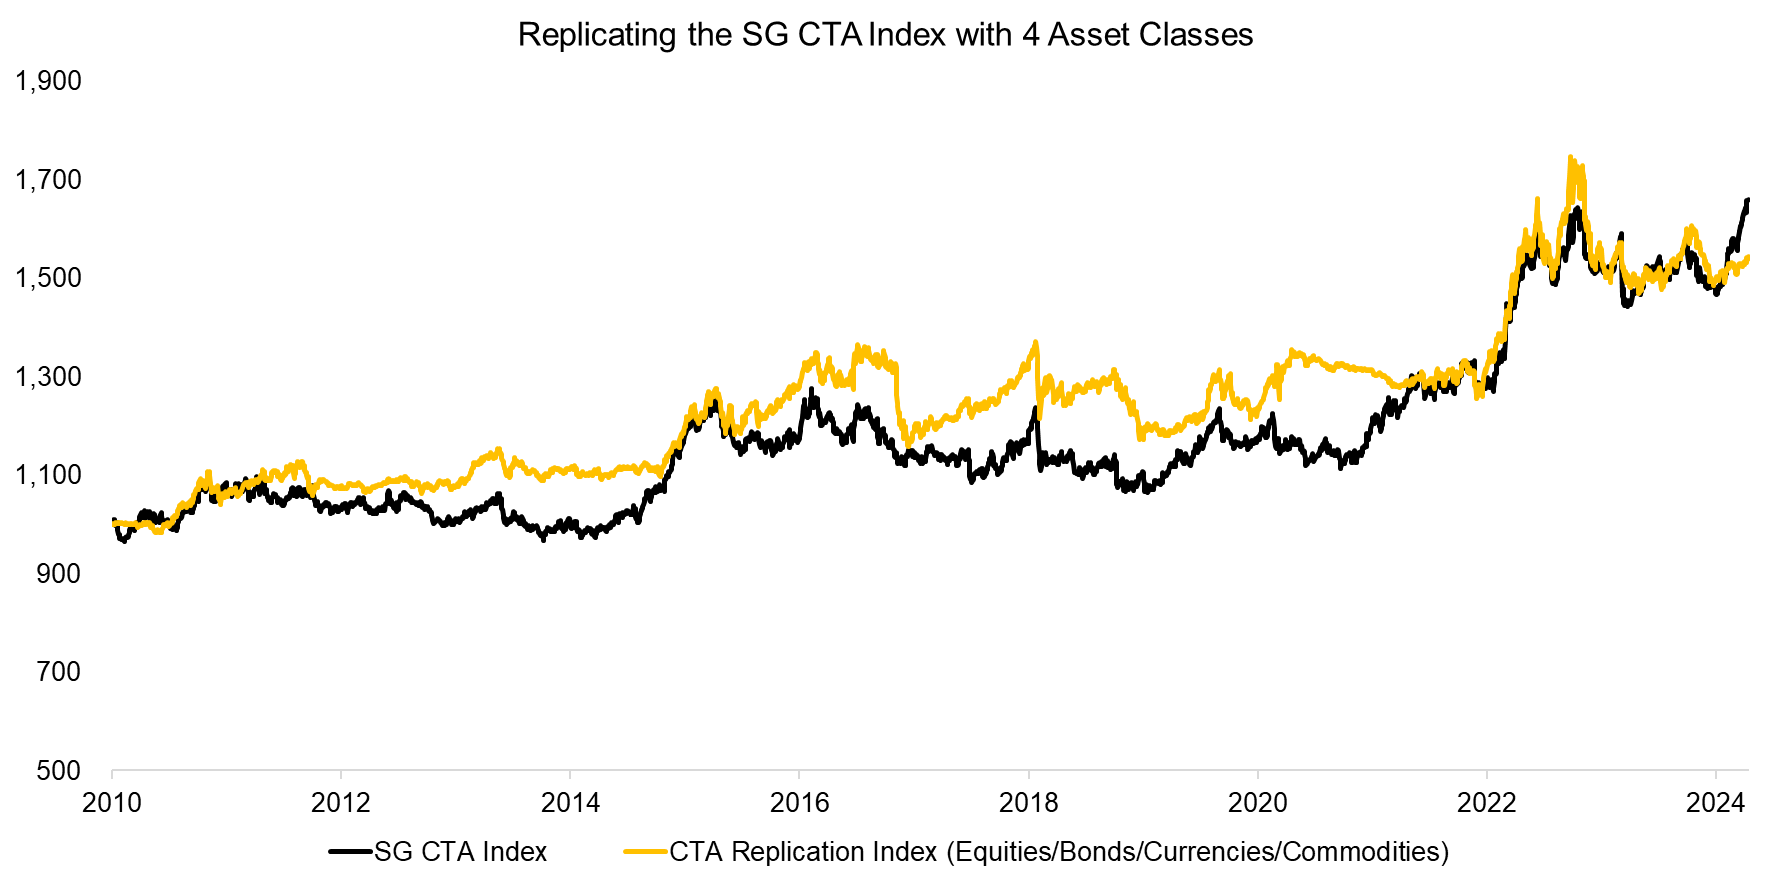
Comparing the performance of the SG CTA Index to its replication index highlights some similarities, but also some differences. The average correlation was 0.4 between 2010 and 2024, but ranged between -0.1 and 0.8. The correlation would be higher if the replication was achieved by creating a CTA from scratch by applying trend following rules to individual future contracts, but we prefer the top-down regression-based approach in this analysis as it only requires four ETFs. It’s crude but simple.
Source: Finominal
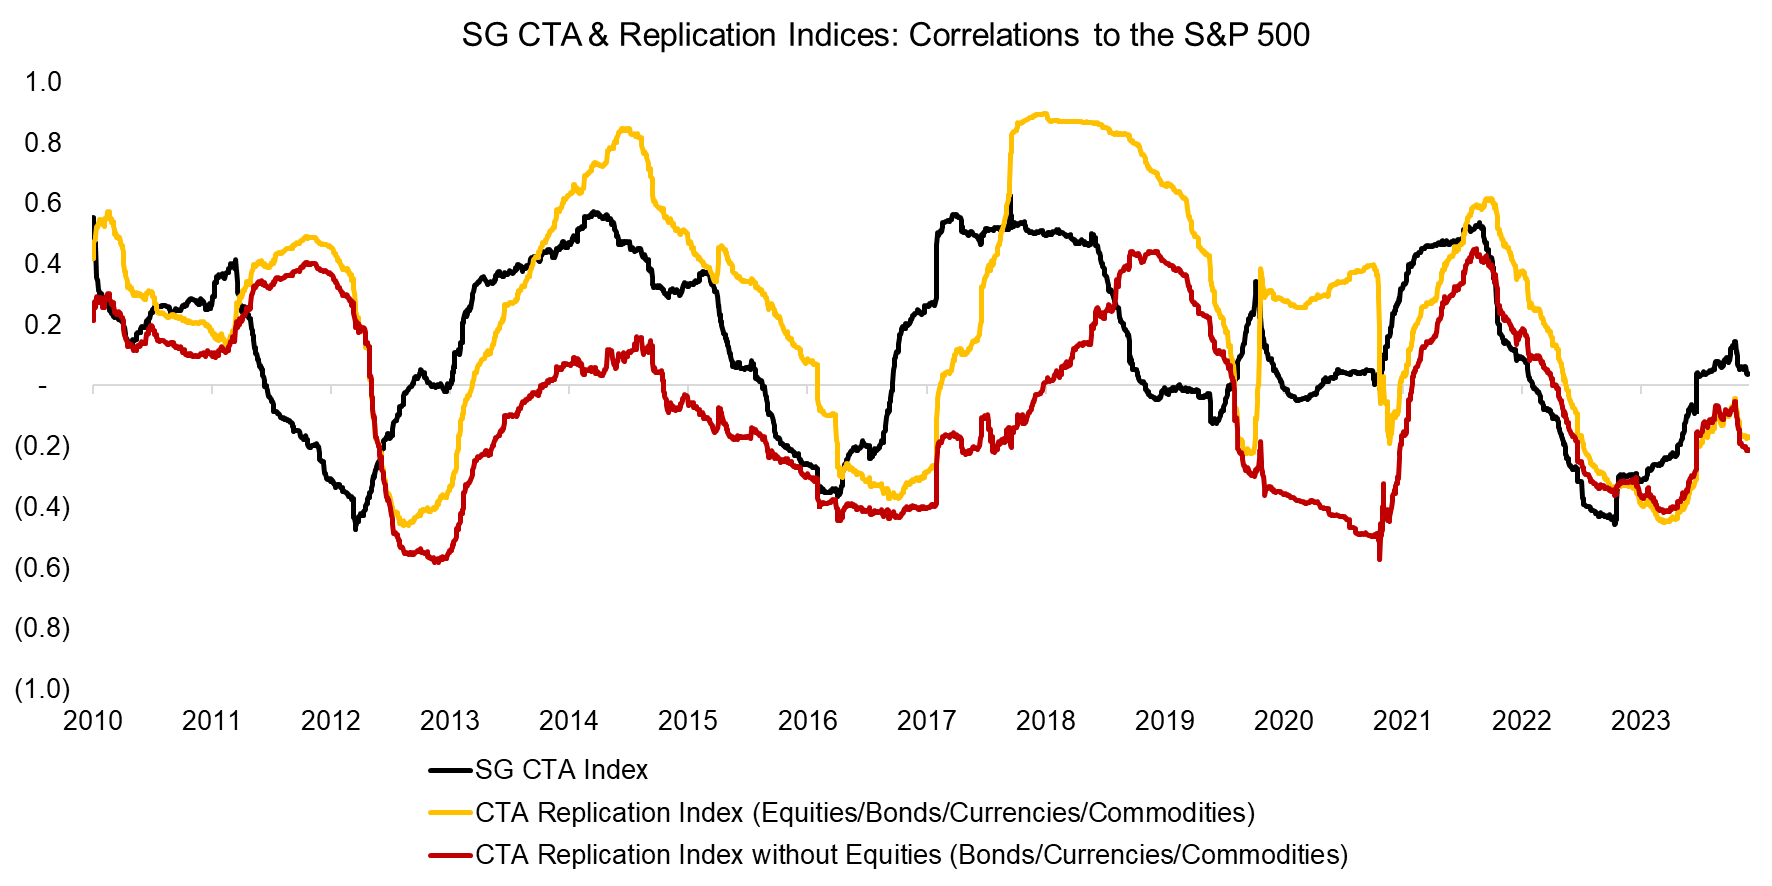
Next, we simply remove the S&P 500 from the set of four asset classes in the regression and rerun the replication index, which results in an index that has achieved a significantly lower return (0.8% pa) than the SG CTA Index (3.6% pa) and the original replication index (3.1%).
However, we also observe that there still were many shared trends, where the strong returns in 2022 are most prominent. All three indices were short bonds as these were declining when central banks started increasing interest rates to battle inflation.
Source: Finominal
CORRELATION ANALYSIS
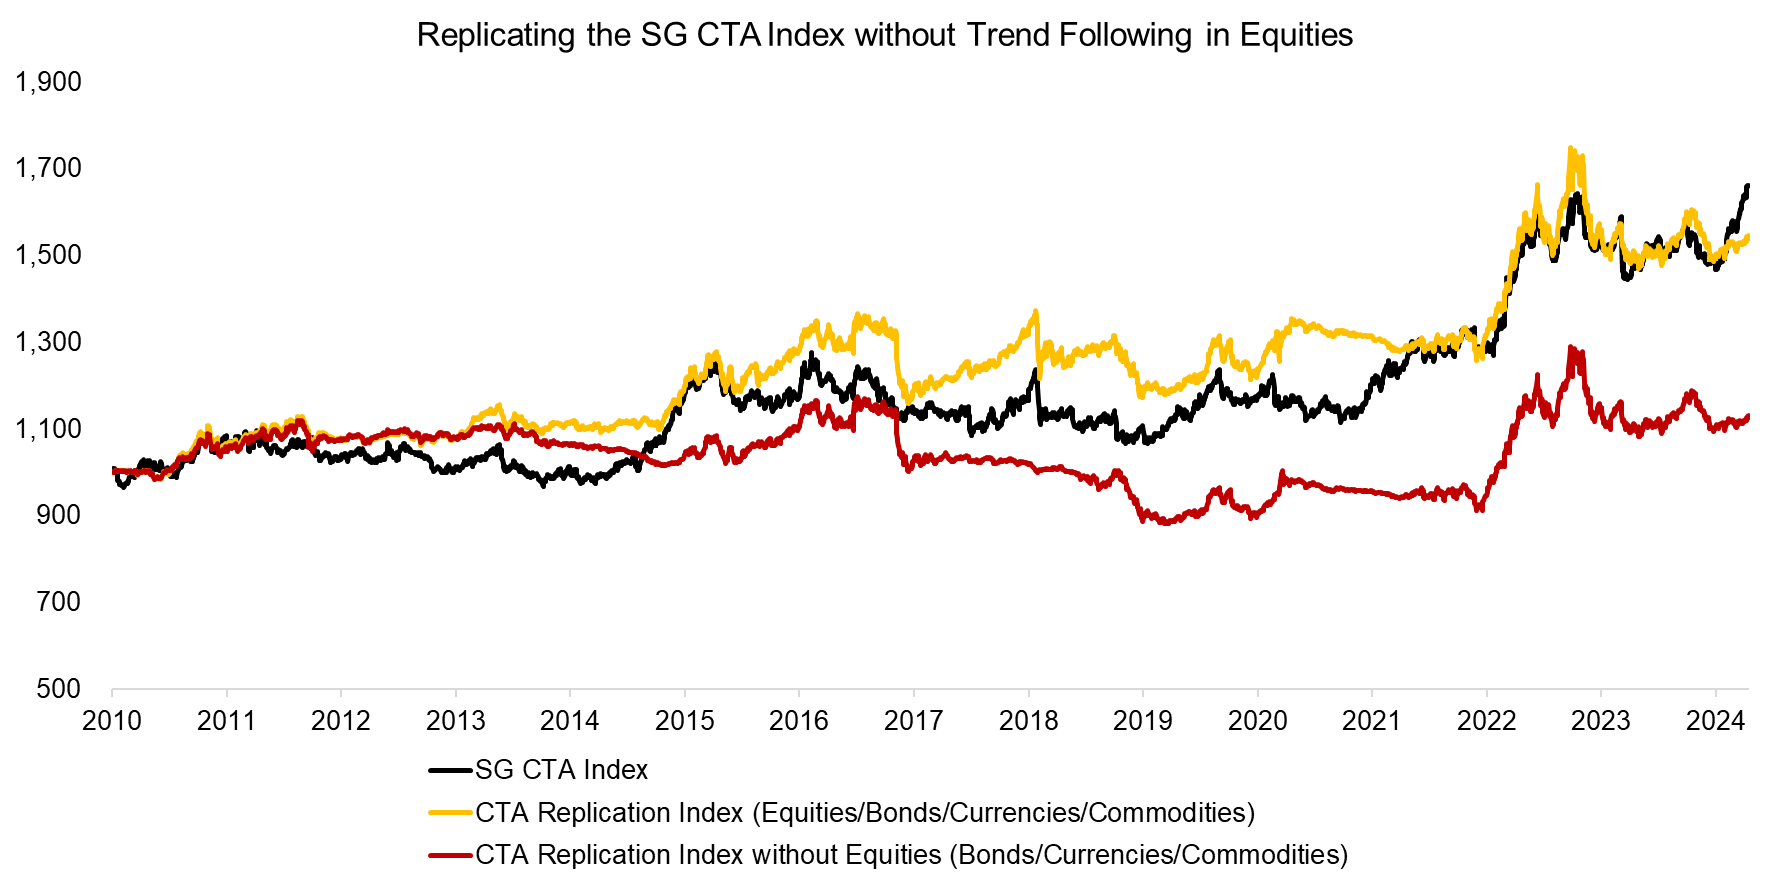
We can measure the correlations of all three indices to the S&P 500, which highlights an average correlation of 0.1 for the SG CTA Index, 0.2 for the CTA Replication Index, and -0.1 for the CTA Replication Index without Equities.
Source: Finominal
QUANTIFYING DIVERSIFICATION BENEFITS
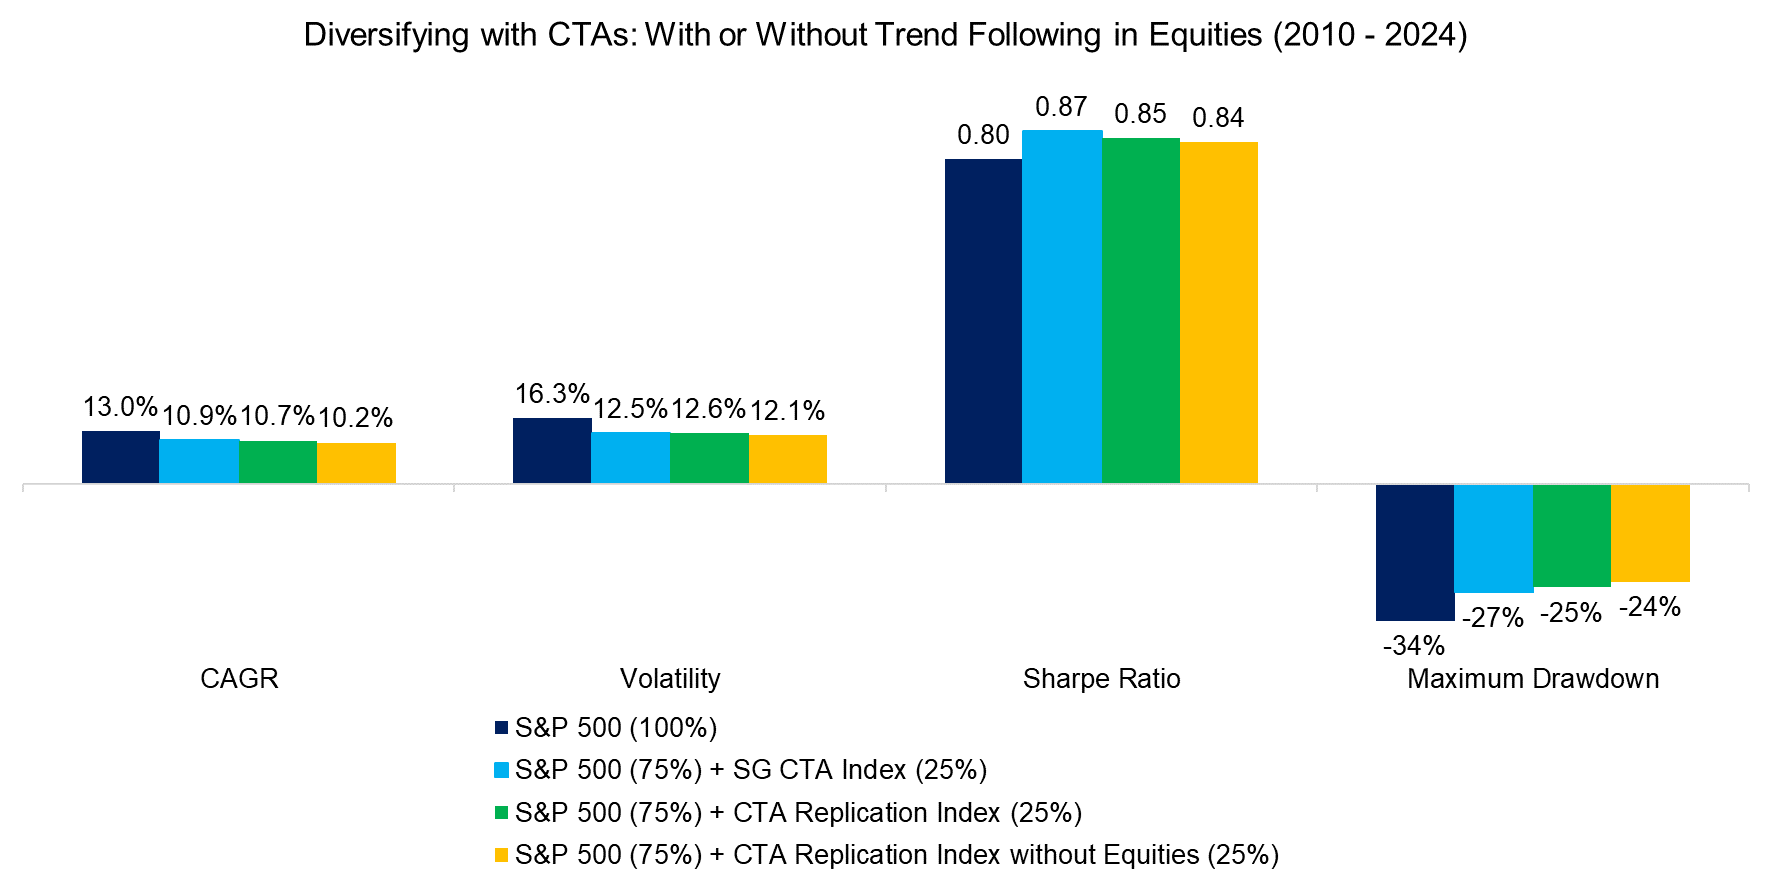
Finally, we evaluate the diversification benefits of adding managed futures to an equities portfolio comprised exclusively of the S&P 500. We observe that the CAGR decreased when adding a 25% allocation to CTAs in the period from 2010 to 2024, but also a decrease in the annualized volatility, which effectively led to an increase in the Sharpe ratio.
The CTA Replication Index without Equities generated the smallest increase in the Sharpe ratio, but also the largest decrease in the maximum drawdown, which is expected given that this index features the lowest correlation to the S&P 500.
Source: Finominal
FURTHER THOUGHTS
What have we learned from this analysis?
First, although the replication of the SG CTA Index can be challenged for its simplicity, it suggests that a significant return from CTAs since 2010 can be attributed to the equities allocation. Second, excluding equities from the managed futures strategy would have generated similar diversification benefits. Naturally, the annual return would have been slightly lower, but we can explain this through exposure to the strong bull market over the last 14 years, which does not necessarily need to repeat itself. If you diversify, better to do it properly.
RELATED RESEARCH
Bonds versus CTAs for Diversification
Carry versus Trend Following
Trend Following in Equities
Trend Following in Bear Markets
Replicating a CTA via Factor Exposures
Creating a CTA from Scratch – II
CTAs vs Global Macro Hedge Funds
Managed Futures: The Empire Strikes Back
Managed Futures: Fast & Furious vs Slow & Steady
Hedging via Managed Futures Liquid Alts
ABOUT THE AUTHOR
Nicolas Rabener is the CEO & Founder of Finominal, which empowers professional investors with data, technology, and research insights to improve their investment outcomes. Previously he created Jackdaw Capital, an award-winning quantitative hedge fund. Before that Nicolas worked at GIC and Citigroup in London and New York. Nicolas holds a Master of Finance from HHL Leipzig Graduate School of Management, is a CAIA charter holder, and enjoys endurance sports (Ironman & 100km Ultramarathon).
Connect with me on LinkedIn or X.

