Death, Taxes and Mean-Reversion
Waiting for Volatility
October 2017. Reading Time: 10 Minutes. Author: Nicolas Rabener.
Notice: This research note was originally published in October 2017 and was updated in May 2018 as the results changed slightly due to more accurate backtesting models. The update nearly exclusively impacted the charts and the conclusions remain the same as originally published.
SUMMARY
- Mean-reversion has not performed well over the last few years
- Highly sensitive to model assumptions
- The strategy is an attractive addition for an equity-centric portfolio
INTRODUCTION
According to Benjamin Franklin death and taxes are the only two certainties in life. In finance, where much is uncertain, especially the future, mean-reversion might be considered a certainty. Mean-reversion can be defined in a variety of ways and applied to basically any variable. Economies that grow too quickly, often experience a downturn. Asset classes that reach excessive valuations, tend to correct. On stock markets we can differentiate between long-term and short-term mean-reversion. Value can be considered long-term mean-reversion as investors are buying stocks that have drifted downwards from a price and valuation perspective, speculating on a reversal. However, many investors also bet on short-term mean-reversion, e.g. when a favourite stock sold off too quickly from their perspective. In this short research note we will focus on short-term mean-reversion in the US stock market. We will analyse its performance, the intricacies of the strategy, and the use of the strategy for an equity-centric portfolio.
METHODOLOGY
Long-short mean-reversion portfolios are created by buying last week’s losers and selling last week’s winners. Portfolios are rebalanced on a weekly basis, making this a very high turnover strategy. The universe is defined as the top and bottom 2.5% of all US stocks with a market capitalization above $1bn. Per transaction 5bps are charged.
MEAN-REVERSION (LONG / SHORT) IN THE US
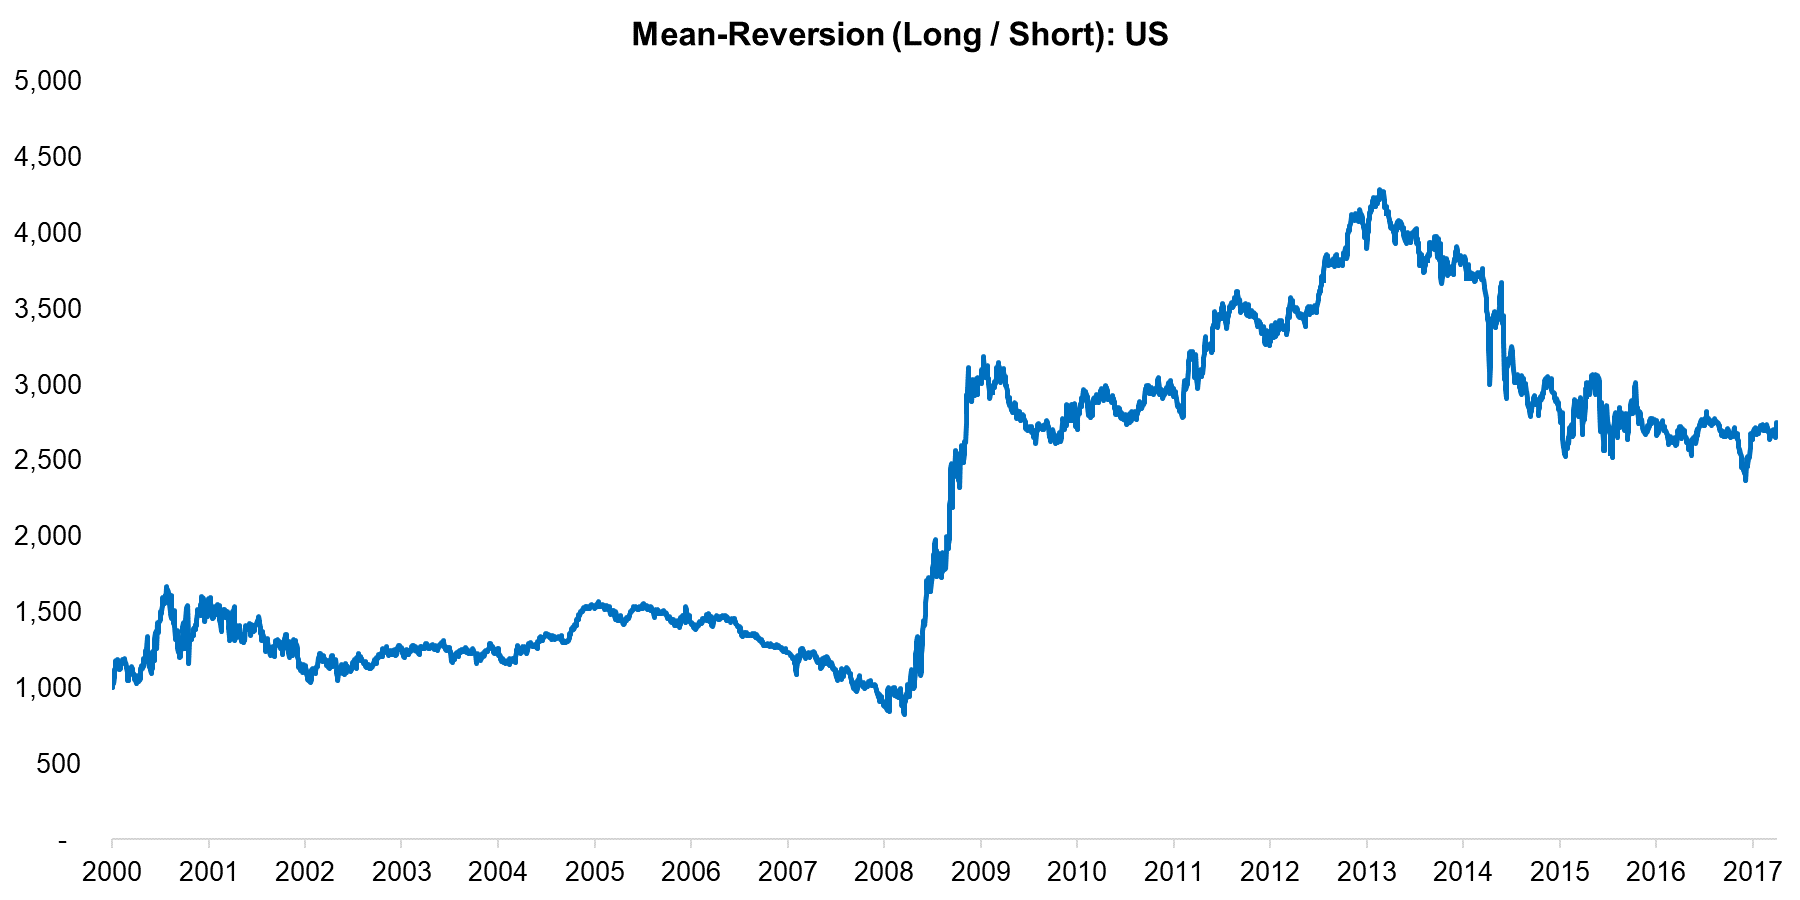
The chart below shows the mean-reversion strategy in the US from 2000 to 2017. We can observe an initial rise after the Tech bubble implosion in the 2000s, then a flat performance until the Global Financial Crisis, a large increase in the depth of the crisis, and thereafter mixed performance. Mean-reversion is a liquidity-providing strategy as it takes the opposite positions of short-term stock trends. The strategy is likely to be more profitable when investors make mistakes in terms of buying or selling too aggressively, which tends to happen more frequently when volatility is high. The last few years were characterised by record low levels of volatility, which explains the poor performance since 2012. The larger number of quantitative investment firms, many who specialise in this type of strategy, further erode mean-reversion profits.
Source: FactorResearch
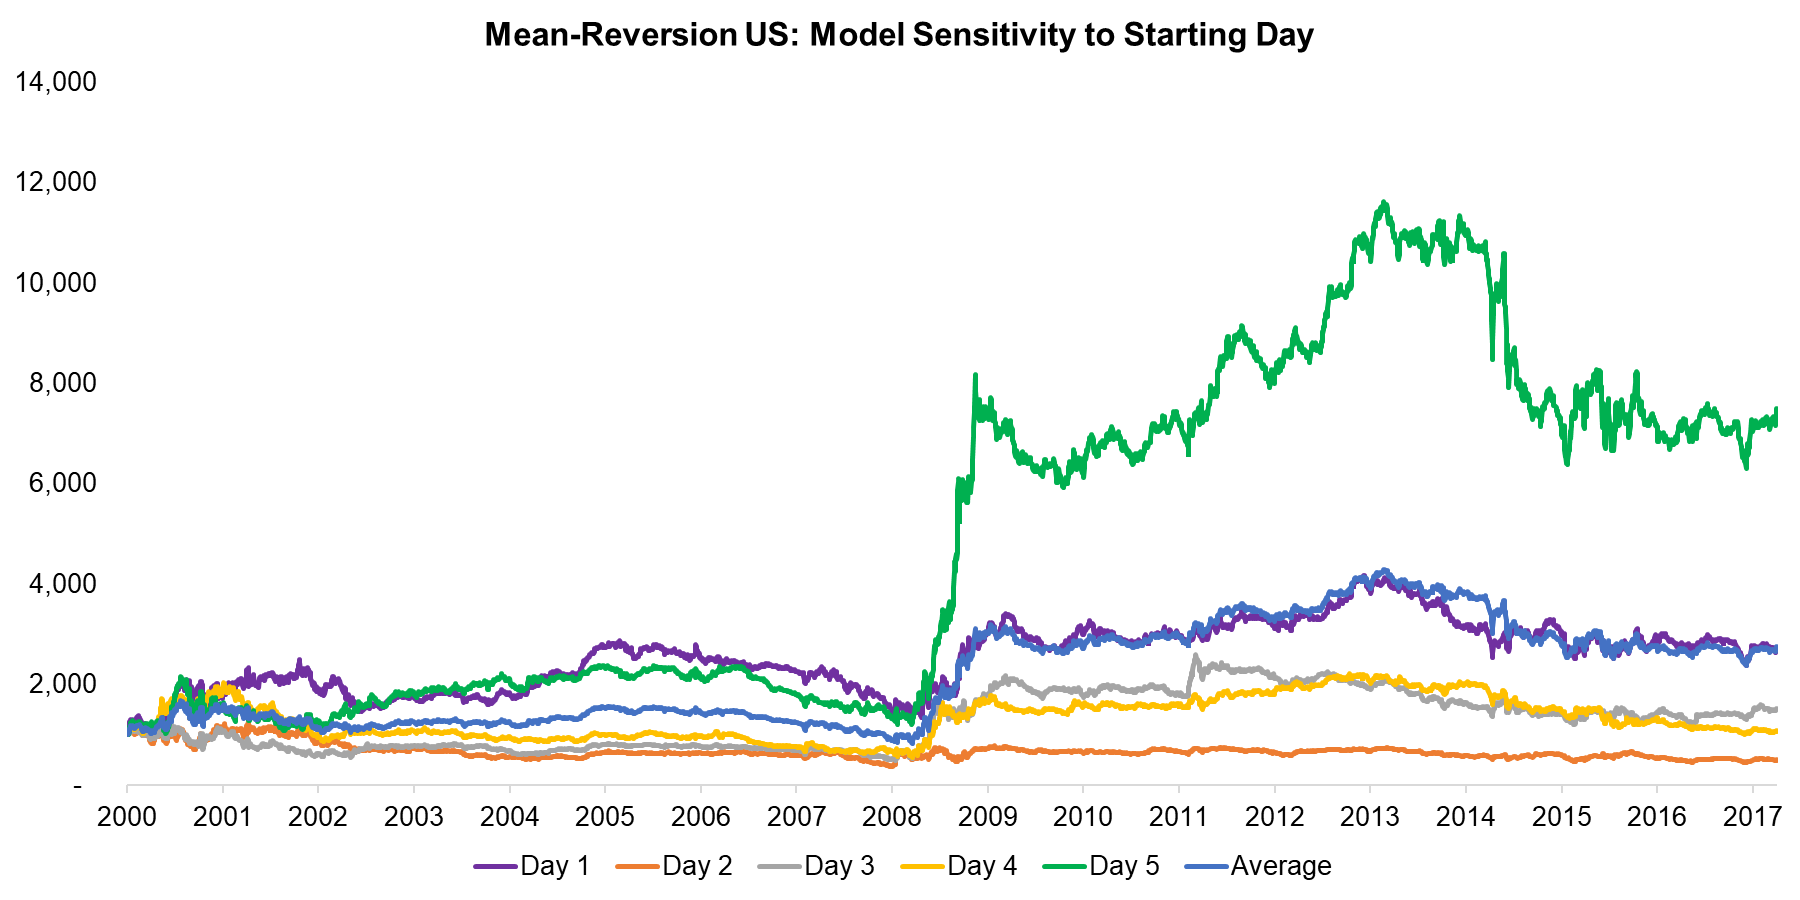
Compared to classic factor strategies like Value or Quality the mean-reversion strategy is more sensitive to model assumptions (read Quality Factor: How To Define It?). One interesting detail is the starting point of the portfolio. Each day the winners and losers of last week are measured and a portfolio is created, which means there is one new portfolio per day. The daily portfolios need to be aggregated into a combined portfolio, which means at any time 5 portfolios will be held. The chart below highlights that although the trend is the same, the performance of the daily portfolios are dramatically different.
Source: FactorResearch
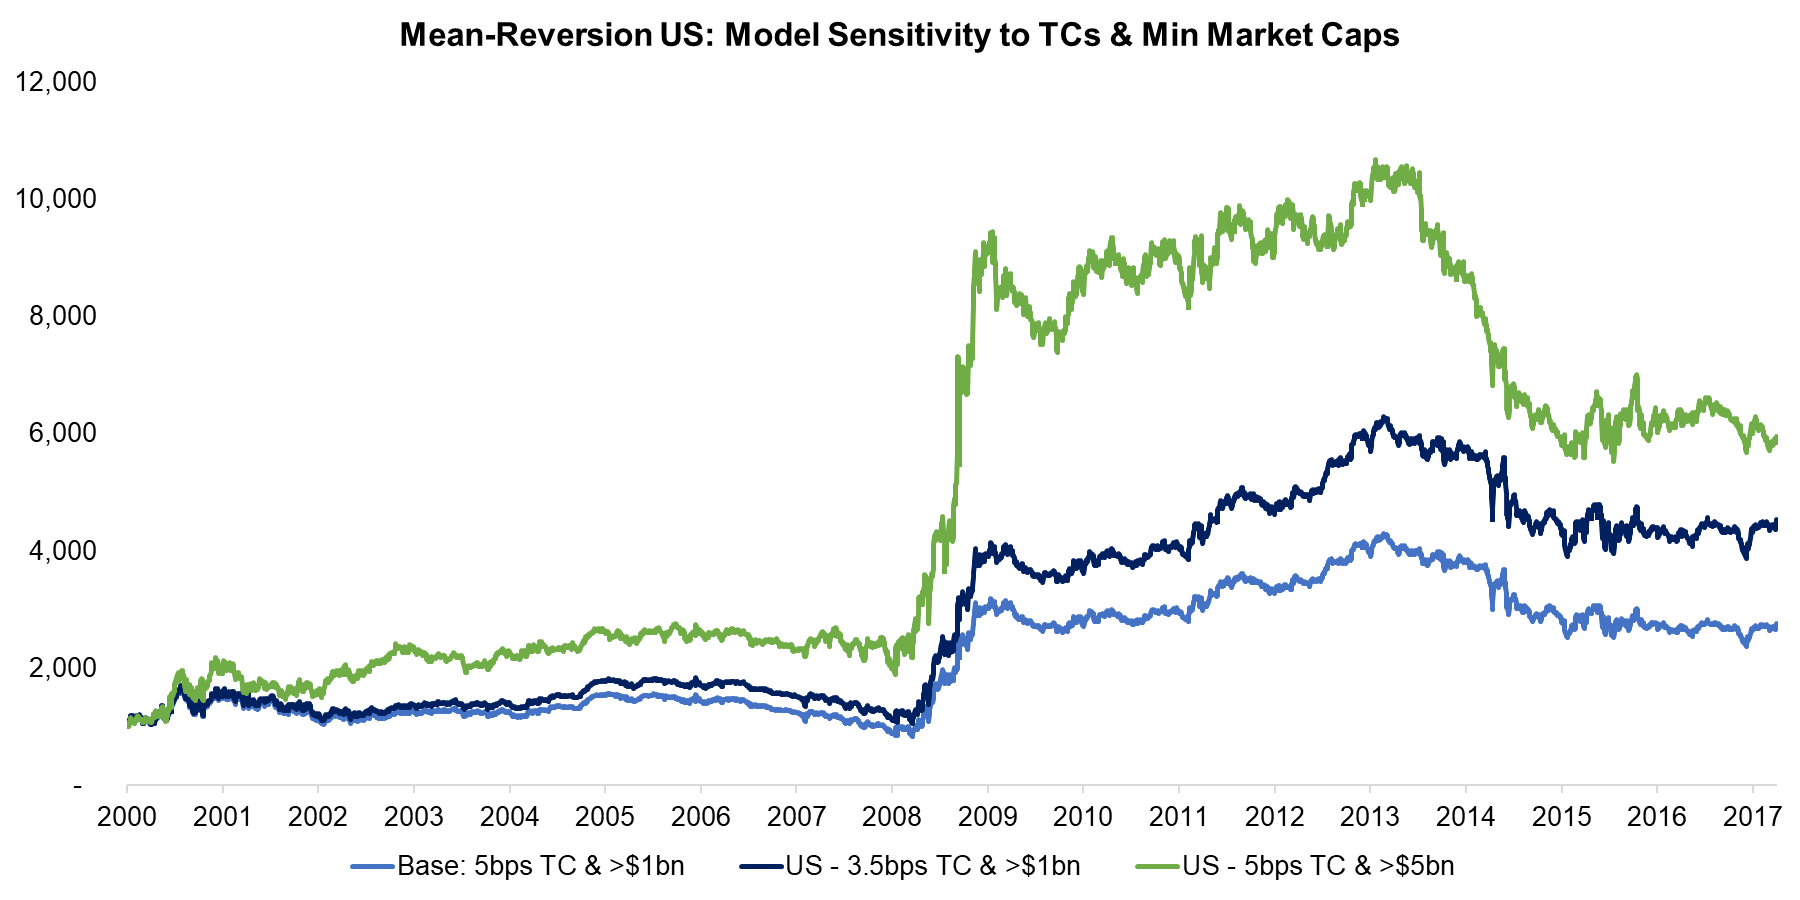
In addition to the complex portfolio creation process the assumptions for transaction costs and the available universe also have a significant impact. We have used 5bps per transaction, which might seem excessive given that large institutional investors can trade below 1bps, however, the impact cost on stock level is often ignored and can be large for small and mid-cap stocks. The chart below shows how the strategy improves by reducing the transaction costs from 5bps to 3.5bps. We can also see that the performance improves if we move the minimum market capitalisation from $1bn to $5bn, although the improvement does not hold for non-US markets, i.e. is likely random.
Source: FactorResearch
MEAN-REVERSION (LONG / SHORT) VS S&P 500
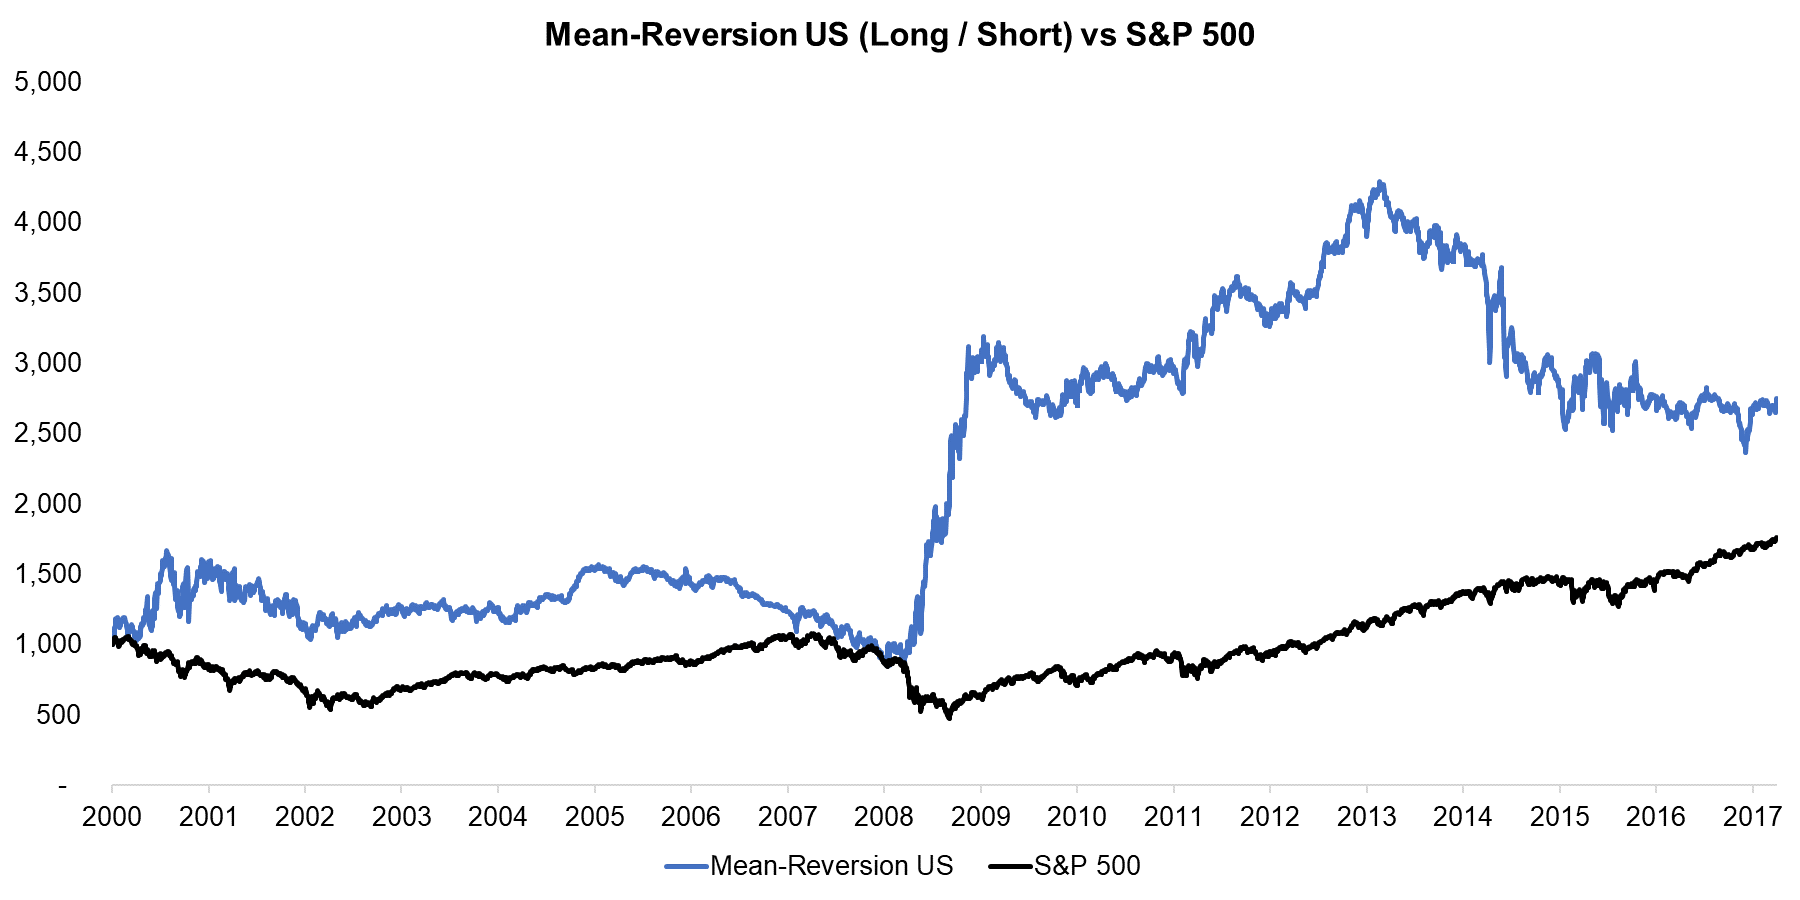
Given that mean-reversion is the inverse of short-term Momentum it’s interesting to analyse how the strategy performed compared to equity markets (read Momentum Factor: Intra vs Cross-Sector). The chart below shows the performance versus the S&P 500 since 2000 and we can observe that in periods of market decline, e.g. the Tech bubble implosion around the 2000s or the Global Financial Crisis in 2008 & 2009, mean-reversion did well. Naturally this is intuitive, given that at those times volatility was high and investors were more likely to overreact, allowing mean-reversion trades to be profitable.
Source: FactorResearch
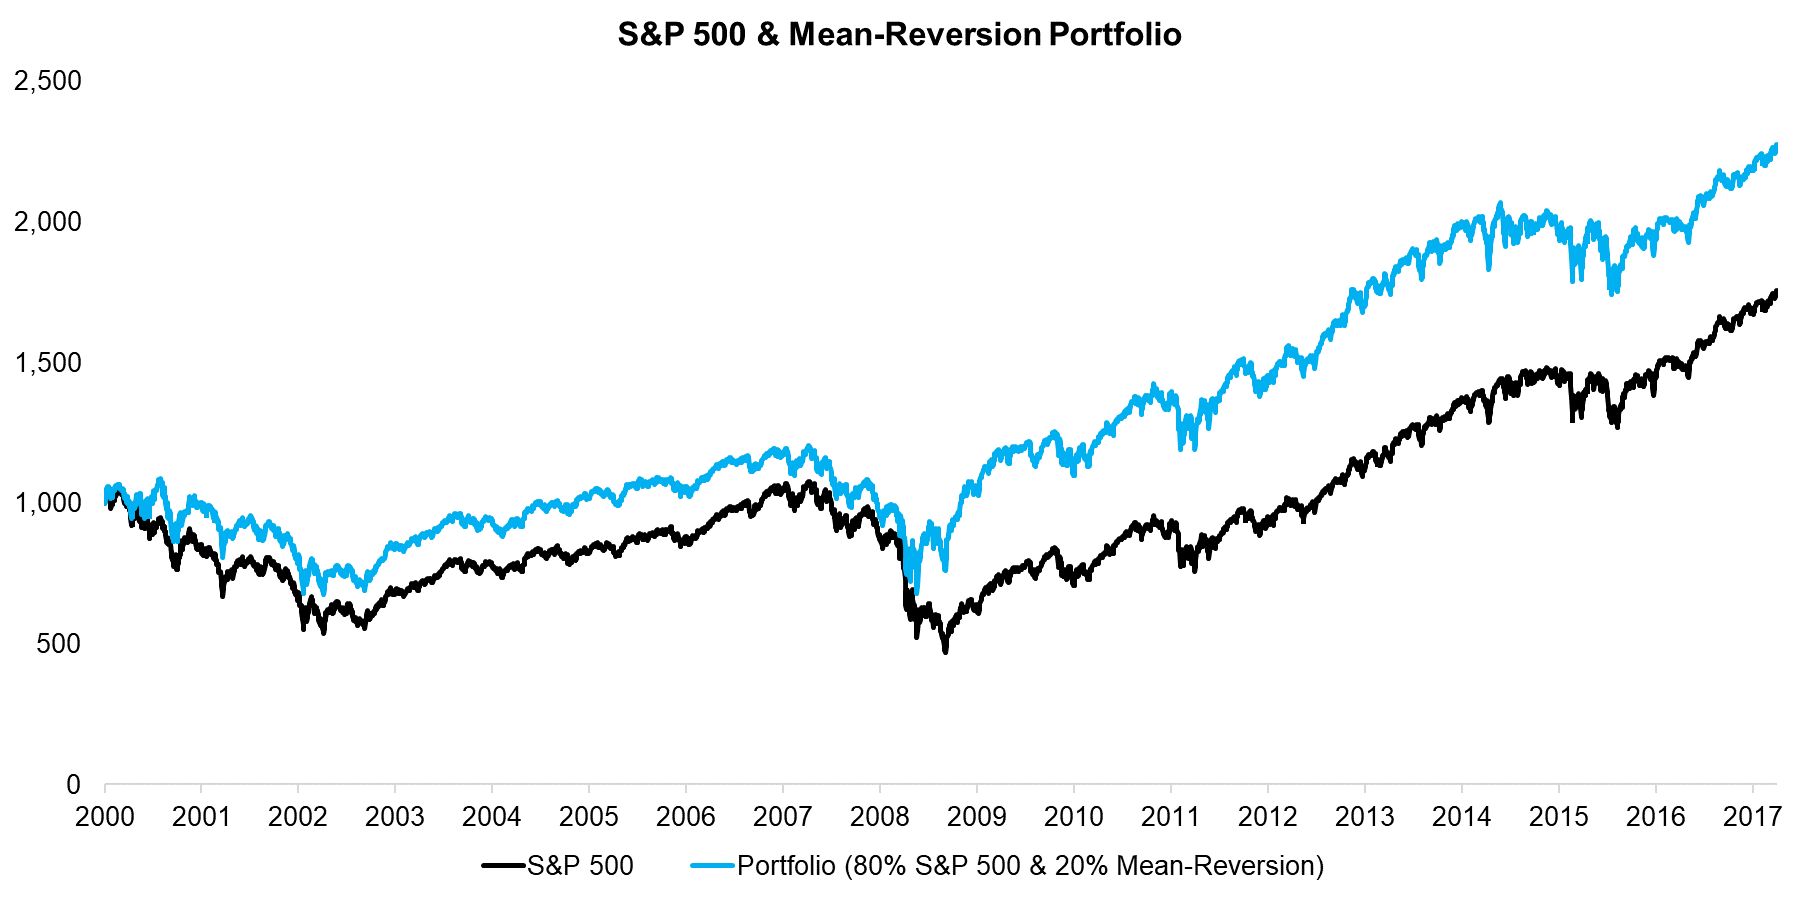
Given the natural hedging tendency of the mean-reversion strategy it might be interesting to add the strategy to an equity-centric portfolio. The chart below highlights that adding 20% mean-reversion to a portfolio comprised of the S&P 500 would have improved the performance significantly since 2000.
Source: FactorResearch
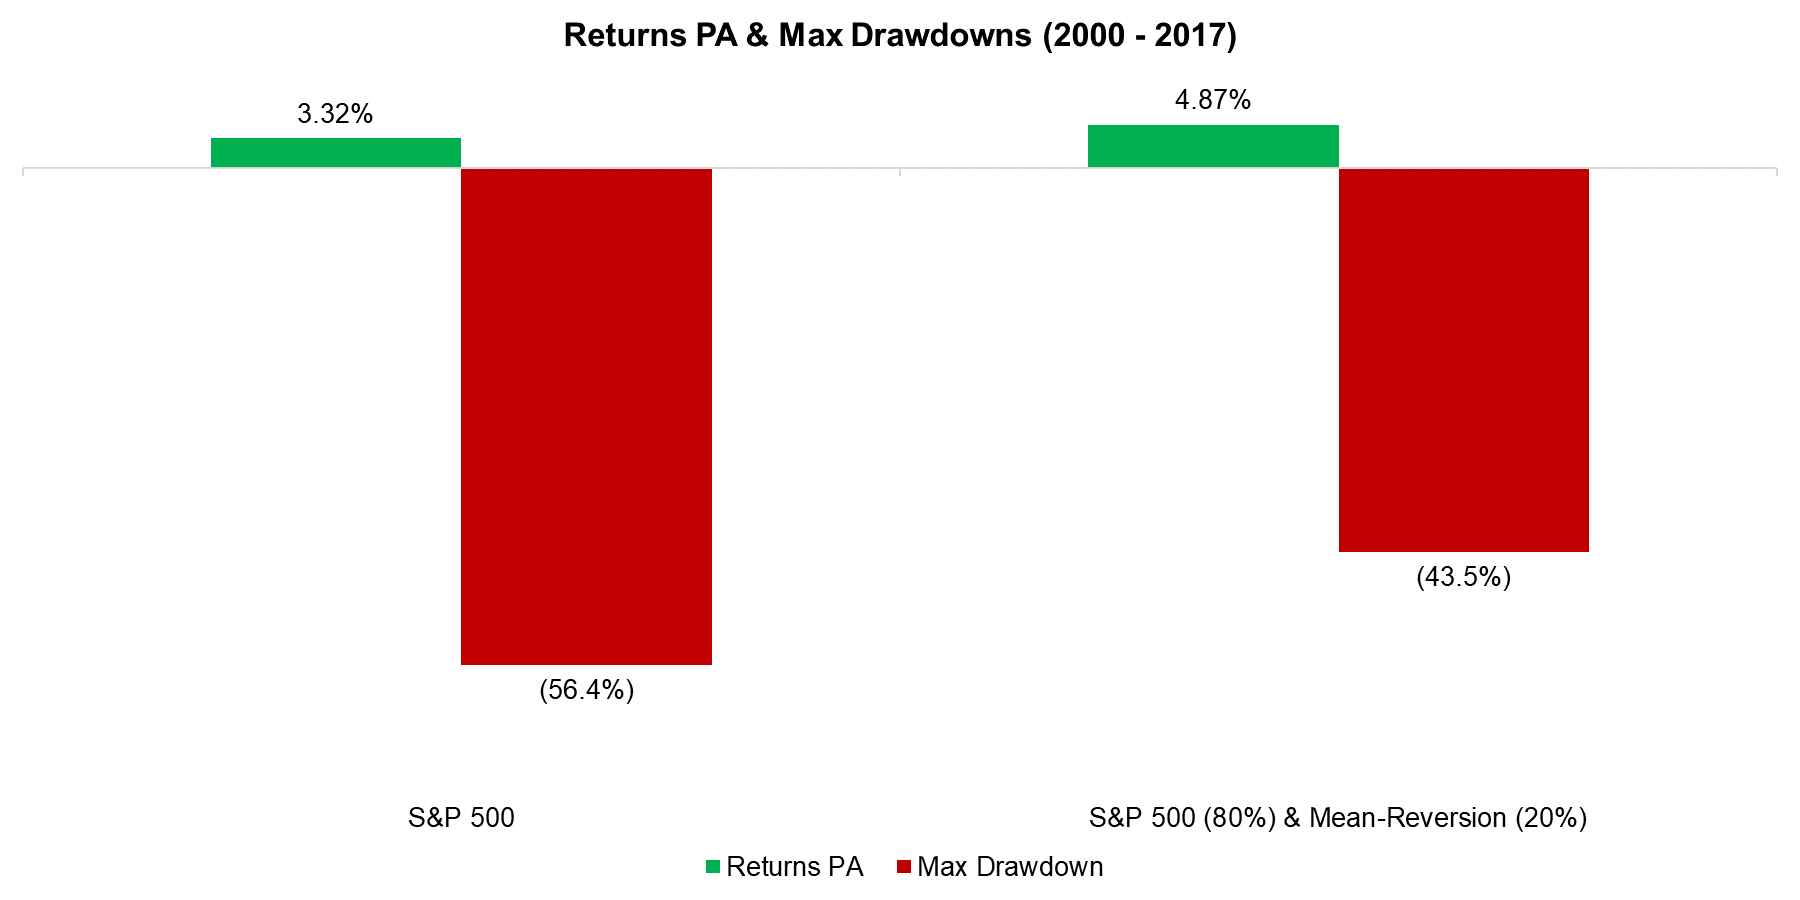
The return per annum of the combination portfolio is higher than for the S&P 500 on a stand-alone basis and the max drawdown would have decreased meaningfully. Mean-reversion exhibits a positive skew and is effectively long volatility, therefore highly attractive for an equity-centric portfolio. The difficulty is executing the strategy as there can be many years of flat performance, which is challenging for the investor.
Source: FactorResearch
FURTHER THOUGHTS
This short research note highlights the performance of a short-term mean-reversion strategy in the US stock market, which few managers do systematically, but most institutional and retail investors do implicitly by buying or selling stocks that seem to have overreacted. Based on the results this behaviour might only be recommended when volatility is high, however, which is when executing the strategy also requires most confidence as it requires taking the opposite position of the market.
ABOUT THE AUTHOR
Nicolas Rabener is the CEO & Founder of Finominal, which empowers professional investors with data, technology, and research insights to improve their investment outcomes. Previously he created Jackdaw Capital, an award-winning quantitative hedge fund. Before that Nicolas worked at GIC and Citigroup in London and New York. Nicolas holds a Master of Finance from HHL Leipzig Graduate School of Management, is a CAIA charter holder, and enjoys endurance sports (Ironman & 100km Ultramarathon).
Connect with me on LinkedIn or X.

