Defining Tactical Asset Allocation
What is a tactical asset allocation strategy?
August 2022. Reading Time: 10 Minutes. Author: Nicolas Rabener.
SUMMARY
- Tactical asset allocation ETFs charge high fees (0.92% pa) that need to be justified
- The active share of TAA strategies can be measured via regression analysis
- High active share does not automatically create value, but offers value-creation potential
INTRODUCTION
The life of equity fund managers is getting increasingly difficult. Many active managers had realized decades ago that creating outperformance is hard, so changed their strategy to essentially provide index-like performance. There is significantly less career risk for a fund manager if the performance is more or less like the benchmark. A generation of index-huggers was thus borne.
However, benchmarks became investible with the rise of ETFs, and offering benchmark-like products with higher fees became less acceptable. Capital allocators started calculating the active share of mutual funds and challenging the fund managers with low ones. Be active, or be gone, is the new motto.
Evaluating fund managers focused on stock markets is relatively easy given obvious benchmarks like the S&P 500. Ideally, the fund managers consistently outperform their benchmark. However, evaluating tactical asset allocation ETFs is more challenging as there are no clearly defined benchmarks. Furthermore, the lines between strategic and tactical asset allocation often blur. There is little justification for charging high fees for strategic asset allocation as investors can replicate this efficiently themselves.
In this research note, we will evaluate a framework for identifying tactical asset allocation (“TAA”) strategies.
EVALUATING TACTICAL ASSET ALLOCATION STRATEGIES
TAA strategies invest across asset classes dynamically. Many focus just on equities and bonds, while others also include REITs, currencies, and commodities. A managed futures strategy, also called a CTA, that goes long or short hundreds of asset classes, is the ultimate version.
We focus on TAA strategies that are available via ETFs traded in the U.S. stock market and that have a track record of at least three years. The resulting universe includes 15 ETFs that manage slightly more than $1 billion of assets and charge an average management fee of 0.92% per annum, compared to almost 0% for an S&P 500 ETF.
We will use a portfolio comprised of the S&P 500 and U.S. investment-grade bonds (60/40 portfolio) as the benchmark portfolio and measure how much the TAA managers deviate from this portfolio. If they are more active as measured by betas derived from a regression analysis, then the high management fees might be justified as they at least have the potential to create value.
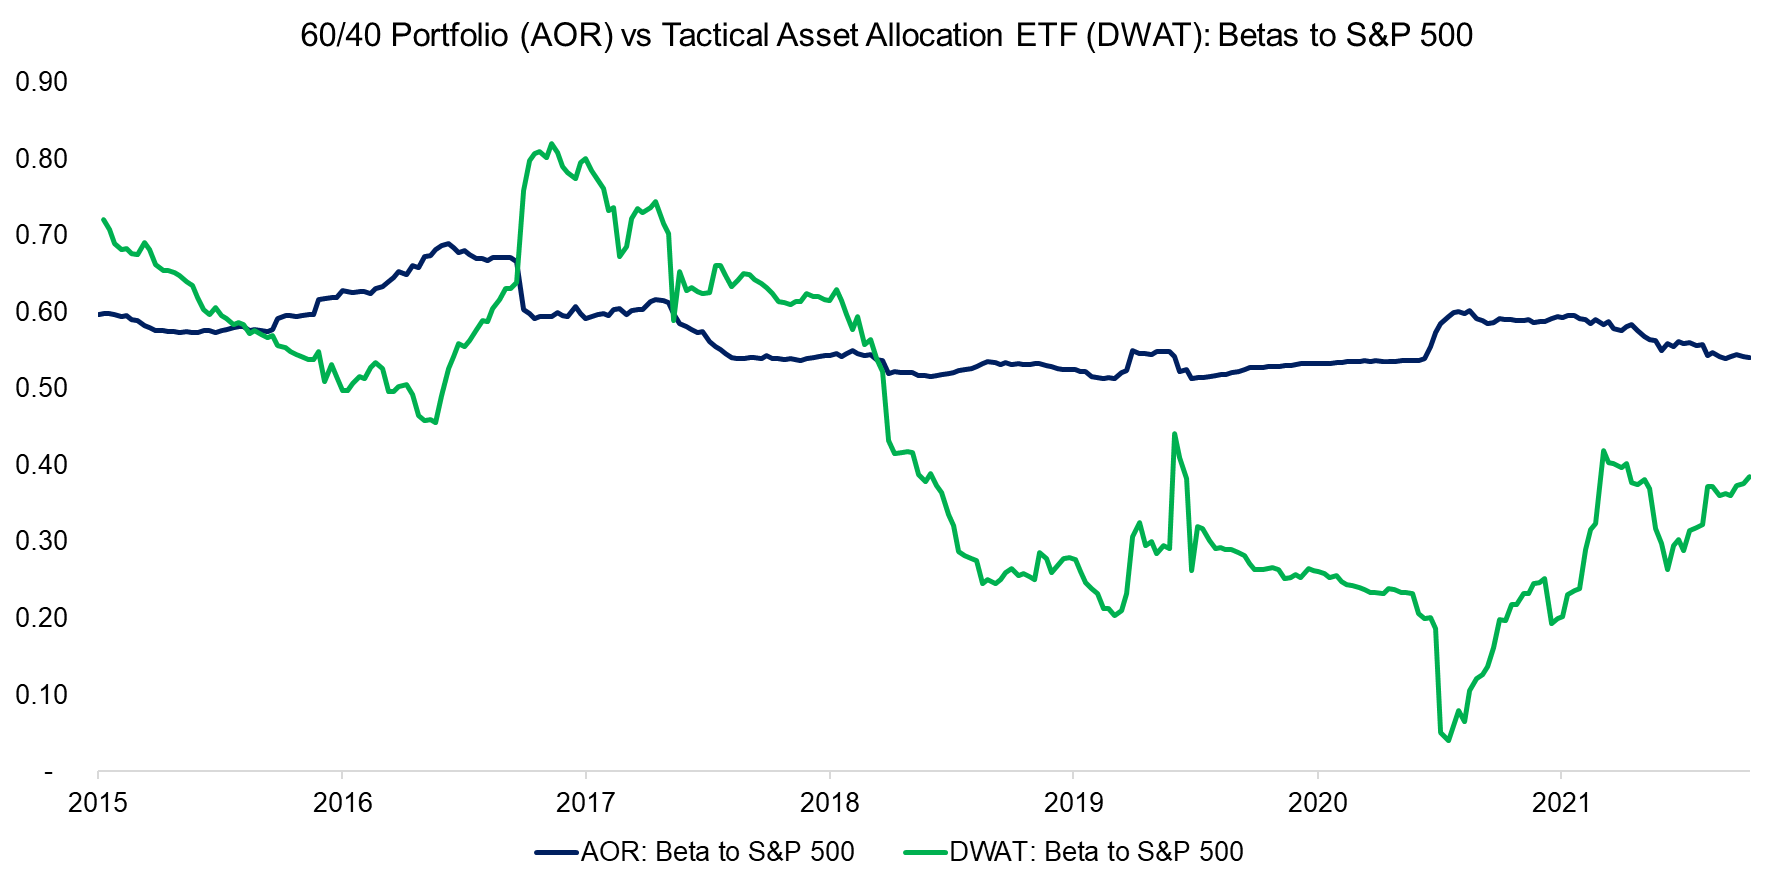
For example, we can contrast the betas of the iShares Core Growth Allocation ETF (AOR), which is a proxy for a 60/40 portfolio, and the Arrow DWA Tactical ETF (DWAT) to the S&P 500 in the period between 2015 and 2022. The analysis highlights that AOR’s beta to the U.S. stock market was almost consistently between 0.5 and 0.6, compared to a significantly wider range between 0.1 and 0.7 for DWAT.
Naturally, this highlights that DWAT is indeed allocating tactically and had low equity exposure when stock markets were deemed unfavorable by its managers. Its equity beta has been falling consistently, which is likely explained by the ETF not only having exposure to not just U.S. stocks, but also to emerging and international markets (read Tactical ETFs: Tactfully No, Thank You?).
Source: FactorResearch
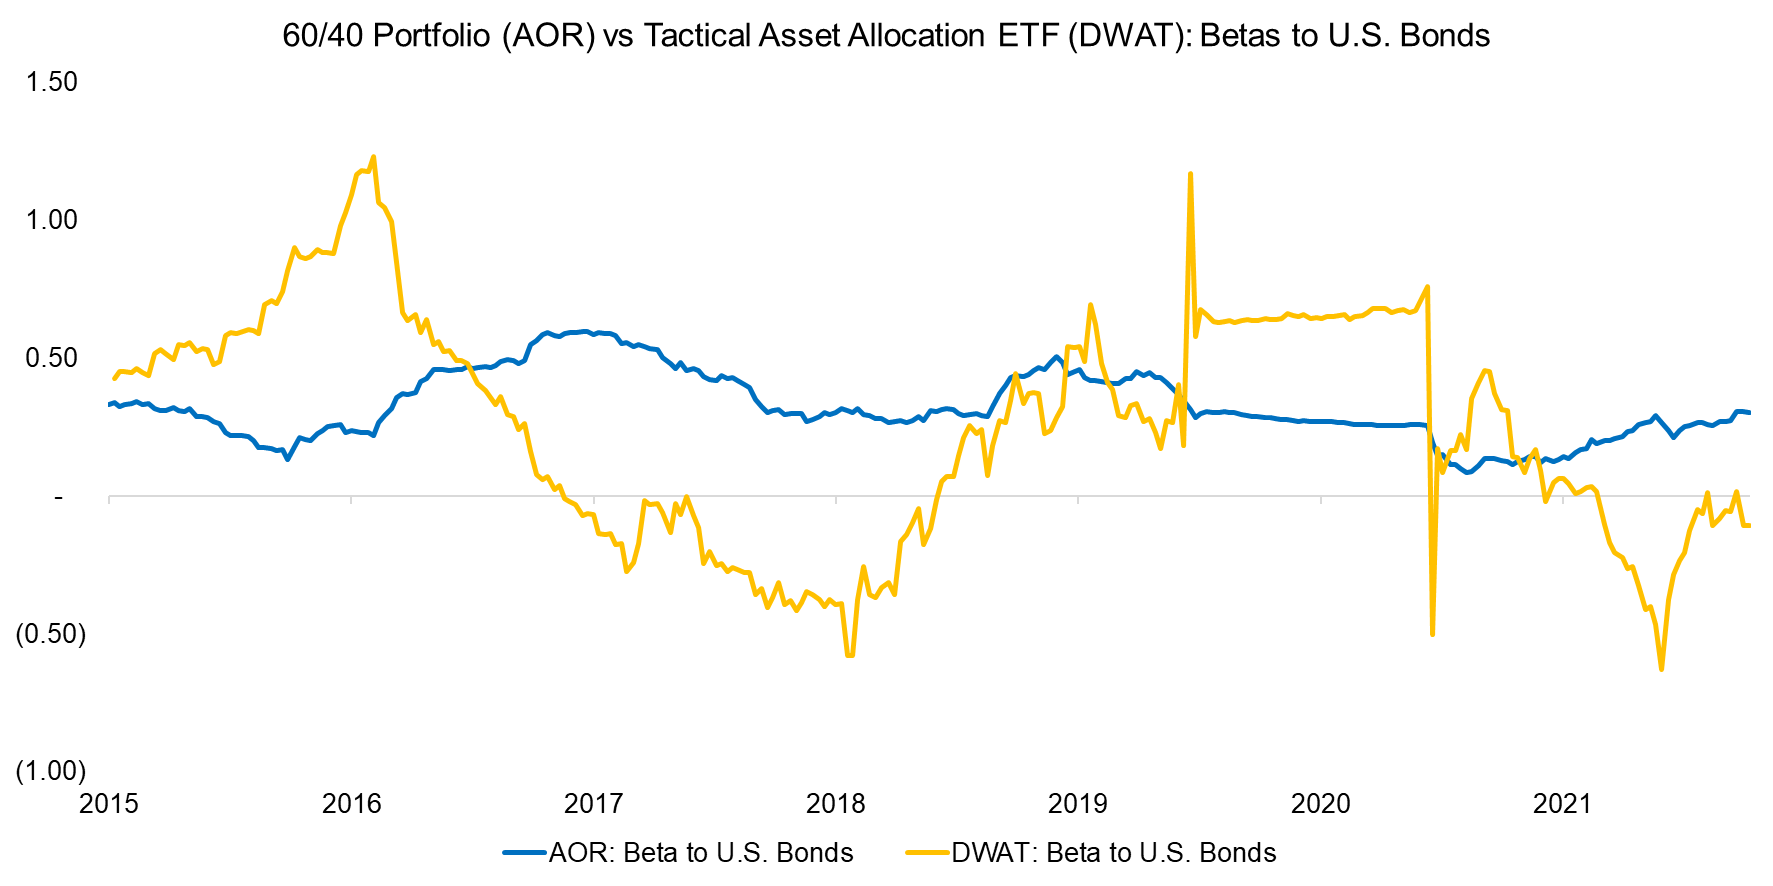
We observe similar differences in betas to U.S. investment grade bonds for AOR and DWAT. The former had an almost consistent exposure of approximately 0.4, compared to a range between -0.6 and 1.3 for the latter. DWAT can short asset classes via inverse ETFs and uses relative strength signals for investment decisions, so can be viewed as a simplified version of a managed futures strategy.
Source: FactorResearch
MEASURING THE ACTIVE SHARE OF TAA ETFs
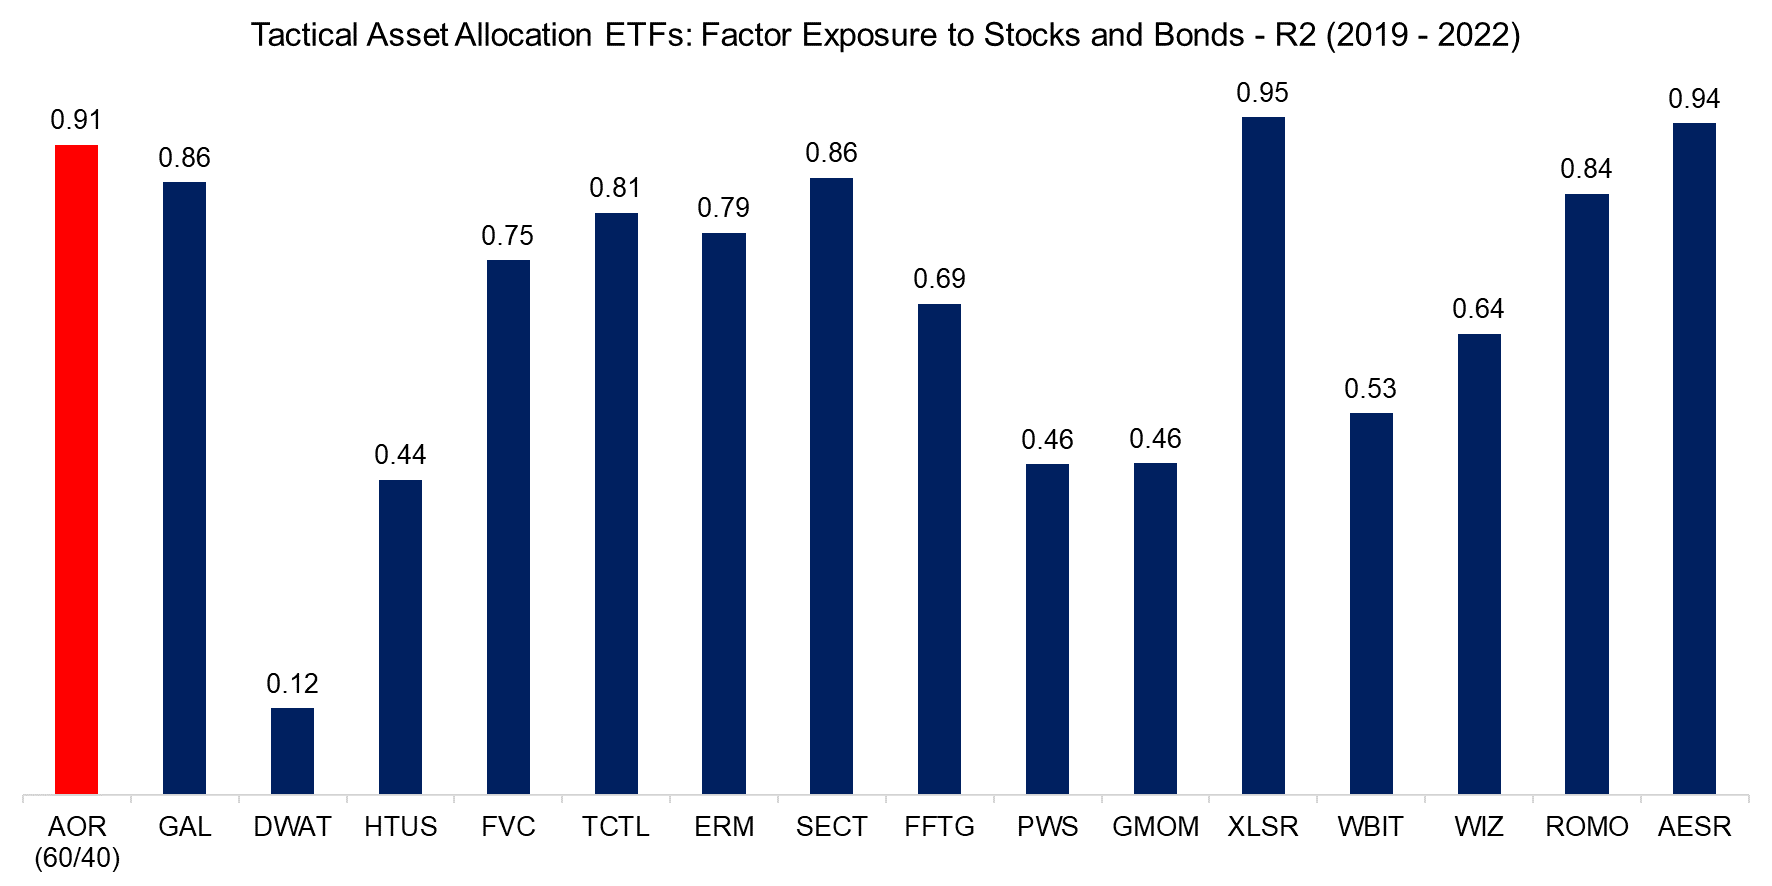
First, we run a factor exposure analysis for all 15 TAA ETFs using only two independent variables, namely the S&P 500 and U.S. investment grade bonds. We use daily data from the period between 2019 and 2022 as that includes a bull market as well as a stock market crash (read Factor Exposure Analysis 101: Linear vs Lasso Regression).
The R2 for the regression analysis ranges dramatically across the ETFs. Strategies with low values can be considered more attractive given that we were not able to well explain their returns with U.S. stocks and bonds. In contrast, some ETFs had an R2 close to or above that of a 60/40 portfolio, which was 0.94. There is a risk that these ETFs do not provide much value compared to a 60/40 portfolio and allocate strategically rather than tactically, but still charge high fees.
Source: FactorResearch
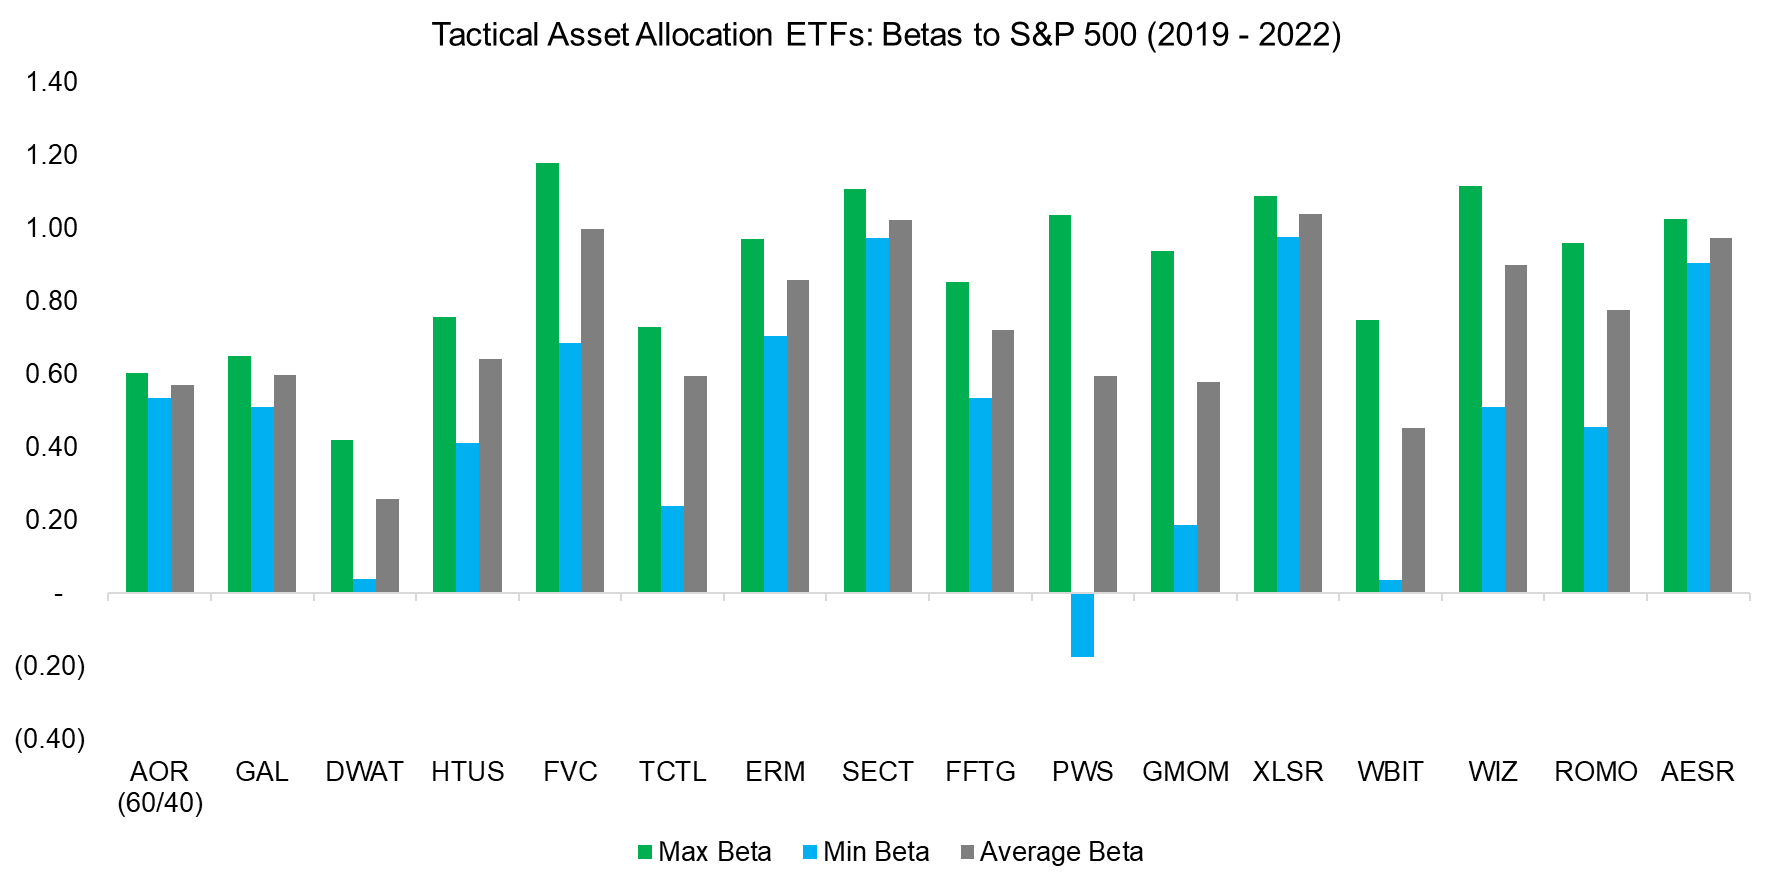
Next, we measure the maximum, minimum, and average betas of the 15 ETFs to the S&P 500. We observe that some had betas above one that may be explained by using leveraged ETFs.
Only a few of these had negative or low equity betas, which is somewhat surprising given that many of these ETFs are marketed as strategies that dynamically allocate from equities to bonds when stocks become less favorable. Naturally, this was the case during the COVID-19 crisis in March 2020 when stock markets crashed, so the betas to equities should have been close to zero.
Furthermore, the analysis highlights that some of these had consistently high equity betas, which indicates that they should be viewed as strategic rather than tactical asset allocation strategies, eg SPDR SSgA Global Allocation ETF (GAL).
Source: FactorResearch
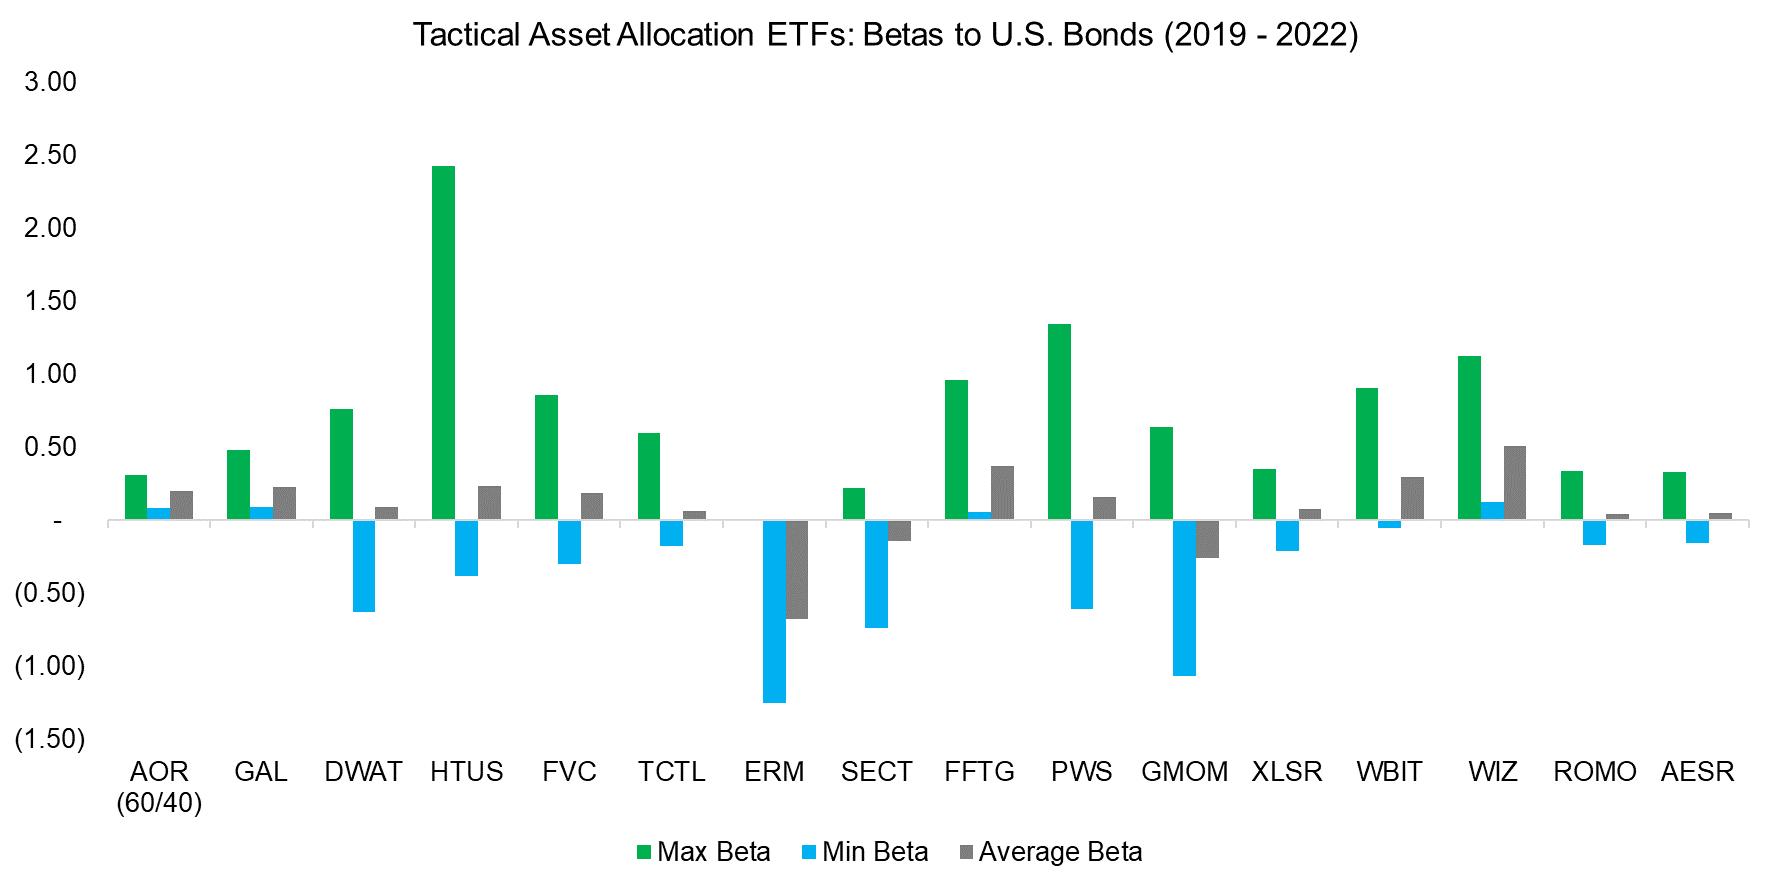
The betas to U.S investment grade bonds range dramatically with some ETFs having had large positive and negative betas over the last five years. Only a few of these will be short bonds via inverse ETFs, but equities and bonds were sometimes strongly negatively correlated, so 100% equity exposure occasionally resulted in negative exposure to fixed income.
Source: FactorResearch
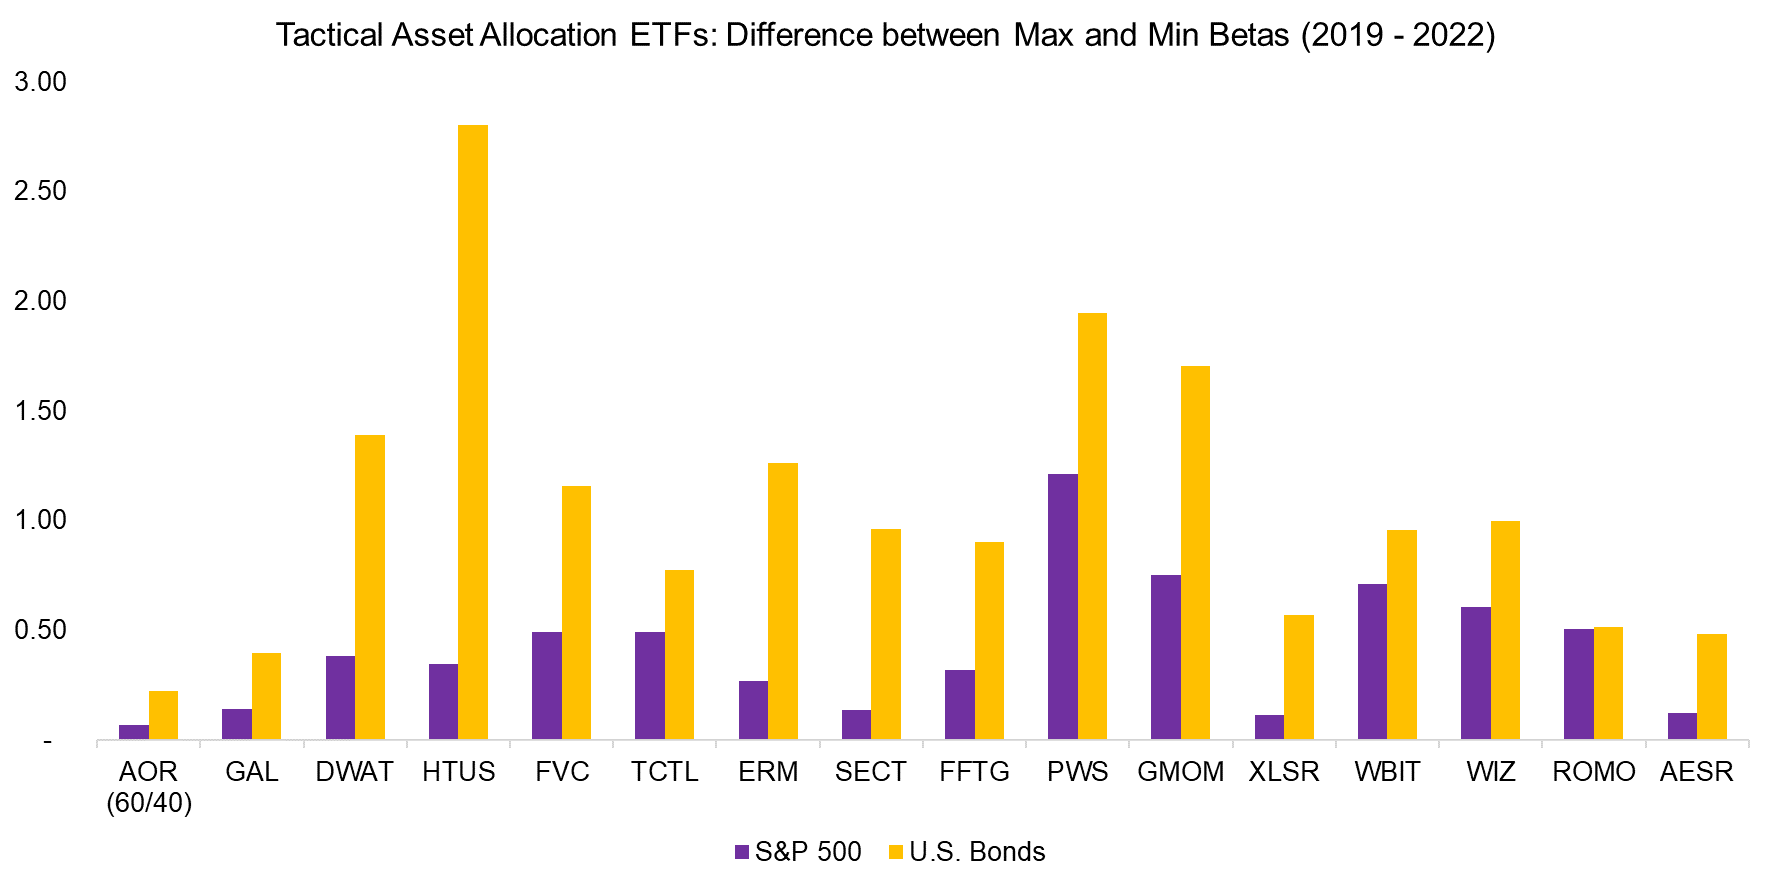
Finally, we calculate the difference between the maximum and minimum betas to stocks and bonds. Theoretically, this can be used to define what constitutes a TAA strategy. If the difference was lower than that of the 60/40 portfolio, then the ETF is not active enough and should be considered a strategic rather than a tactical asset allocation product.
Applying this framework to the 15 ETFs highlights that all except perhaps GAL can be considered TAA strategies. The larger the difference between maximum and minimum betas, the more tactical the ETF.
Source: FactorResearch
FURTHER THOUGHTS
Capital allocators can use the simple framework we introduced in this research note to differentiate between tactical and strategic asset allocation strategies. If the active share is too low and it seems more a strategic framework, then fees should be scrutinized.
However, although highly tactical strategies have a higher potential to create value for investors, they can also create more damage. There is a large amount of empirical evidence for applying trend following across asset classes, but also plenty of research that indicates market timing does not work. Determining what approach is being employed is often a science of its own.
RELATED RESEARCH
Risk-Managed Equity Exposure II
Risk-Managed Equity Exposure
Market Timing vs Risk Management
Market Timing with Multiples, Momentum, and Volatility
ABOUT THE AUTHOR
Nicolas Rabener is the CEO & Founder of Finominal, which empowers professional investors with data, technology, and research insights to improve their investment outcomes. Previously he created Jackdaw Capital, an award-winning quantitative hedge fund. Before that Nicolas worked at GIC and Citigroup in London and New York. Nicolas holds a Master of Finance from HHL Leipzig Graduate School of Management, is a CAIA charter holder, and enjoys endurance sports (Ironman & 100km Ultramarathon).
Connect with me on LinkedIn or X.

