Does Financial Leverage Make Stocks Riskier?
Or asked differently, can companies boost returns via leverage?
September 2020. Reading Time: 10 Minutes. Author: Nicolas Rabener.
SUMMARY
- The leverage of US stocks has been increasing over the last four decades
- The most leveraged stocks did not generate higher returns than the least leverages ones
- However, they were also not riskier
INTRODUCTION
The IMF issued a warning on corporate debt in their latest Global Stability Report and highlighted the following concerns:
- The estimated share of speculative-grade debt in the corporate sector is nearly 50% in the US as well as China and even higher in Italy, Spain, and the UK
- The share of debt-at-risk, which represents companies where the interest costs are higher than EBITDA, aka Zombie firms, is above 25% in the US and the UK
The institution also provides an adverse economic scenario that assumes half of the GDP decline of the global financial crisis of 2009, which results in the debt-at-risk rising to $19 trillion, or 40% of the total corporate debt for the eight largest countries. It would be a Zombie apocalypse.
Unfortunately, this report was issued in October 2019 and the world has seen a much more dramatic decline in GDP in 2020 due to the COVID-19 crisis, compared to the IMF’s adverse scenario. For example, the UK’s economy contracted a mere 4.2% in 2009, but is expected to decline by 8.3% in 2020, according to a forecast from the European Commission.
Investors concerned with the outlook for the economy and the stock market may intuitively seek stocks that feature low leverage and hope for these to outperform in such an environment. However, investing is rarely straight forward and frequently almost illogical. For example, more volatile stocks do not generate higher returns than less volatile stocks, at least not a risk-adjusted basis, which is called the Low Volatility anomaly.
Perhaps financial leverage is not as risky as commonly assumed, which we will explore in this research note.
FINANCIAL LEVERAGE IN THE US
Looking back over the last few decades highlights that non-financial corporate debt as a percentage of GDP has been rising consistently in most countries. For example, the ratio was a mere 22% in the US in 1951, compared to 49% today. The increase can be simply explained by companies having increased their leverage or the corporate sector playing a large role in modern economies (read Corporate Debt in the Chinese Stock Market).
However, since the global financial crisis, corporates in some countries have become more conservative than in others. The UK has seen corporate debt as a percentage of GDP decrease from 102% in 2008 to 85% in 2018 and the ratio is largely unchanged in the US, Germany, and Japan, as per IMF data. In contrast, the ratio increased by 33% to 118% in Canada, by 25% to 141% in France, and 66% to 154% in China. The latter is not only a staggering increase, but also a high absolute level for an emerging economy.
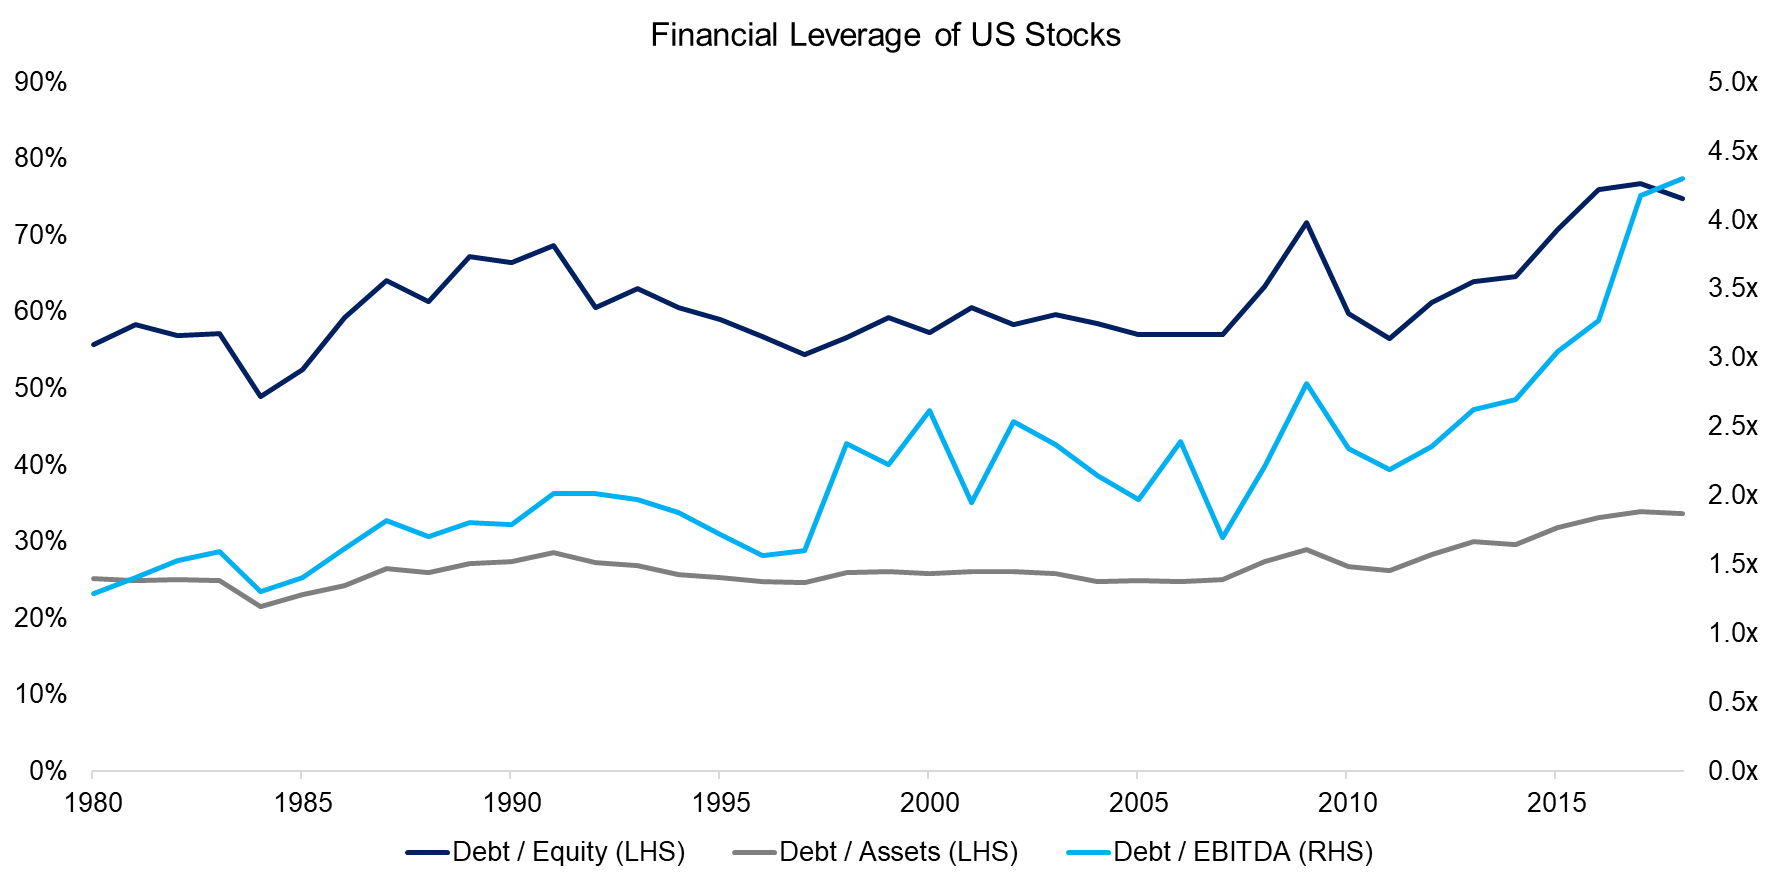
In this analysis, we are focusing on all companies listed in the US stock market in the period between 1980 and 2018 and measure their financial leverage by three metrics: debt-over-equity, debt-over-assets, and debt-over-EBITDA. Specifically, we focus on the 10% most and least leveraged stocks. We observe that listed US companies increased their leverage over the last few decades, regardless of which metric is chosen. If high leverage is regarded as high risk, then US stocks have certainly become riskier.
Source: FactorResearch
ARE MORE LEVERAGED STOCKS RISKIER?
Intuitively, a company that is highly leveraged should be riskier than one that has less debt. In a booming economy, debt does not matter much as corporate revenues increase faster than interest costs. However, if an economy is entering a recession, then revenues decline accordingly, but interest costs largely remain the same. Naturally, central banks try to stimulate economies by lowering interest rates in such a scenario, but debt can not be refinanced at lower rates immediately. Given this, earnings turn negative, and the risk of corporate bankruptcy increases (read Factors & Interest Rates).
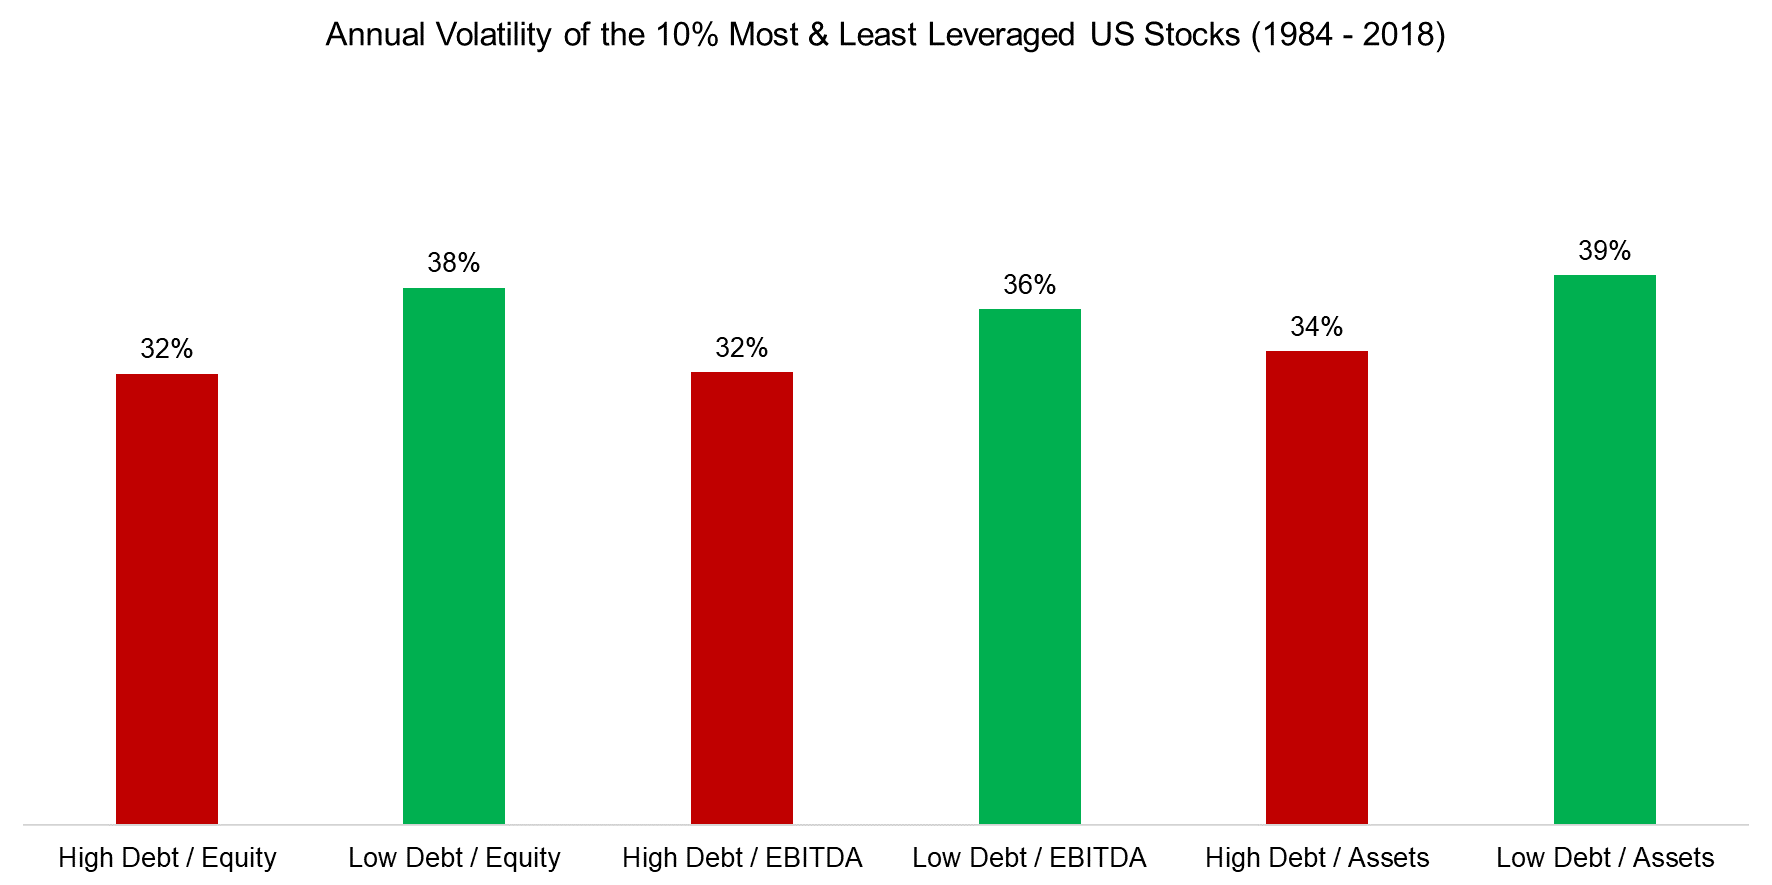
There are many ways of measuring the risk of stocks, but we will simply use the 12-month stock price volatility as the yardstick. Somewhat surprisingly, the average volatility was higher for the least leveraged stocks across all three metrics during the period between 1984 and 2018. It was not a large difference, but certainly counterintuitive.
Source: FactorResearch
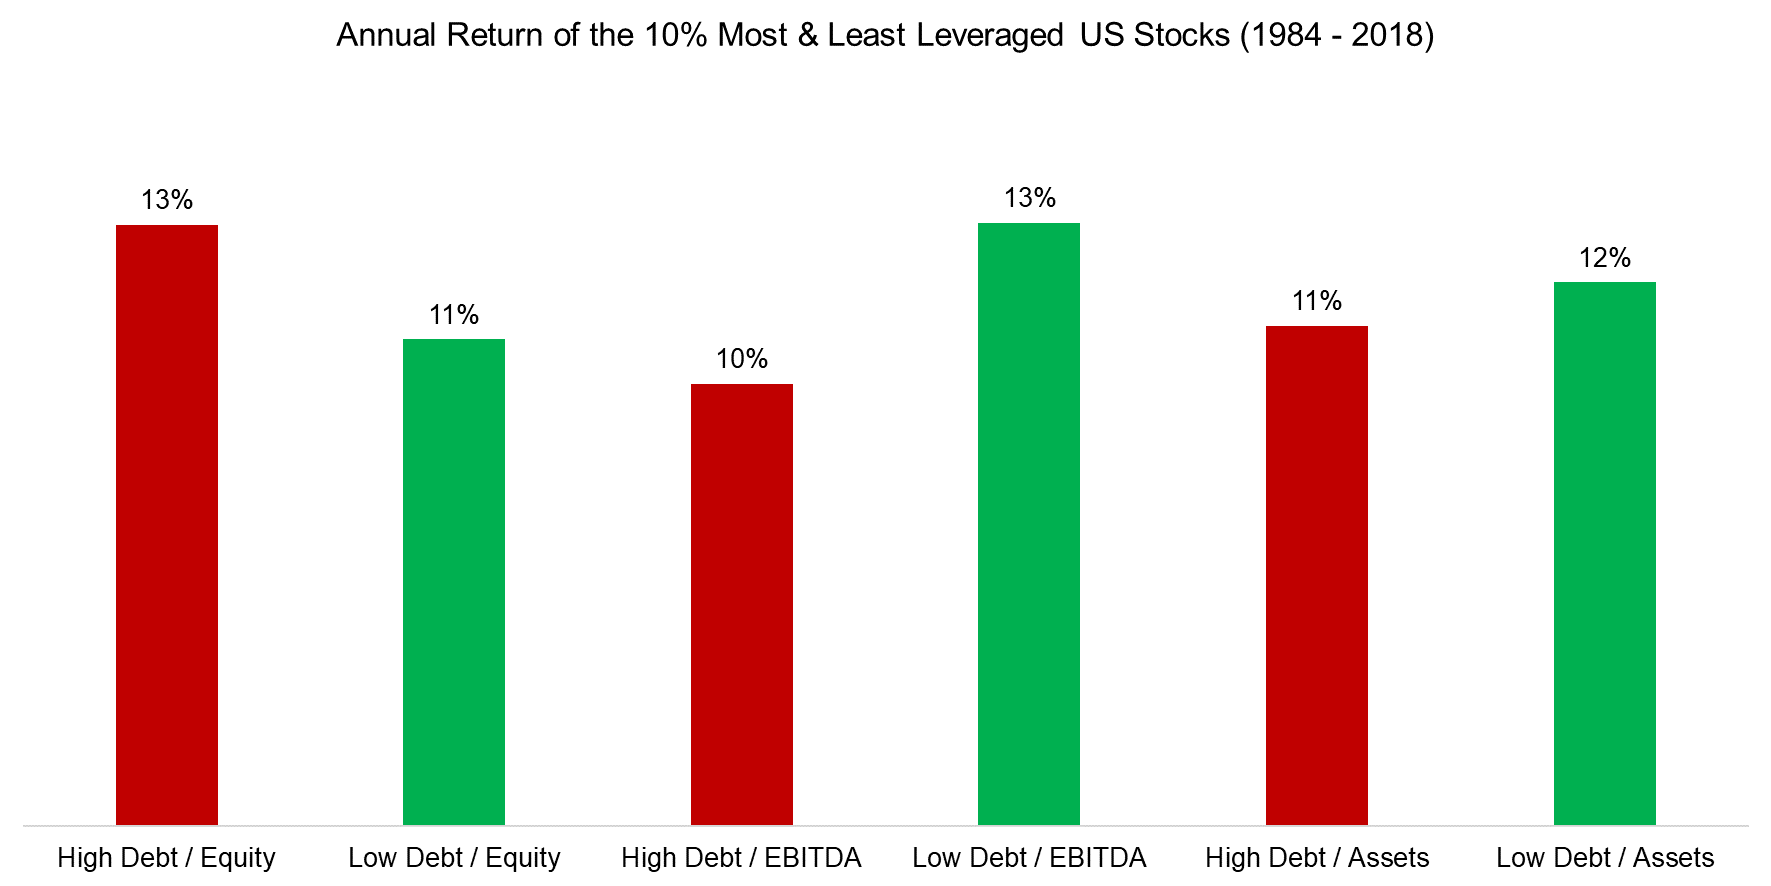
Given this somewhat unusual relationship between financial leverage and risk as measured by volatility, investors might question a similar common assumption: the most leveraged stocks should outperform the least leveraged ones. It is worth recalling that entire asset classes like private equity and real estate have the core thesis that leverage makes returns more attractive.
The data highlights a different picture: the least leveraged stocks in the US outperformed the most leveraged stocks on average over an almost four-decade period. Stated differently and leaning on Modigliani Miller: there is no magic in leverage.
Source: FactorResearch
FINANCIAL LEVERAGE & RISK-ADJUSTED RETURNS
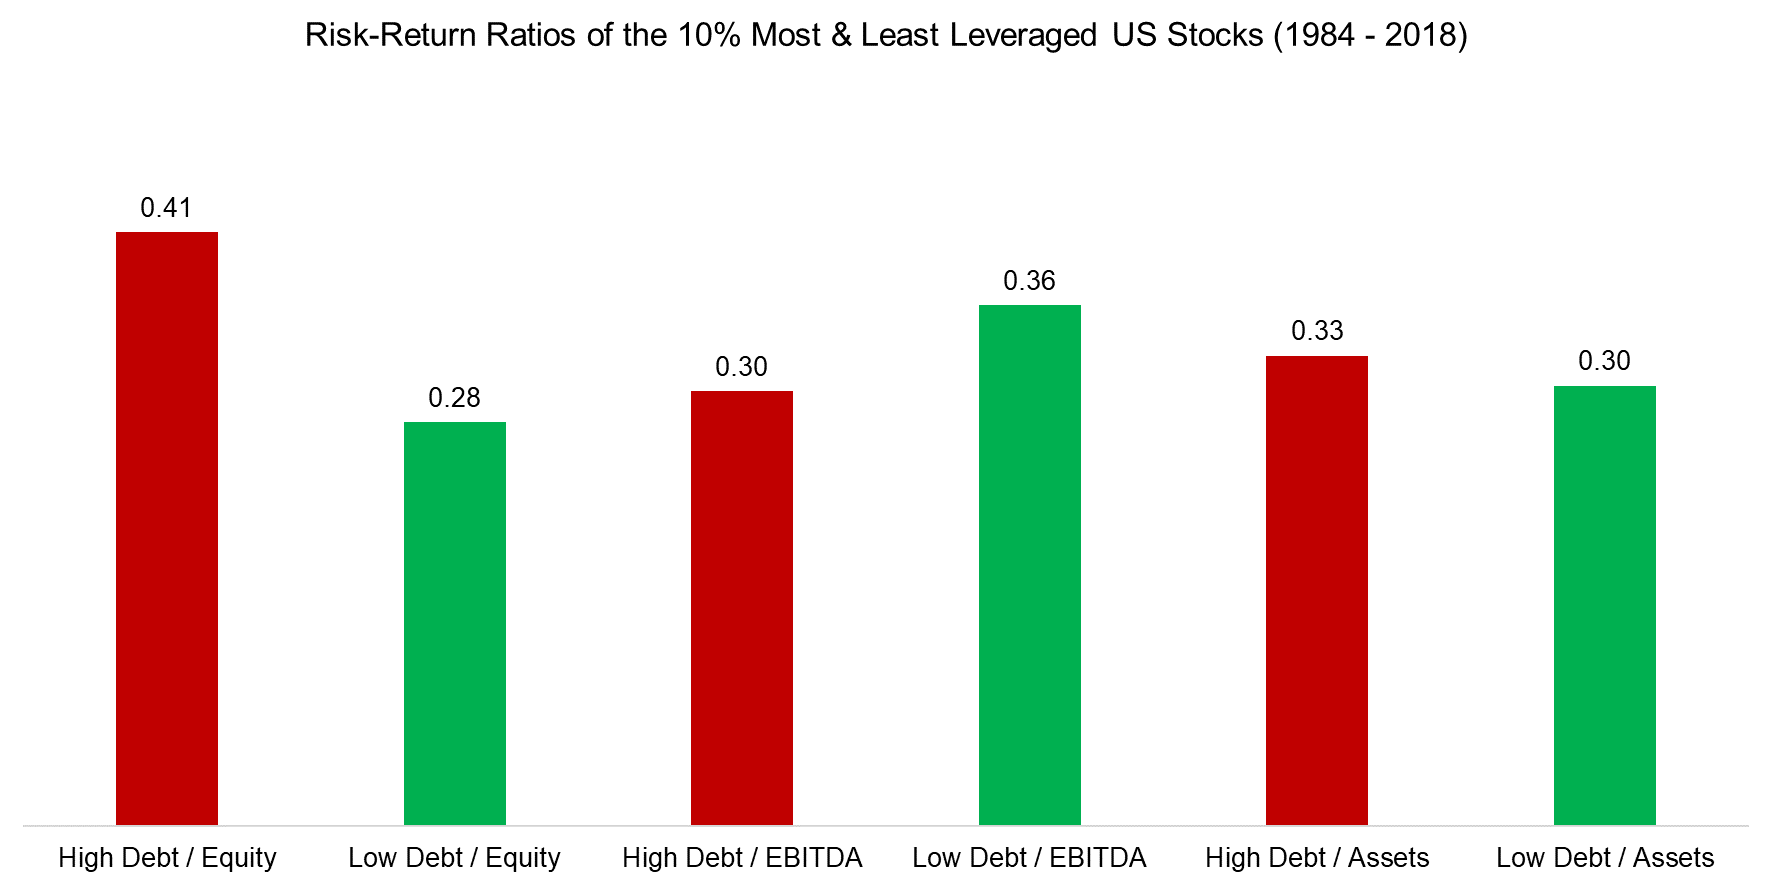
Finally, we calculate the risk-adjusted returns, which highlights that financial leverage increased risk-ratios in two out of three metrics, albeit only slightly.
It is worth highlighting the difference with respect to the research on the Low Volatility factor where stocks are sometimes called low-risk stocks. This factor is supported by an abundance of research that shows higher risk-adjusted returns for stocks with low volatility compared to ones with high volatility. However, in this case, stocks are selected on their historical volatility or beta, and not financial leverage.
Source: FactorResearch
ANALYZING THE SECTOR EXPOSURES OF LEVERAGED STOCKS
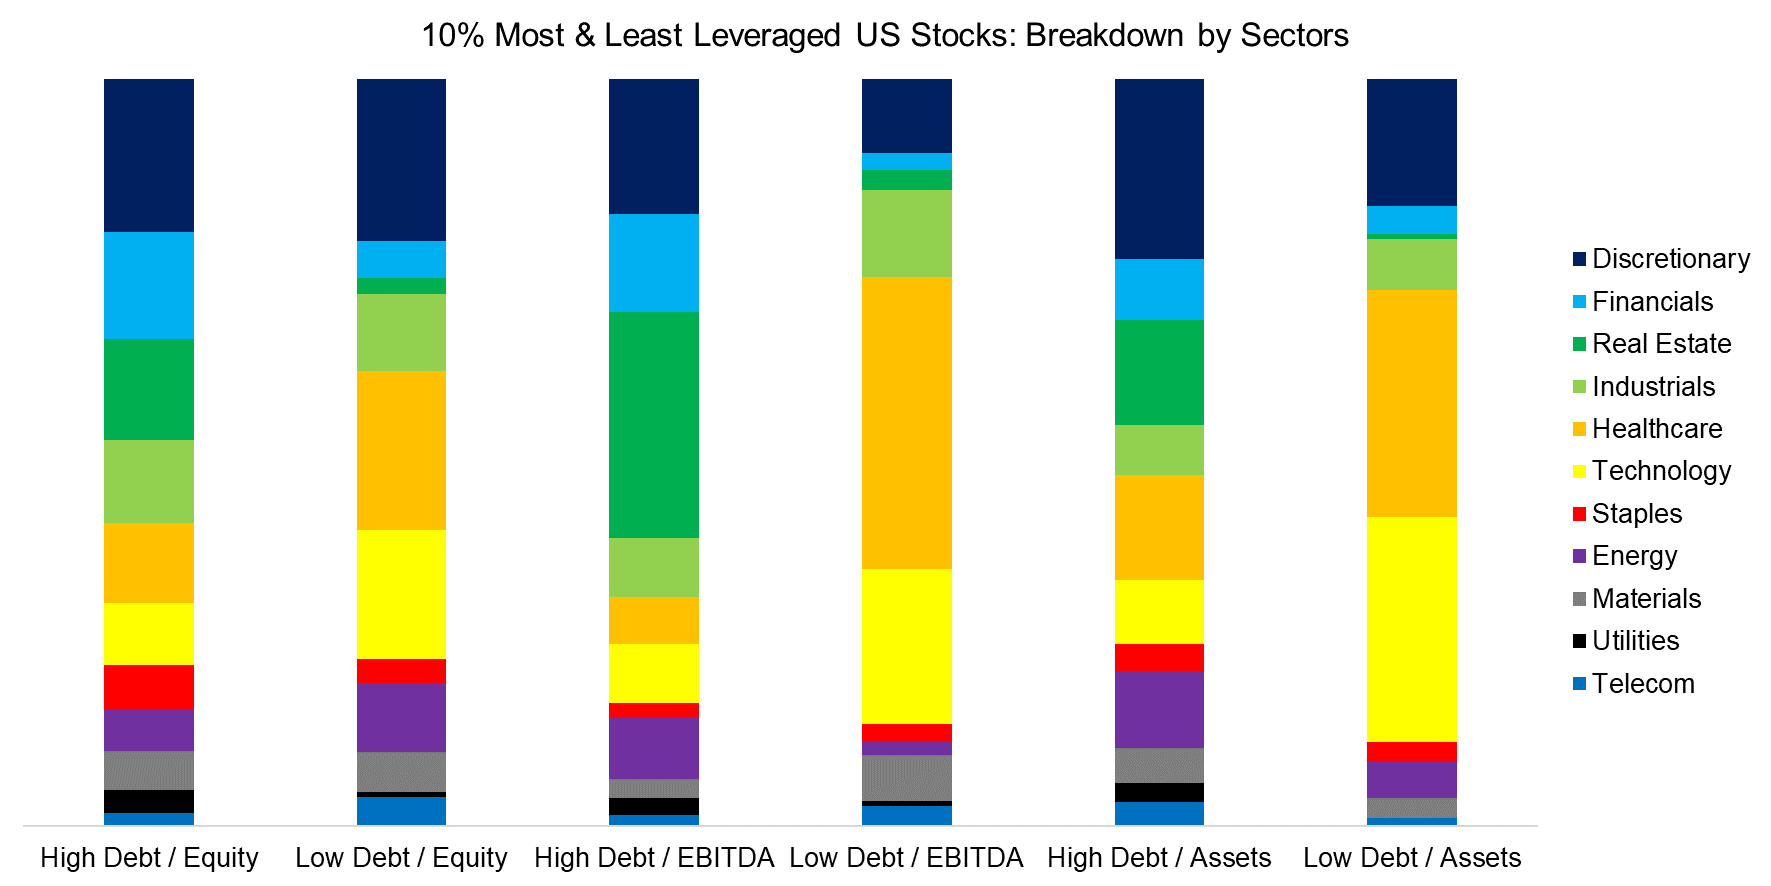
One explanation for the perhaps counterintuitive relationship between financial leverage and volatility is that high indebtedness is not equally negative across industries. Highly cyclical businesses like consumer discretionary stocks likely face a high risk of bankruptcy when featuring high leverage when compared to companies from less cyclical sectors.
The breakdown by sectors highlights strong sector biases with regard to financial leverage. Specifically, real estate and financial companies are often highly leveraged, in contrast to stocks from the healthcare and technology sectors that feature little debt, which simply reflects the different industry characteristics.
However, these industry characteristics also change over time as industries mature. For example, providing leverage to the technology sector was significantly different in 2000 than today as many of the firms have matured and offer stable cash flows that can service debt. Similarly, some industries used to be able to carry high leverage but are no longer able to do, e.g. shopping centre REITs that are facing structurally declining revenues given the rise of online shopping.
Source: FactorResearch
FURTHER THOUGHTS
Debt is like sugar. In moderate amounts, sugar provides us with energy and makes us more productive. However, in large quantities consumed over long time periods, it makes us fat and unhealthy, causing diabetes and heart disease. Unfortunately, it is challenging to reduce sugar consumption once we are hooked on it.
The call for debt deleveraging to consumers, corporates, and governments was clear and sound after the global financial crisis, itself a debt crisis, but few have heeded it. The COVID-19 crisis has not helped and has significantly increased global public debt, which was already at record highs before the pandemic.
However, as this analysis highlights, investors do not need to be overly concerned with highly leveraged stocks as they are not necessarily riskier than lowly leveraged ones, at least when measured on a cross-sector basis. Having said this, the entire US stock market has certainly become riskier as the indebtedness increased for all listed companies. This, coupled with higher valuations and a growing divergence between the real and financial economy, may give investors much greater concern.
RELATED RESEARCH
The Low Vol Factor: From Obscurity to Stardom
The Quality Factor: Zero Alpha for Most Investors?
ABOUT THE AUTHOR
Nicolas Rabener is the CEO & Founder of Finominal, which empowers professional investors with data, technology, and research insights to improve their investment outcomes. Previously he created Jackdaw Capital, an award-winning quantitative hedge fund. Before that Nicolas worked at GIC and Citigroup in London and New York. Nicolas holds a Master of Finance from HHL Leipzig Graduate School of Management, is a CAIA charter holder, and enjoys endurance sports (Ironman & 100km Ultramarathon).
Connect with me on LinkedIn or X.

