Duration as an Equity Factor
Selecting stocks based on their interest rate-sensitivity
April 2024. Reading Time: 10 Minutes. Author: Nicolas Rabener.
SUMMARY
- Stocks can have a high, low, or negative sensitivity to interest rates
- The duration profile of stocks changes frequently
- Having rates exposure in an equities portfolio is not necessarily a concern
INTRODUCTION
The goal of conducting research is to provide clarity by answering questions or confirming theories, but that is not always achieved. For example, we published two research articles on duration and equities (read Duration of U.S. Equities and Duration of U.S. Equities – II) in 2024, but these led to more questions and left us somewhat perplexed.
In the first article, we learned that sectors and factors were not very sensitive to changes in interest rates on average in the period from 1963 to 2023, but also that the averages are misleading as the sensitivity varied significantly over time. In the second article, we could not validate the popular narrative that technology stocks are “long-duration” assets.
However, our previous analysis focused on sectors rather than individual stocks, which may have impacted the research conclusions, eg some technology stocks feature leverage and pay dividends, so have less value in their terminal value than ones still searching for product-market-fit.
In this article, we will use duration for stock selection to create duration-themed portfolios.
STOCK CHARACTERISTICS OF DURATION STOCKS
We use the simple approach to define duration as the sensitivity of stocks to the U.S. 10-Year Treasury Yield as measured via a regression analysis. However, we need to differentiate between stocks that are sensitive to interest rates, which may be measured via highly positive or negative betas, and stocks that are not sensitive, where the betas would be close to zero. Given this, we create four portfolios by selecting the top and bottom 10% of the stocks based on their interest rate sensitivity from the universe of all U.S. stocks with a market capitalization of larger than $1 billion:
- Low interest rate-sensitive stocks: These stocks have betas of close to zero to interest rates
- High interest rate-sensitive stocks: These stocks have highly positive or negative betas to interest rates
- Rising interest rate rate-sensitive stocks: These stocks have highly positive betas to interest rates
- Declining interest rate rate-sensitive stocks: These stocks have highly negative betas to interest rates
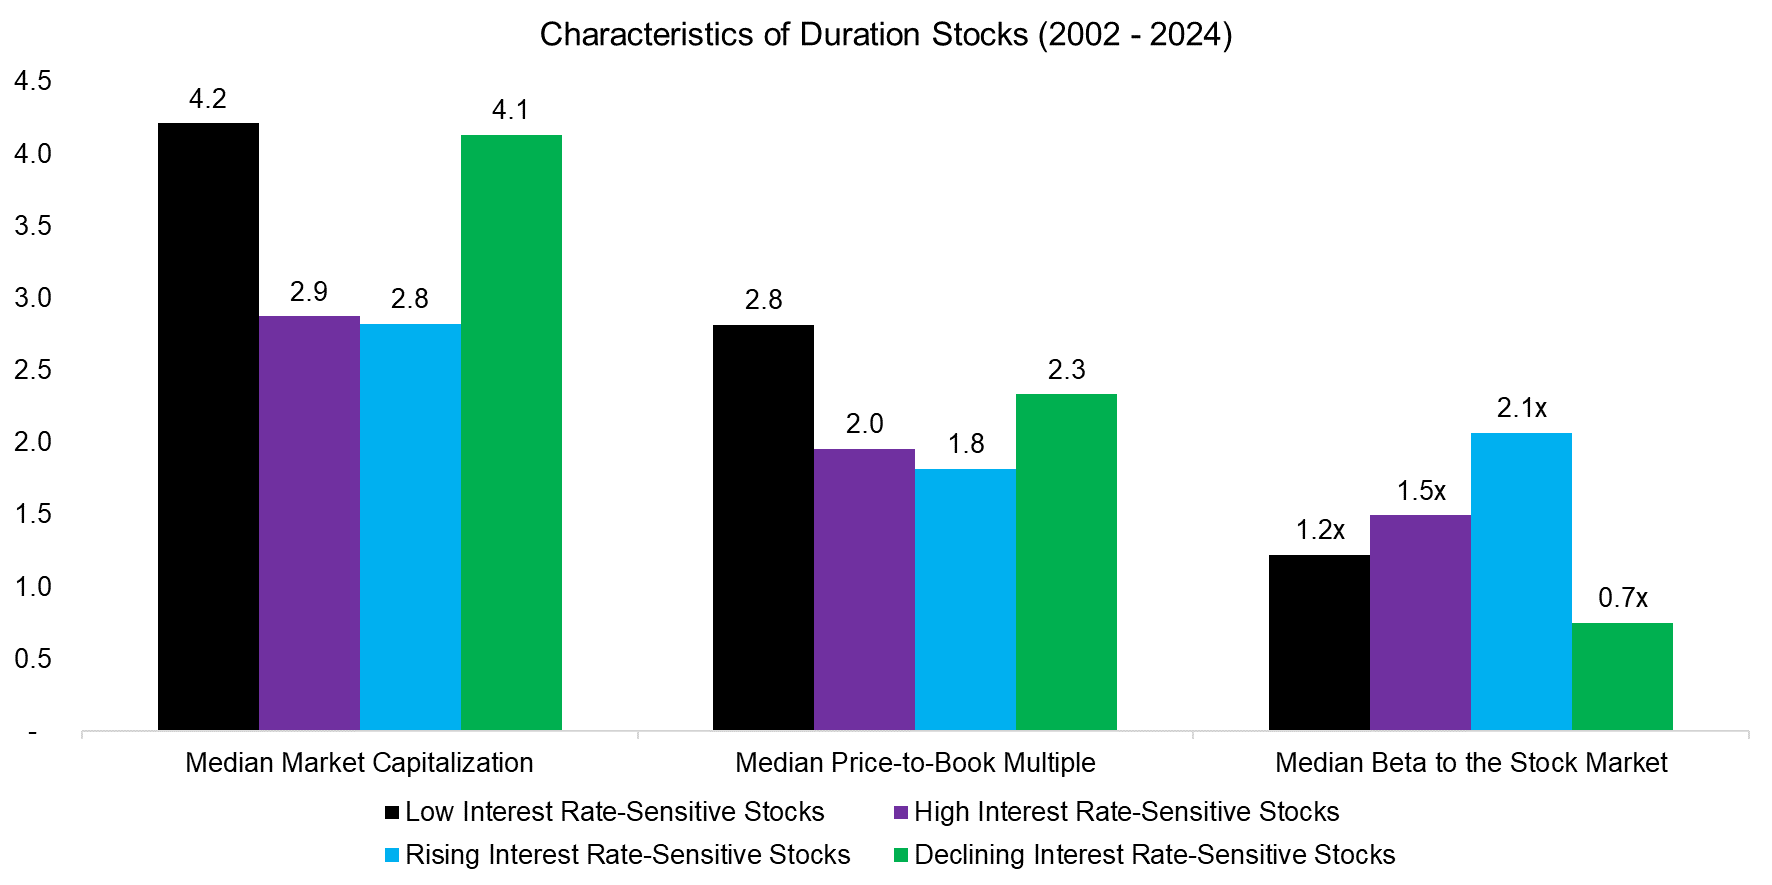
First, we will evaluate the stock characteristics of these four portfolios, where we observe that the median market capitalizations were all below $5 billion, compared to the median market capitalization of the S&P 500 of $33 billion. The median price-to-book (P/B) multiples ranged between 1.8x and 2.8x, while the S&P 500 trades at 2.7x.
However, we see the most significant differences in the median betas to the U.S. stock market, where declining interest rate-sensitive stocks exhibited a low beta of 0.7, compared to rising interest rate-sensitive stocks at 2.1, which essentially represents a leveraged bet on the U.S. stock market and is unusual.
Source: Finominal
BREAKDOWN BY SECTORS
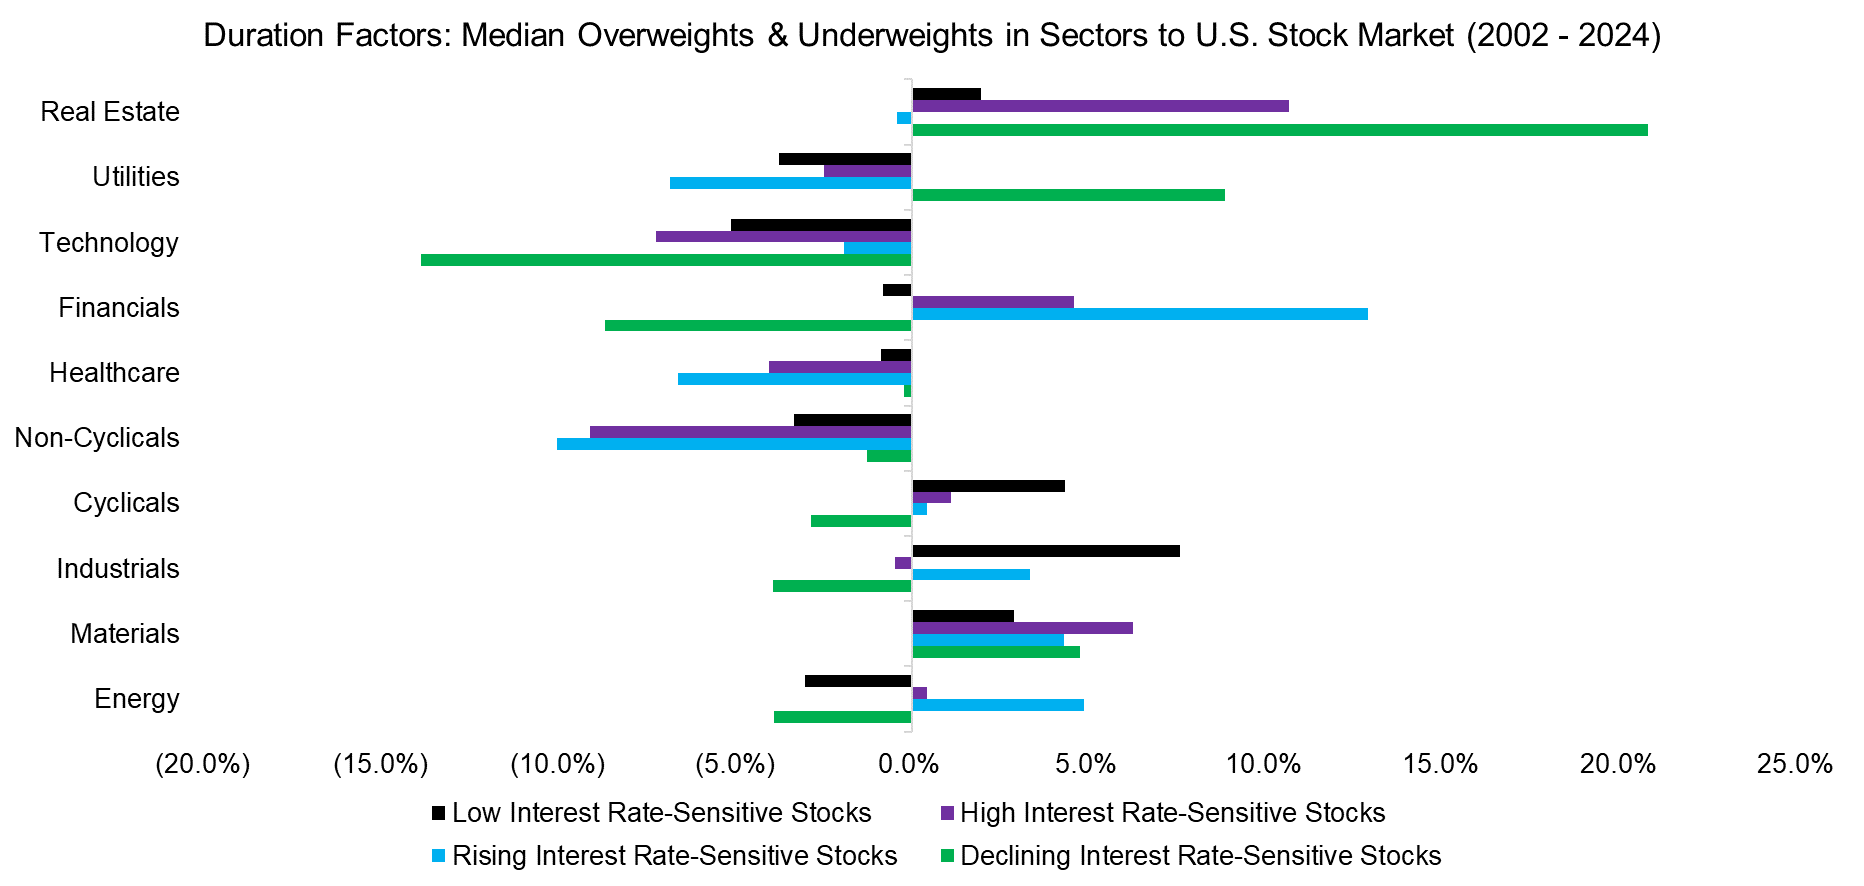
Next, we analyze the over- and underweights of the four portfolios to get a better understanding of their different fundamentals. We observe the following:
- Low interest rate-sensitive stocks: Overweight to industrials, underweight to technology
- High interest rate-sensitive stocks: Overweight to real estate, underweight to non-cyclicals
- Rising interest rate-sensitive stocks: Overweight to financials, underweight to non-cyclicals
- Declining interest rate-sensitive stocks: Overweight to real estate, underweight to technology stocks
The breakdown by sectors does confirm some popular narratives, ie when interest rates are rising, go long financials, or when declining, go long leveraged stocks like real estate and utilities. However, we also note that there was no overweight to technology stocks when interest rates were declining, which goes against the narrative of such stocks representing “long-duration” assets.
Source: Finominal
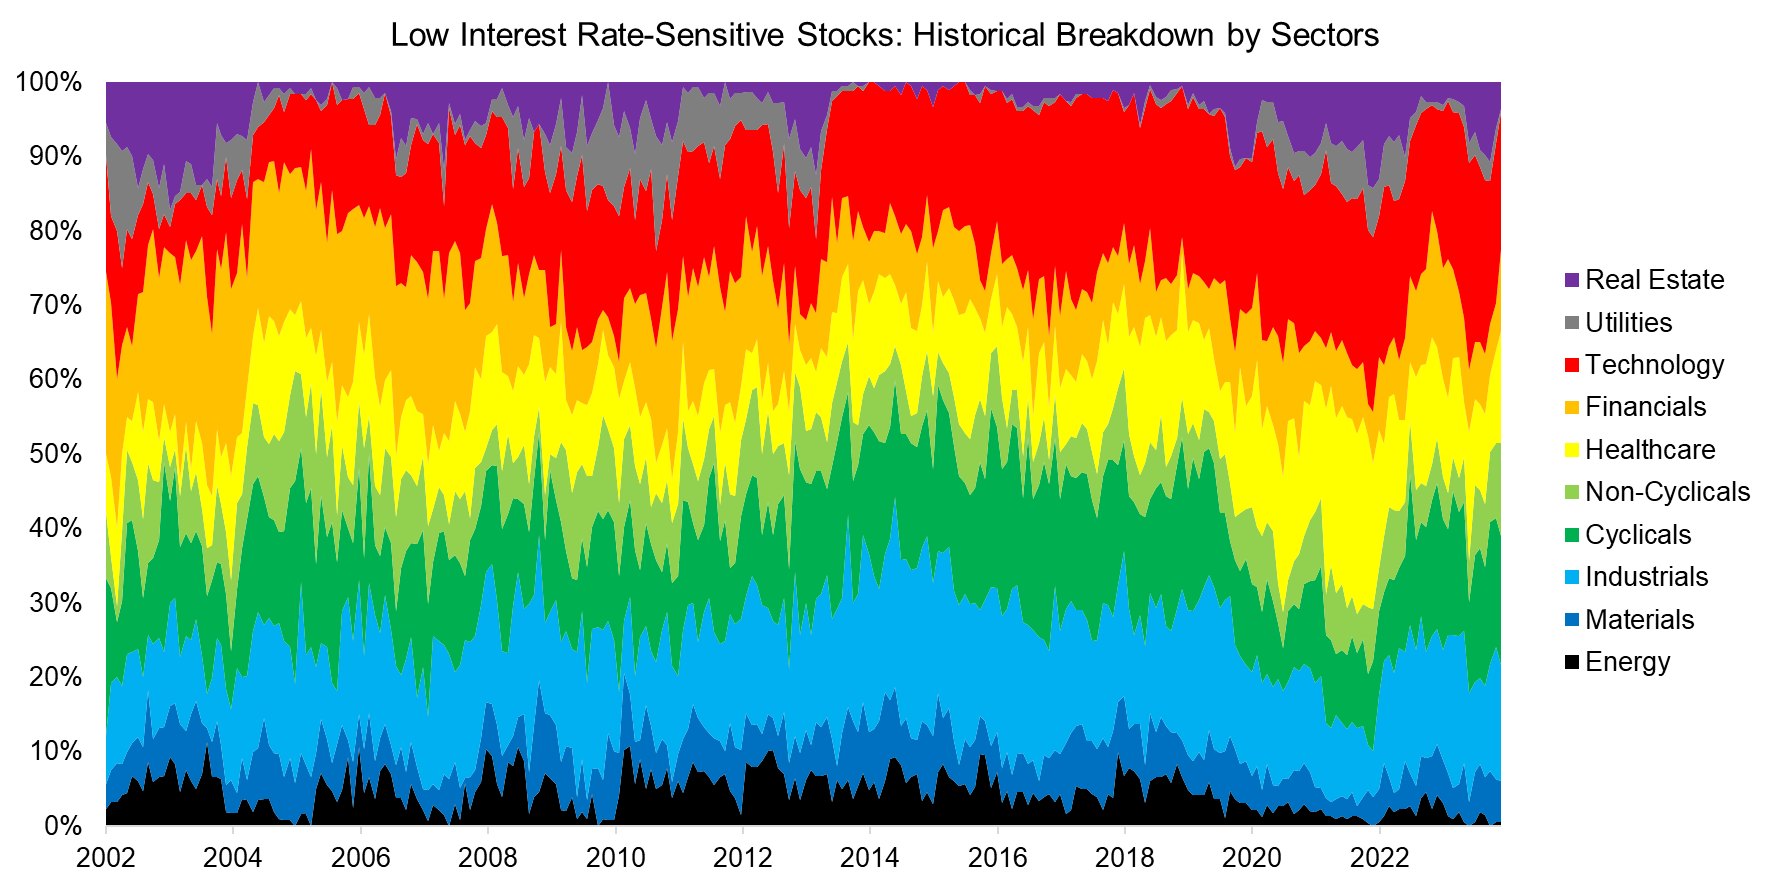
We can further drill into the sector exposures of these portfolios by looking at them over time. The portfolio of low interest rate-sensitive stocks was diversified across sectors, but the exposures did not change significantly in the period from 2002 to 2024.
Source: Finominal
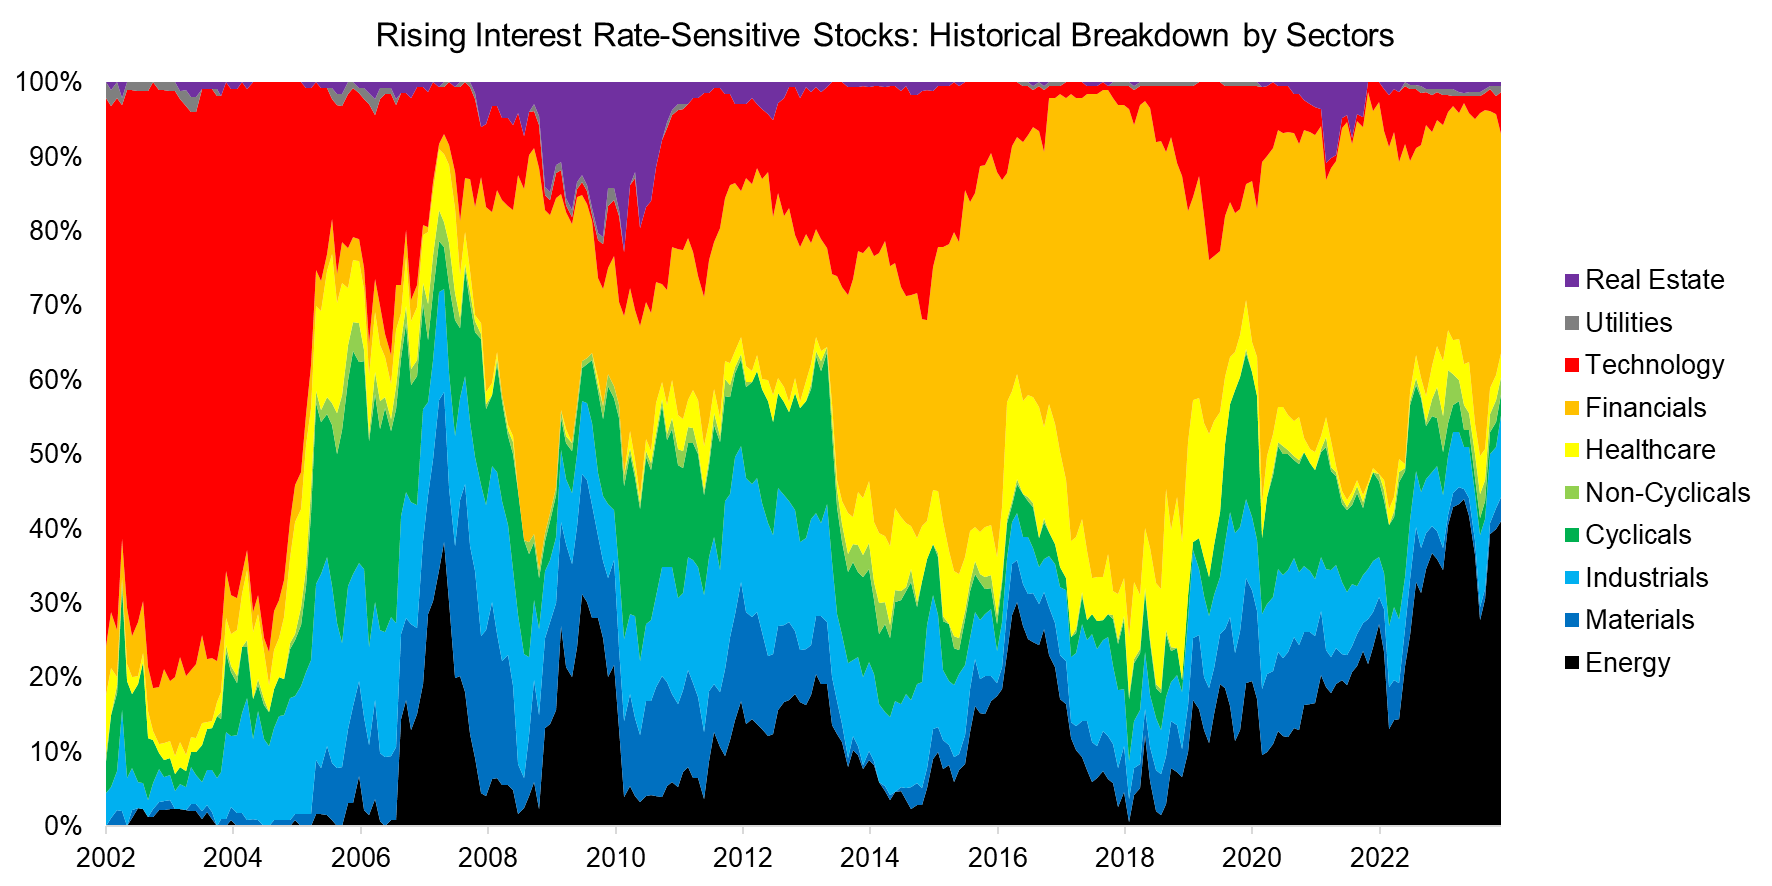
In contrast, we observe that the sectors of the rising interest rate-sensitive stock portfolio changed dramatically over time. Tech stocks dominated the portfolio in the period from 2002 to 2004, but then financials took over thereafter. The only other sector worth highlighting is energy, where the exposure has reached an all-time high in 2024. It could be argued that these stocks are intertwined with inflation, which can explain the positive beta to interest rates.
Source: Finominal
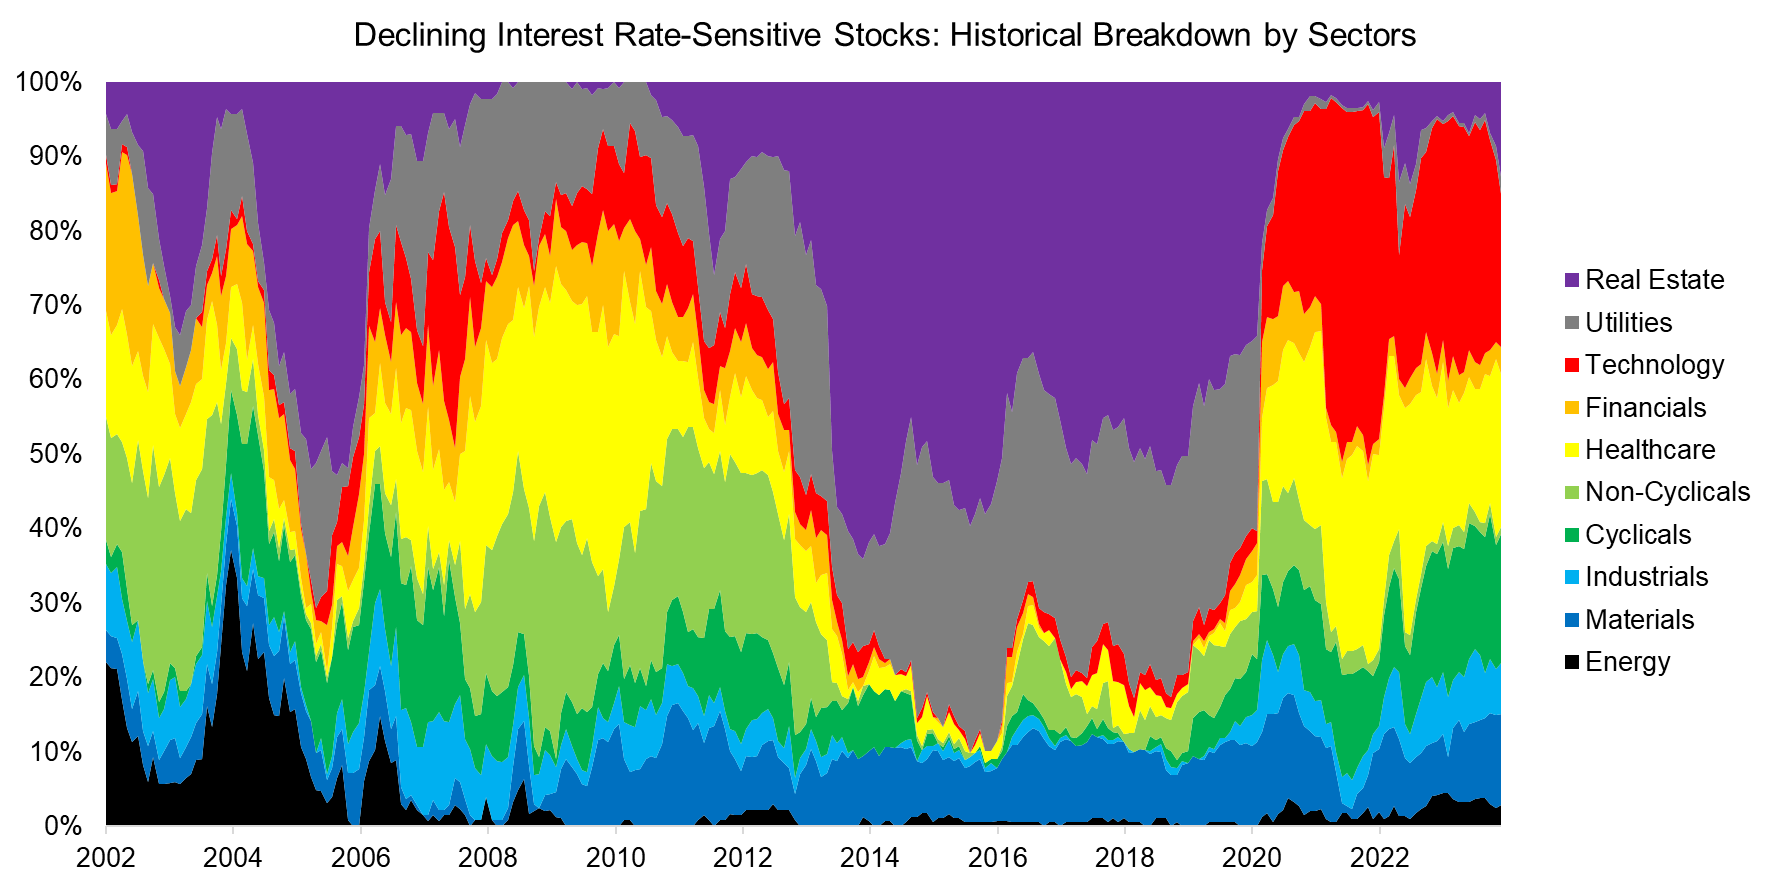
The portfolio of declining interest rate-sensitive stocks was mostly dominated by real estate and utility stocks, which can be explained by these companies benefitting from falling yields given their high amounts of leverage. However, we also observe the appearance of technology stocks, albeit only since 2020, so they could be viewed as “long-duration” assets over the last few years.
Source: Finominal
PERFORMANCE OF DURATION FACTORS
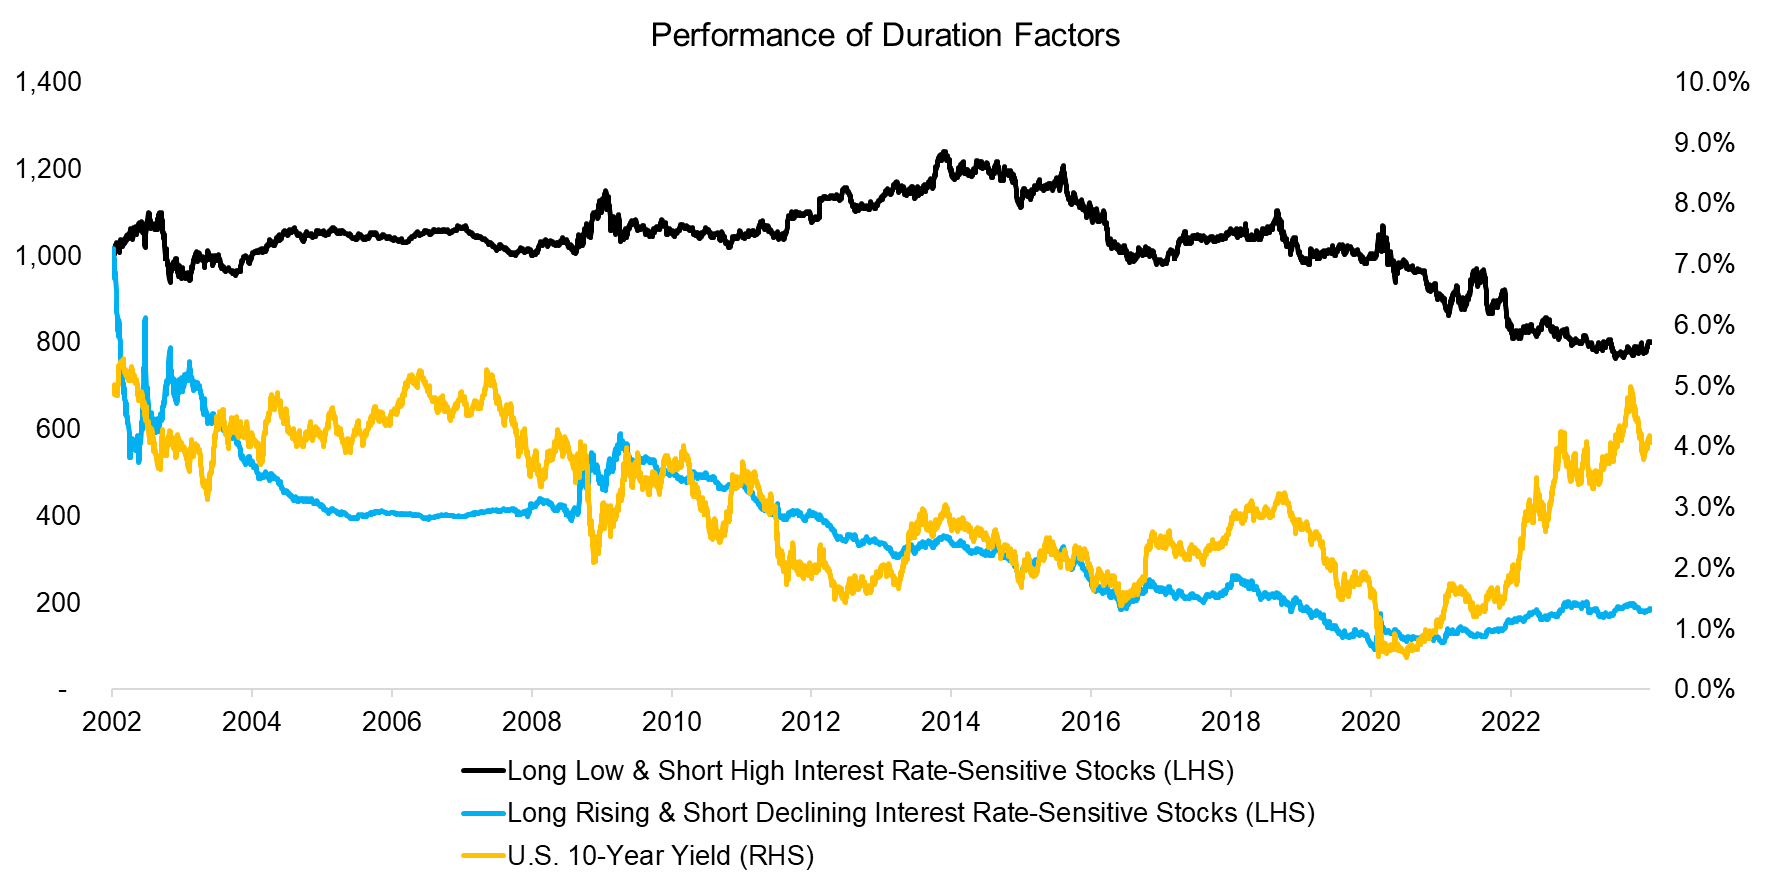
Finally, we show the performance of the four portfolios when combined into long-short beta-neutral portfolios. We observe that the long low & short high interest rate-sensitive stock portfolio generated almost a zero return in the period from 2002 to 2012, and then consistently negative returns thereafter. It is worth highlighting that this portfolio can be considered an interest rate-neutral one as the long portfolio contains stocks that are not sensitive to interest rates, while the short portfolio is comprised of stocks with highly positive and negative betas.
In contrast, the portfolio going long rising interest rate-sensitive stocks and short declining interest rate-sensitive stocks is a proxy for the yield of the U.S. 10-Year Treasury Note as per its design.
Source: Finominal
FURTHER THOUGHTS
Although this third article on duration and equities has generated some insights, eg we were able to observe the “long-duration” characteristics of tech stocks, albeit if only for a brief period, it confirms the fickle nature of the interest rate sensitivities of stocks.
This alone should caution investors not to act on increasing or decreasing interest rate-sensitivity of their portfolios. The other argument is that no one knows where rates are headed. Perhaps measurement is better than management in this case.
RELATED RESEARCH
Duration of U.S. Equities – II
Duration of U.S. Equities
Myth-Busting: Low Rates Don’t Justify High Valuations
Factor Exposure Analysis 106: Macro Variables
Factor Exposure Analysis 108: Fixed Income Factors II
Factor Exposure Analysis 107: Fixed Income Factors
Factors & Interest Rates
Factor Exposure Analysis 104: Fixed Income ETFs
Smart Beta Fixed Income ETFs
Equity vs Bond Indices
ABOUT THE AUTHOR
Nicolas Rabener is the CEO & Founder of Finominal, which empowers professional investors with data, technology, and research insights to improve their investment outcomes. Previously he created Jackdaw Capital, an award-winning quantitative hedge fund. Before that Nicolas worked at GIC and Citigroup in London and New York. Nicolas holds a Master of Finance from HHL Leipzig Graduate School of Management, is a CAIA charter holder, and enjoys endurance sports (Ironman & 100km Ultramarathon).
Connect with me on LinkedIn or X.

