Duration of U.S. Equities – II
How sensitive are stocks to changes in interest rates?
February 2024. Reading Time: 10 Minutes. Author: Nicolas Rabener.
SUMMARY
- There are multiple ways to measure interest rate sensitivities
- “High-duration” stocks like tech and biotech were not more sensitive to rising rates
- The relationship between interest rates and stocks is weak
INTRODUCTION
In our first article on the duration of U.S. equities (read Duration of U.S. Equities) we concluded that the interest rate sensitivity of the stock market ranged significantly between 1973 and 2023, which was difficult to explain and also questioned the usefulness of such information. Furthermore, we observed that factors like value or momentum did exhibit different sensitivities, but almost all sectors showed the same trends in sensitivity as the S&P 500.
However, these results conflict with the consensus view that the implosion of the tech and other bubbles in 2022 was caused by the rise in interest rates, where some sectors are supposedly more sensitive than others. Intuitively, increasing yields should deflate excessive enthusiasm in highly speculative investments like unprofitable tech companies, biotech stocks, cryptocurrencies, and 100-year bonds. Investors are more hesitant to undertake risky investments when short-term deposits or bonds pay 4% to 5%.
Given this, we will explore the duration of equities further in this article.
MEASURING INTEREST RATE SENSITIVITY
It should not be complicated to measure the interest rate sensitivity of a security. However, if we take a time series like the U.S. 10-Year Treasury Yield as the independent variable in a regression analysis, then we need to decide whether to take the absolute change or percentage change in yield. Given that yield itself is a percentage, it can be argued that the absolute change is more relevant (read Factor Exposure Analysis 106: Macro Variables).
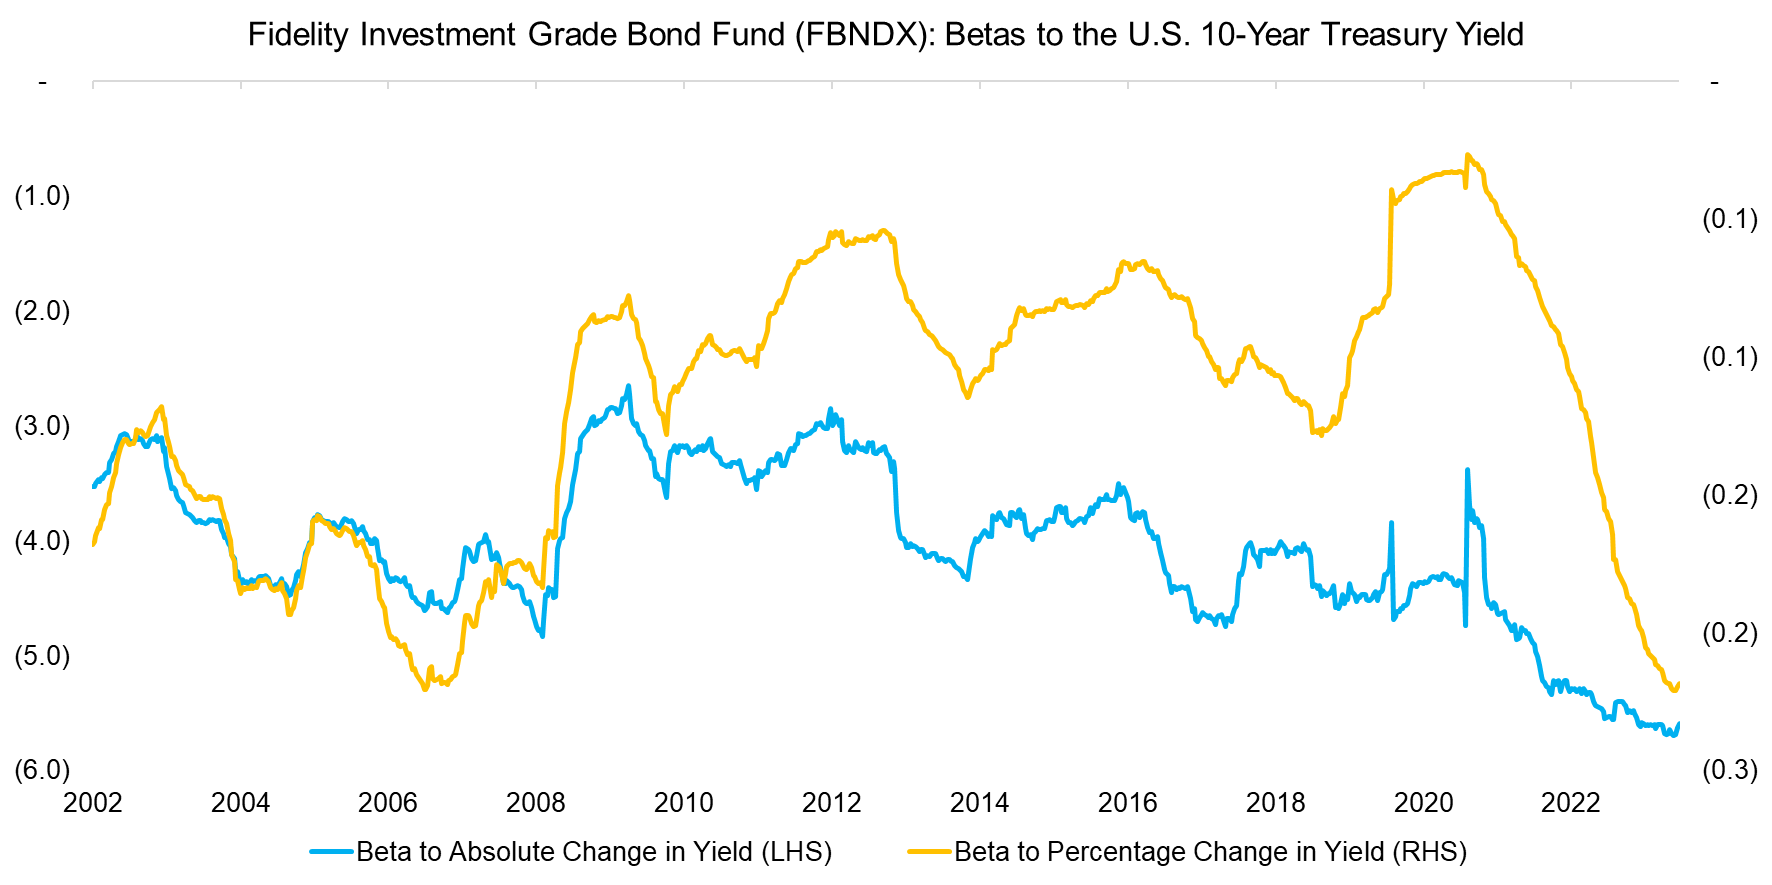
We compute the rolling one-year betas of Fidelity’s Investment Grade Bond Fund (FBNDX) using the absolute and percentage change in the yield, which highlights similar trends between 2002 to 2008, but some divergence thereafter. The magnitude is significantly different as the average beta is -4.0 when using the absolute difference in yield, compared to an average of -0.1 for the percentage change.
Source: Finominal
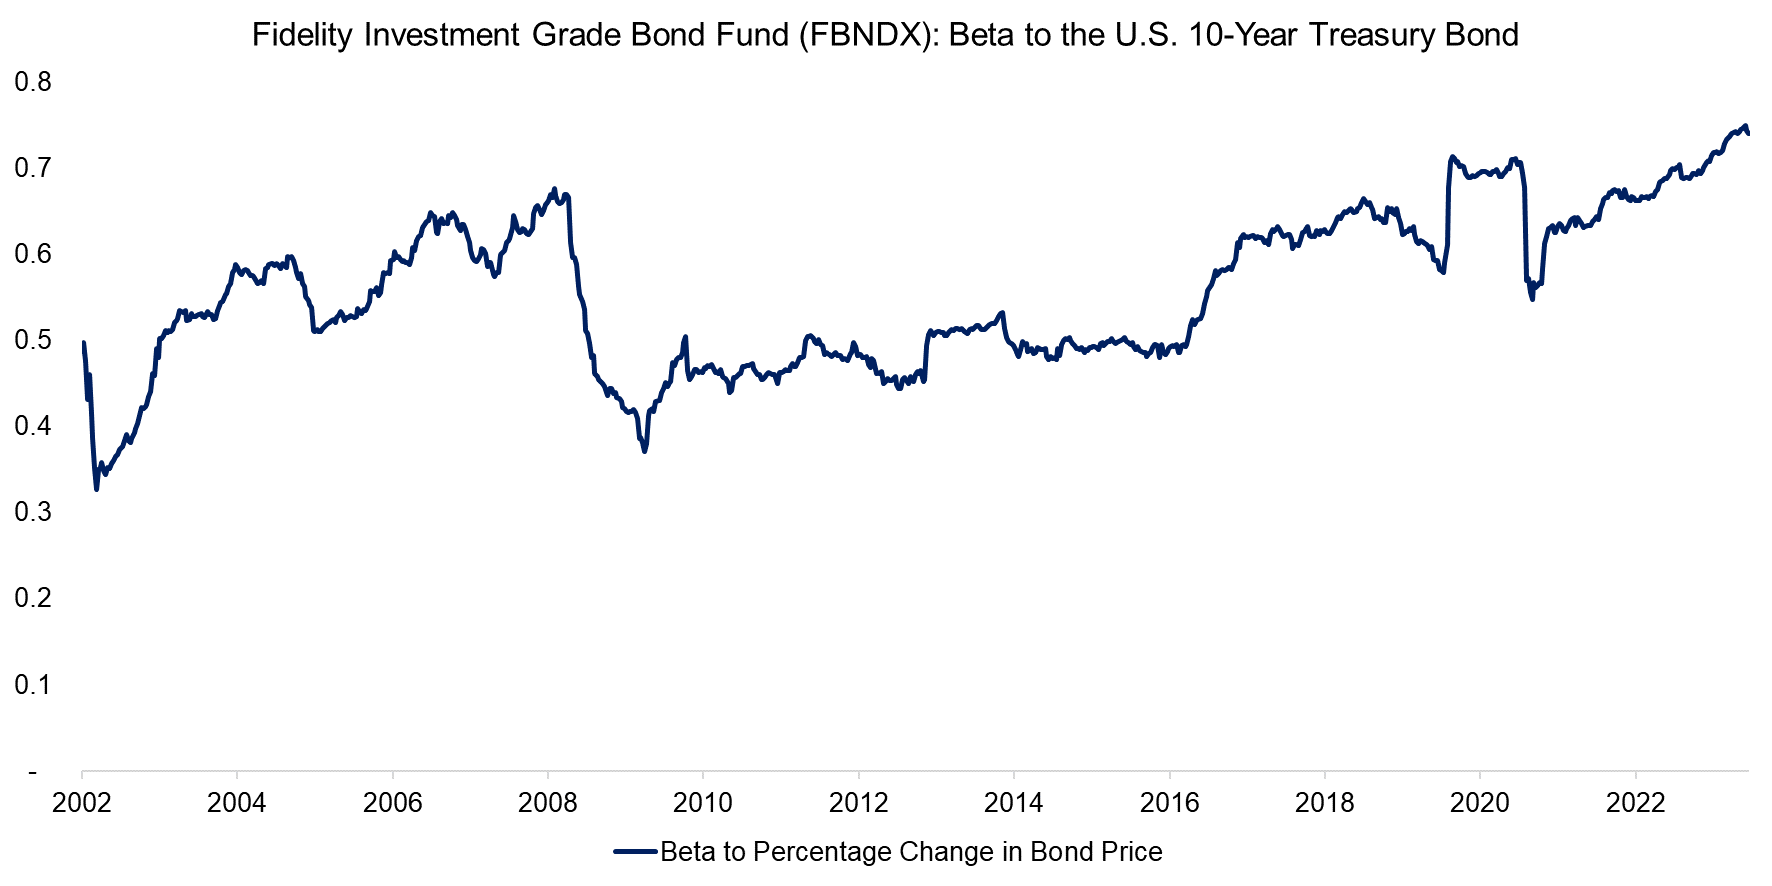
A third alternative for measuring the interest rate sensitivity of a security is by using a bond index as an independent variable. We compute the rolling one-year beta of the U.S: 10-Year Treasury Bond Index, which highlights an average of 0.6 for FBNDX for the period between 2002 and 2023. The fund invests in investment-grade bonds, but seems to have been overweighting long-term treasuries in recent years as indicated by the rising beta.
Source: Finominal
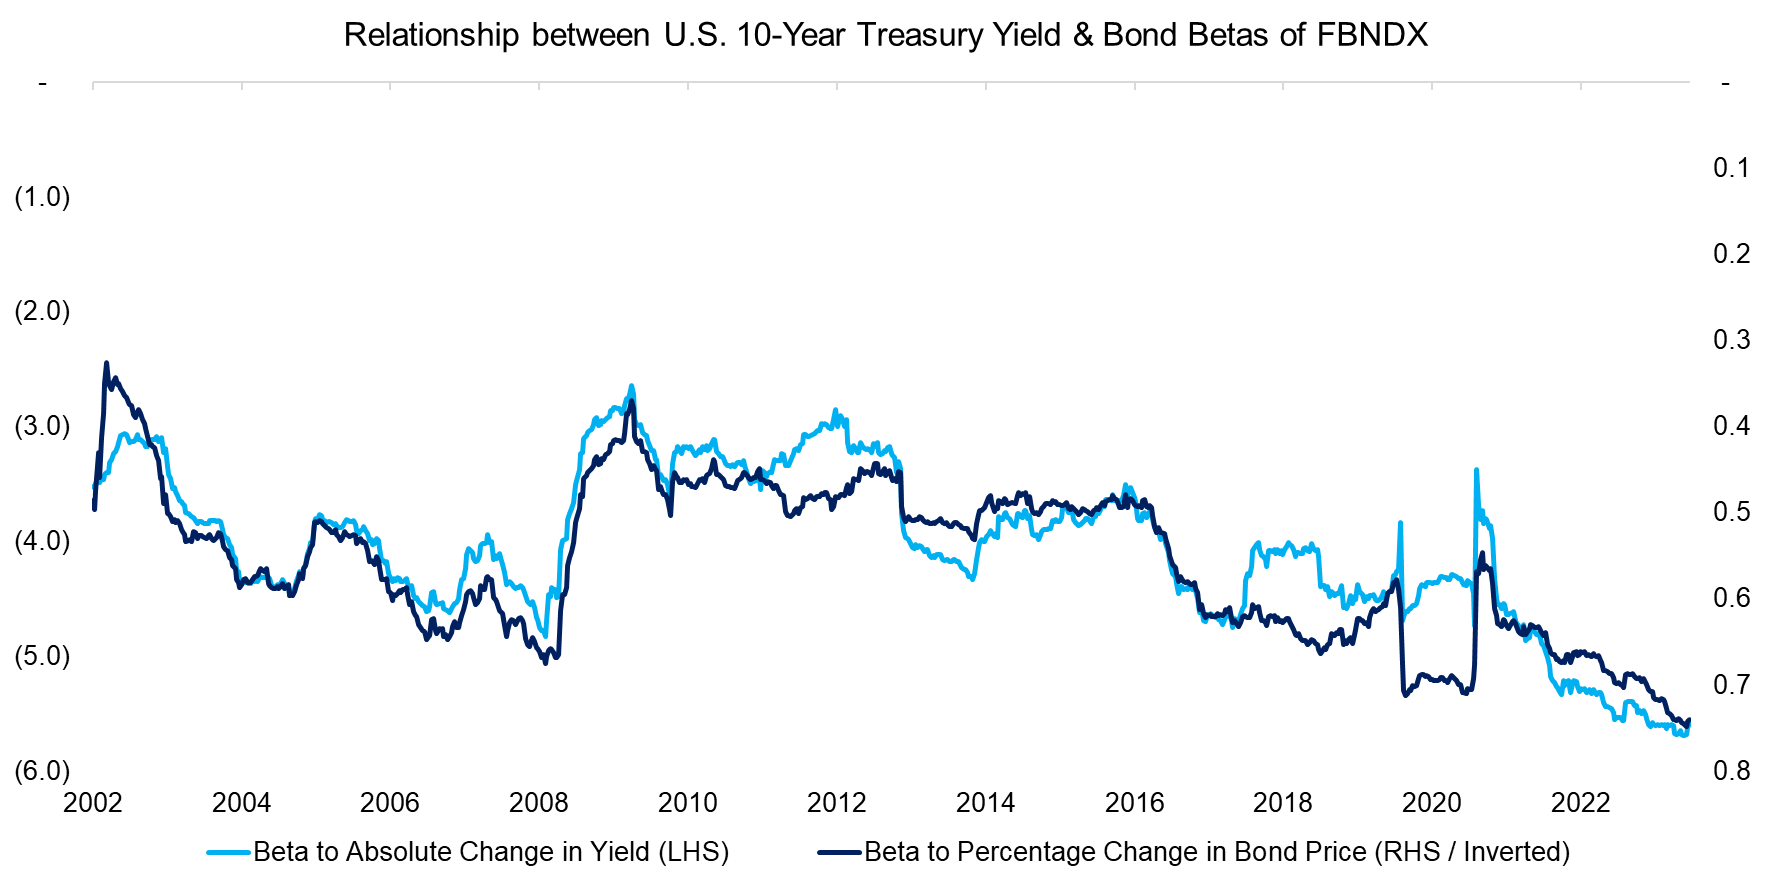
Naturally bond prices are a function of the yield, which we can demonstrate by using the absolute change in yield and inverting the percentage change in bond prices. The chart highlights that these two betas of FBNDX feature identical trends over the last 20 years.
The R2 from the regression analysis are another way of determining which input variable best explains the returns of FBNDX, which was 0.75 when using the percentage change in bond prices, 0.73 for the absolute change in bond yields, and 0.71 for the relative change in bond yields.
Source: Finominal
DURATION OF U.S. EQUITIES
Finally, we move on to measuring the duration of equities. Basic corporate finance dictates that the value of a stock is determined by its future cashflows and its terminal value. The value of companies with low or negative cashflows is therefore almost exclusively determined by its terminal value, which increases as interest rates decline.
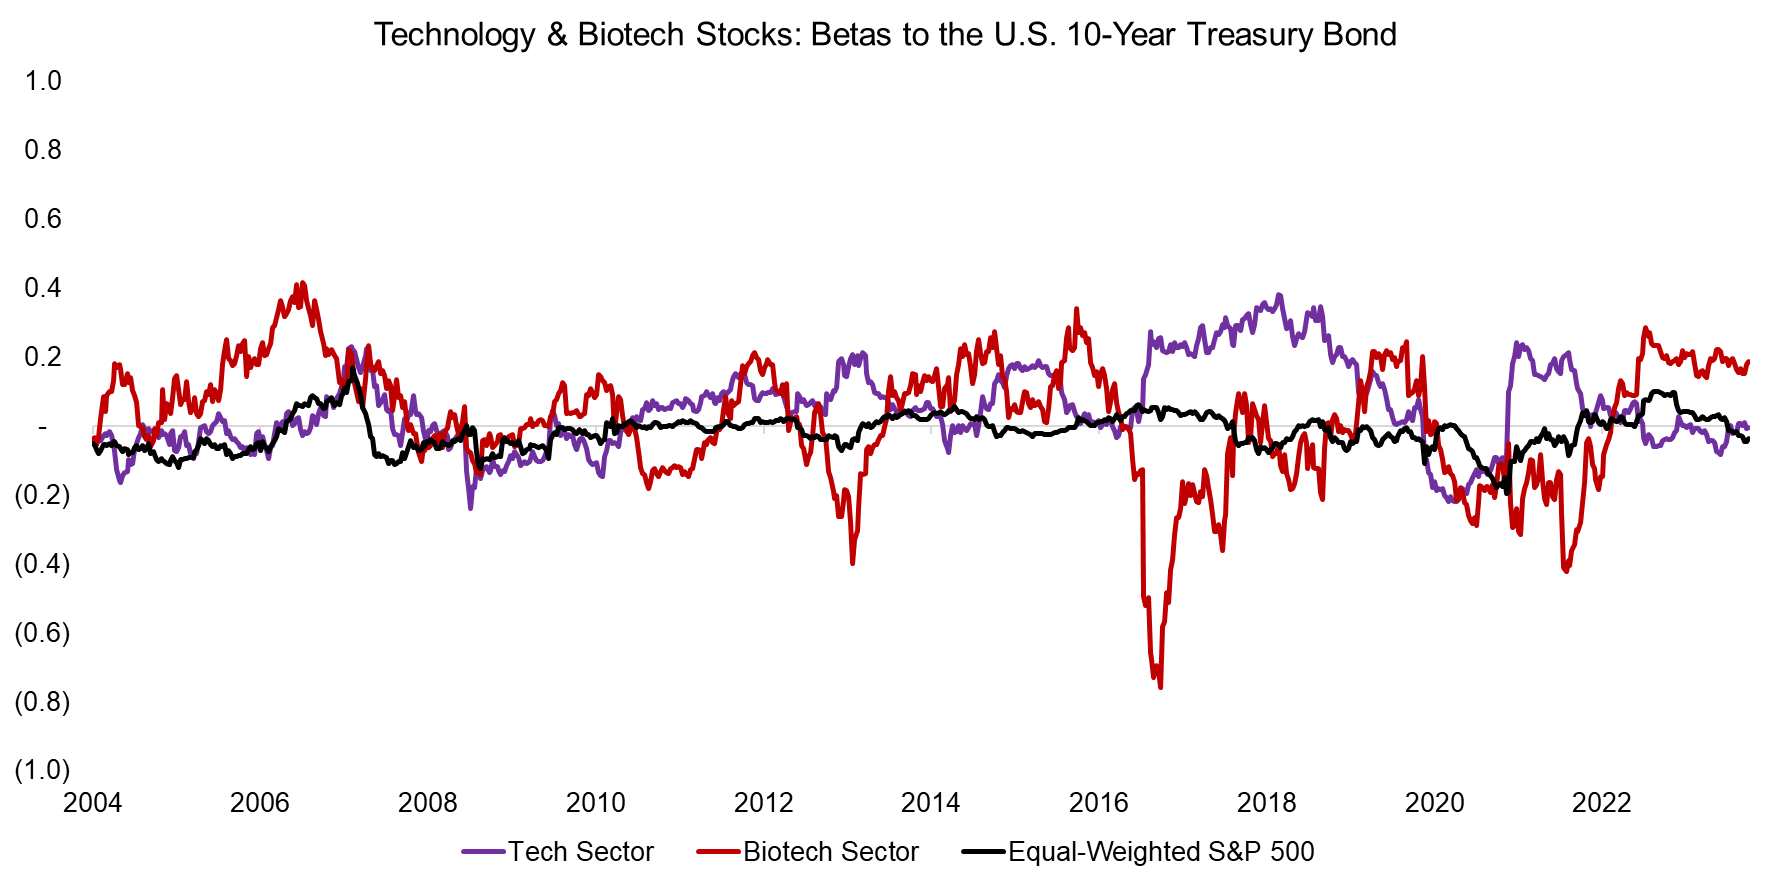
Most technology and almost all biotech stocks do not pay dividends and should therefore have benefitted from declining interest rates in the last decade, and been negatively impacted by rising rates in 2022. We run a regression analysis for these two sectors using the U.S. 10-Year Treasury Bond, S&P 500, and five equity factors as independent variables, where the R2 is 0.7 for the biotech and 0.9 for the technology sector.
We would expect the betas of these two sectors to the U.S. 10-Year Treasury Bond to be positive given that they are often labelled as “high duration” assets, but these were zero on average and not higher than that of the equal-weighted S&P 500 in the period from 2002 to 2022. Stated differently, rising or declining interest rates did not impact the returns of biotech or technology stocks significantly.
Source: Finominal
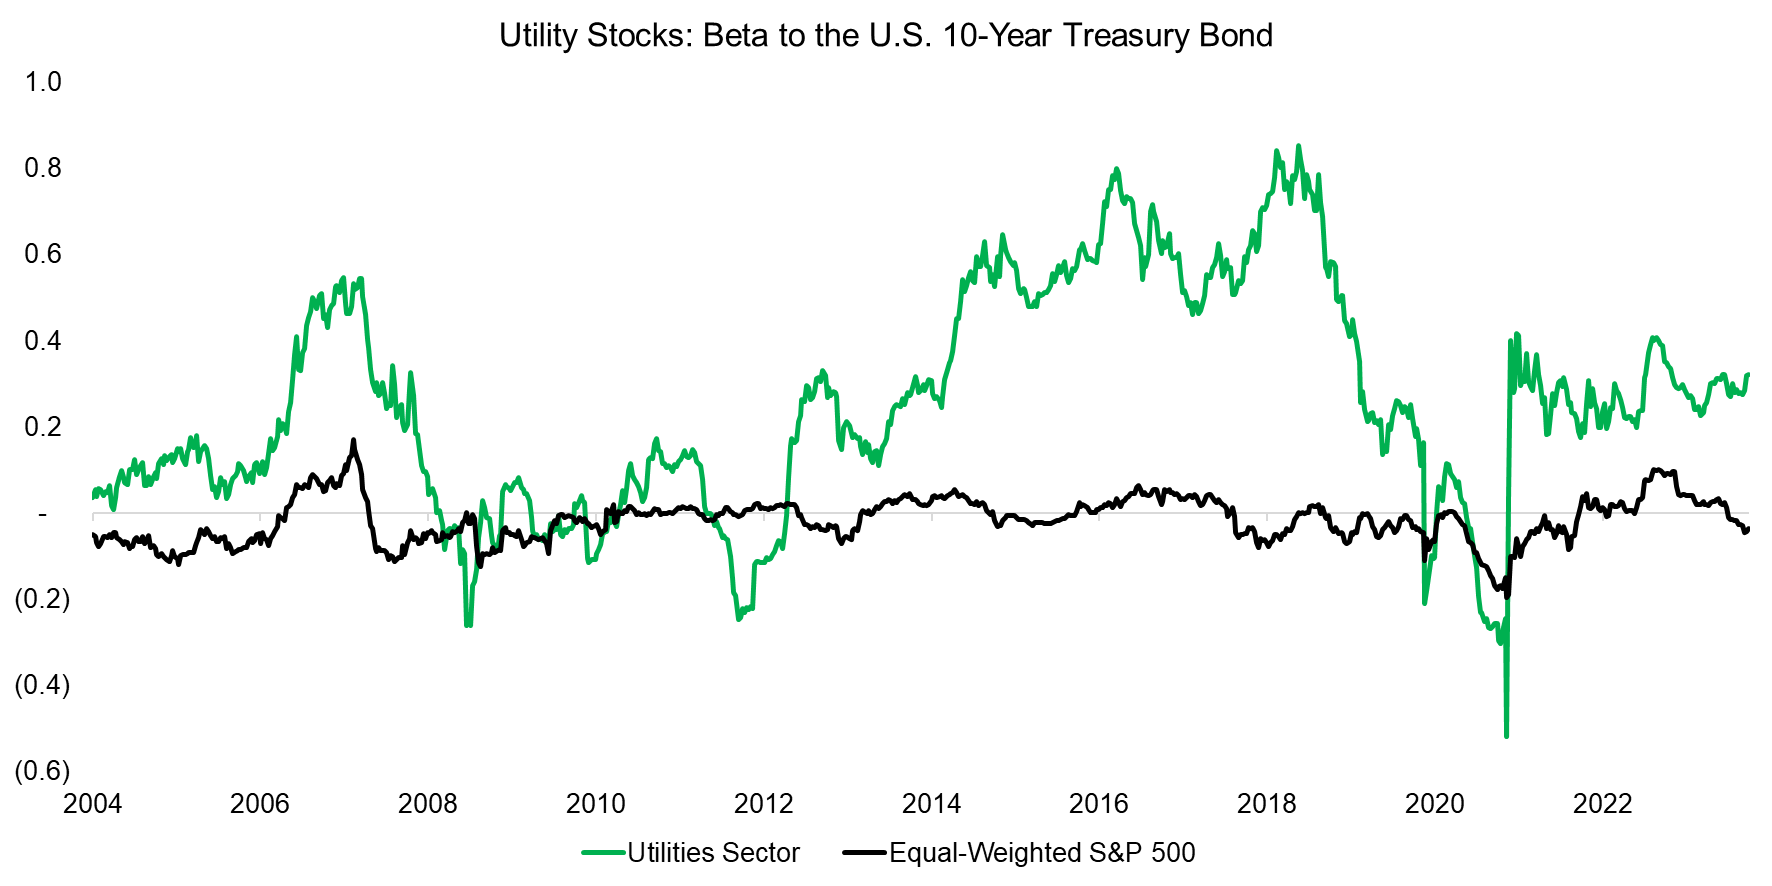
In contrast, utility companies feature high dividend yields where the terminal value plays a lower role than for biotech or technology stocks. From a corporate finance perspective, these companies should benefit from rising rates on a relative basis.
We should therefore expect a structurally lower beta to the U.S. 10-Year Treasury Bond, but observe the opposite. How can we explain this?
Well, utility companies tend to be highly leveraged as they have stable cashflows and, therefore benefit more from declining than rising interest rates as it reduces their financing costs and increases their earnings. The capital structure of utilities, real estate, and telecom companies makes them bond proxies (read The Dark Side of Low-Volatility Stocks).
Having said this, the interest rate sensitivity of utility stocks has not been stable on an absolute or relative basis, which reduces the utility of measuring this.
Source: Finominal
FURTHER THOUGHTS
Theoretically, interest rates matter for stock prices, but practically they do not matter much.
Another way of demonstrating the weak relationship between these two variables is by looking at valuations. Investors frequently justify the high equity multiples of U.S. stocks of the recent decade by declining interest rates through the quantitative easing policies of the U.S Fed, but the ECB and BoJ had more aggressive programs that did not lead to high valuations (read Myth-Busting: Low Rates Don’t Justify High Valuations).
RELATED RESEARCH
Duration of U.S. Equities
Myth-Busting: Low Rates Don’t Justify High Valuations
Factor Exposure Analysis 106: Macro Variables
Factor Exposure Analysis 108: Fixed Income Factors II
Factor Exposure Analysis 107: Fixed Income Factors
Factors & Interest Rates
Factor Exposure Analysis 104: Fixed Income ETFs
Smart Beta Fixed Income ETFs
Equity vs Bond Indices
ABOUT THE AUTHOR
Nicolas Rabener is the CEO & Founder of Finominal, which empowers professional investors with data, technology, and research insights to improve their investment outcomes. Previously he created Jackdaw Capital, an award-winning quantitative hedge fund. Before that Nicolas worked at GIC and Citigroup in London and New York. Nicolas holds a Master of Finance from HHL Leipzig Graduate School of Management, is a CAIA charter holder, and enjoys endurance sports (Ironman & 100km Ultramarathon).
Connect with me on LinkedIn or X.

