Equity Factors & GDP Growth
Does Strong Economic Growth Equate to High Factor Returns?
March 2018. Reading Time: 10 Minutes. Author: Nicolas Rabener.
SUMMARY
- Economic cycles have a clear impact on factor performance
- Some factors show pro-cyclical while others highlight anti-cyclical characteristics
- Given that real GDP is not published in real-time, it is unlikely effective for factor selection
INTRODUCTION
Financial commentators frequently explain a rising stock market by the strength of the economy, which is rather intuitive. If the economy grows, then investors would expect public companies to grow their revenues and earnings, which should be reflected in rising stock prices. However, research by Dimson et al (2002) revealed that there is a modest negative correlation between long-run equity returns and economic growth by analysing multiple countries over a century. One explanation for this growth puzzle is that markets are forward-looking and current stock prices already reflect the economic growth. In factor investing economic cycles are often considered for factor selection and in this short research note we will analyse the relationship between equity factor returns and real GDP growth in the US (read Factors & Interest Rates).
METHODOLOGY
In this research report we initially focus on the Value, Size and Momentum factors from Fama-French, which are constructed as dollar-neutral long-short portfolios based on the top and bottom 10% of the US stock market. The data includes companies with small market capitalisations, excludes transaction costs and is available since 1926. We expand the factor set by the Low Volatility, Quality, Growth and Dividend Yield factors based on our own data, which is available since 2000. These are created via long-short beta-neutral portfolios and only include stocks with a market capitalisation of larger than $1 billion. Portfolios are rebalanced monthly and each transaction occurs costs of 10 basis points.
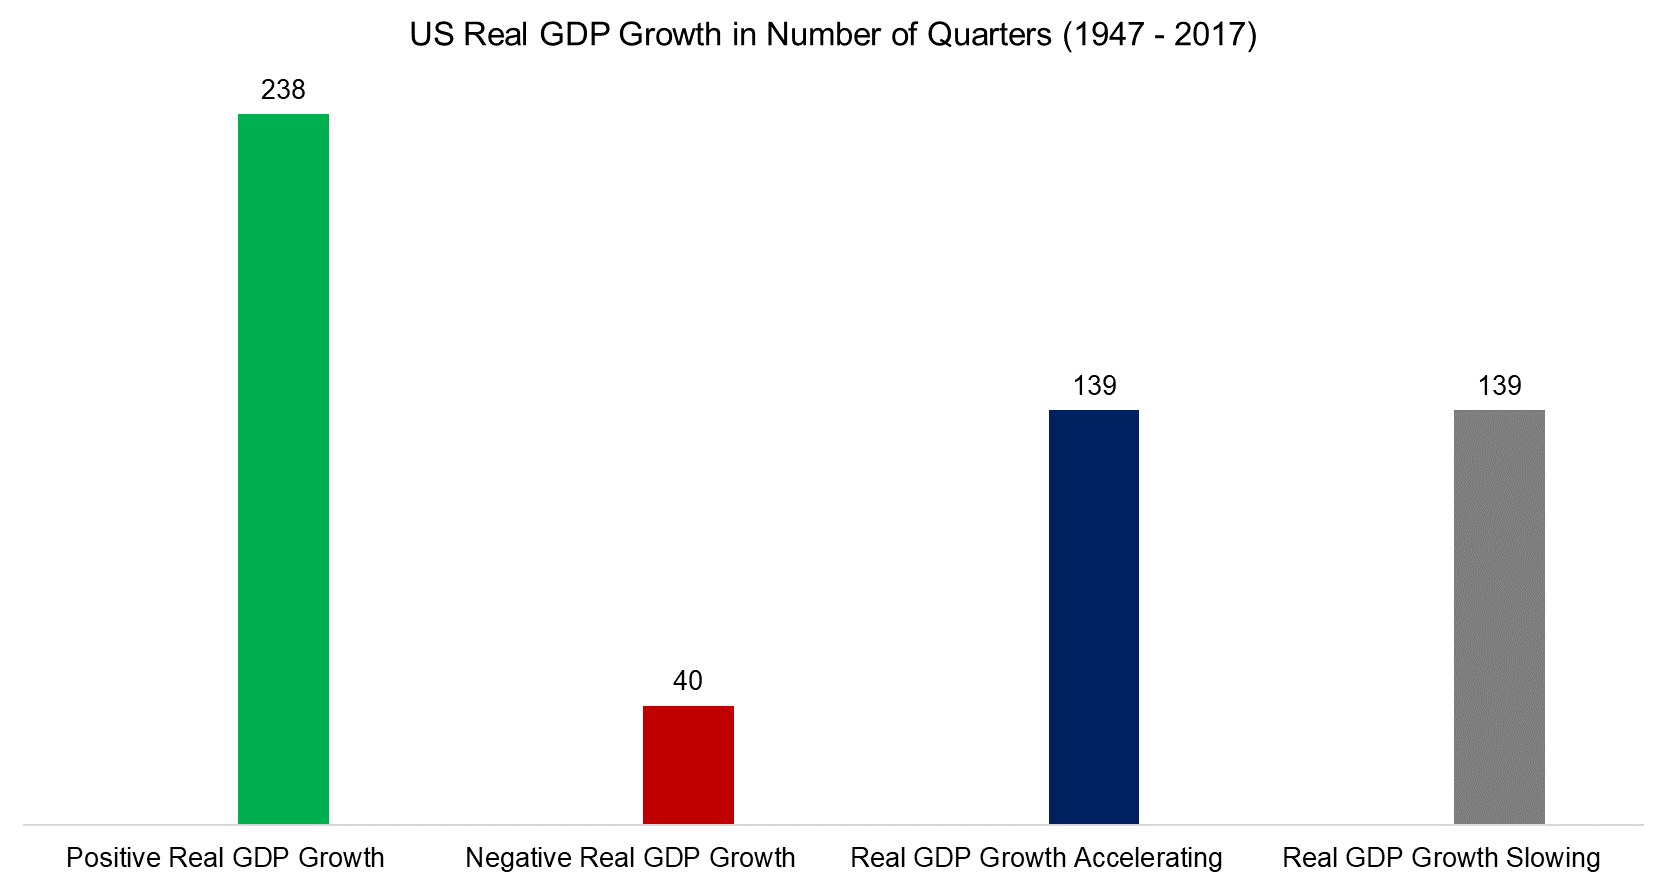
Real GDP data is sourced from the Federal Reserve Bank of St. Louis and available since 1947. The chart below shows the number of quarters with positive and negative real GDP growth as well as accelerating and decelerating growth, which is defined as the last quarter divided by the average growth of the previous four quarters. We can observe that more than 85% of the quarters showed positive real GDP growth, highlighting the remarkable growth of the US economy, and that the split between acceleration and slowdown was equal.
Source: Federal Reserve Bank of St. Louis, FactorResearch
EQUITY FACTORS & REAL GDP GROWTH: 1947 – 2017
The chart below shows the returns of the S&P 500 and three factors (long-short) since 1947 sorted by positive and negative quarters of real GDP growth. We can observe that equity markets as well as the Value and Size factors generated positive returns in periods of economic growth and negative returns in periods of decline. The analysis highlights that the Value and Size factors, despite being long-short portfolios, might not be optimal diversifiers for an equity-centric portfolio given their pro-cyclical characteristics. Momentum shows higher returns in periods of economic decline than growth, which makes the factor more attractive from a diversification perspective.

Source: Fama-French, Federal Reserve Bank of St. Louis, FactorResearch
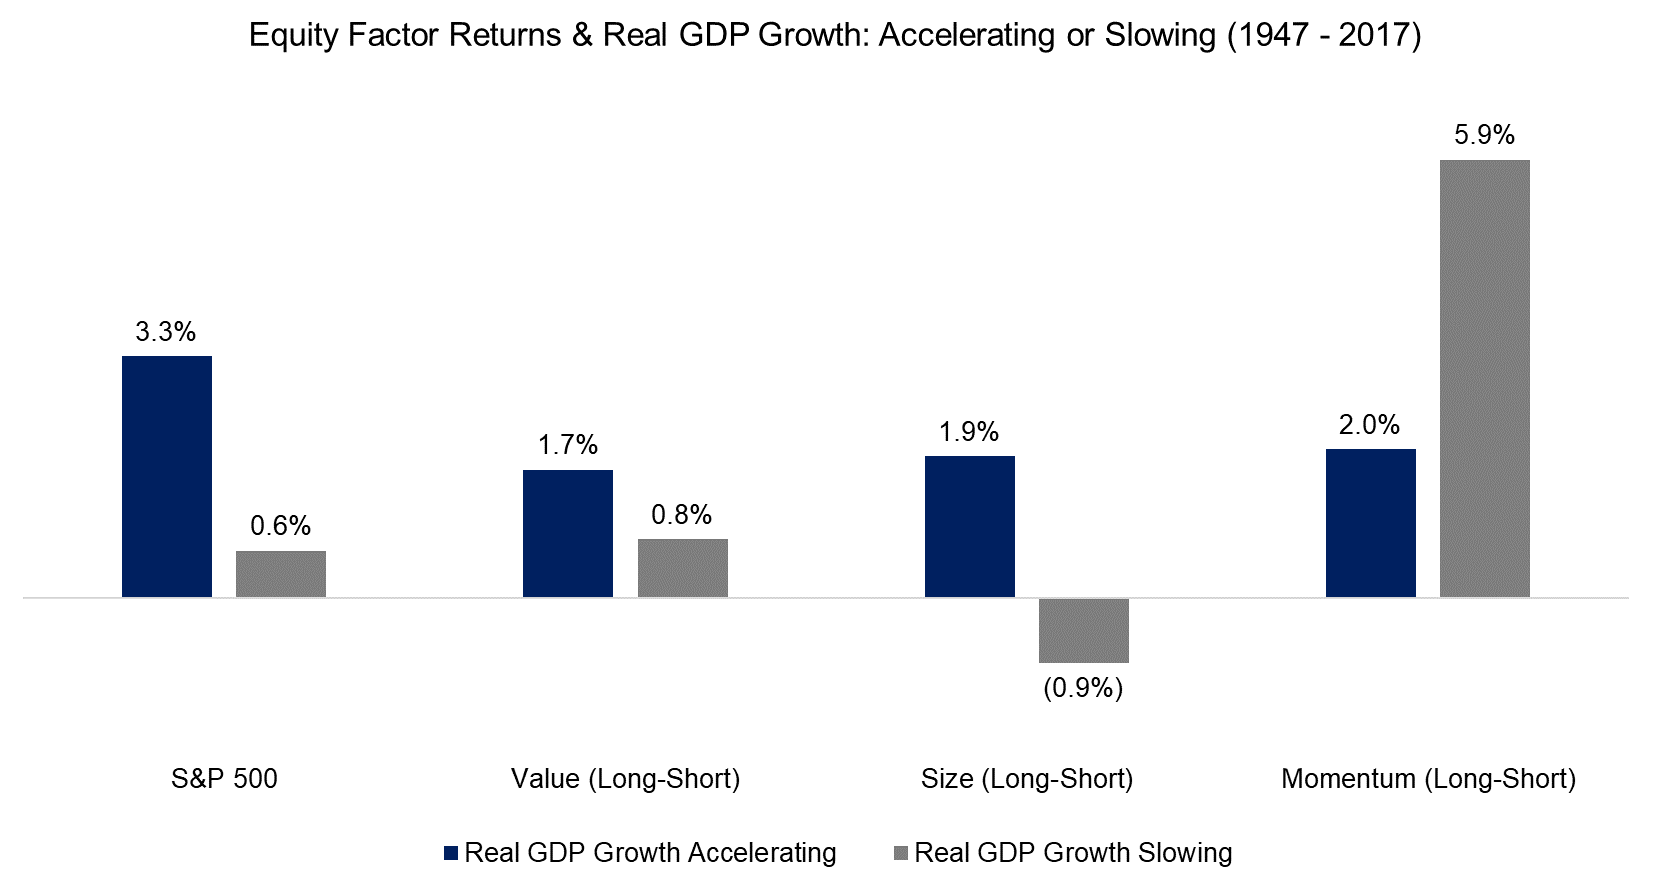
In addition to analysing the economy by periods of absolute positive and negative growth, we can also observe the factor performance in periods of acceleration and slowdown, which splits the observation period of 1947 to 2017 into an equal amount of quarters. The chart below highlights that the equity and long-short factor performance was positive on average and that only the Size factor was negatively impacted by declining growth. The analysis highlights again the pro-cyclical nature of the Value and Size factors.
Source: Federal Reserve Bank of St. Louis, FactorResearch
EQUITY FACTORS & REAL GDP GROWTH: 2000 – 2017
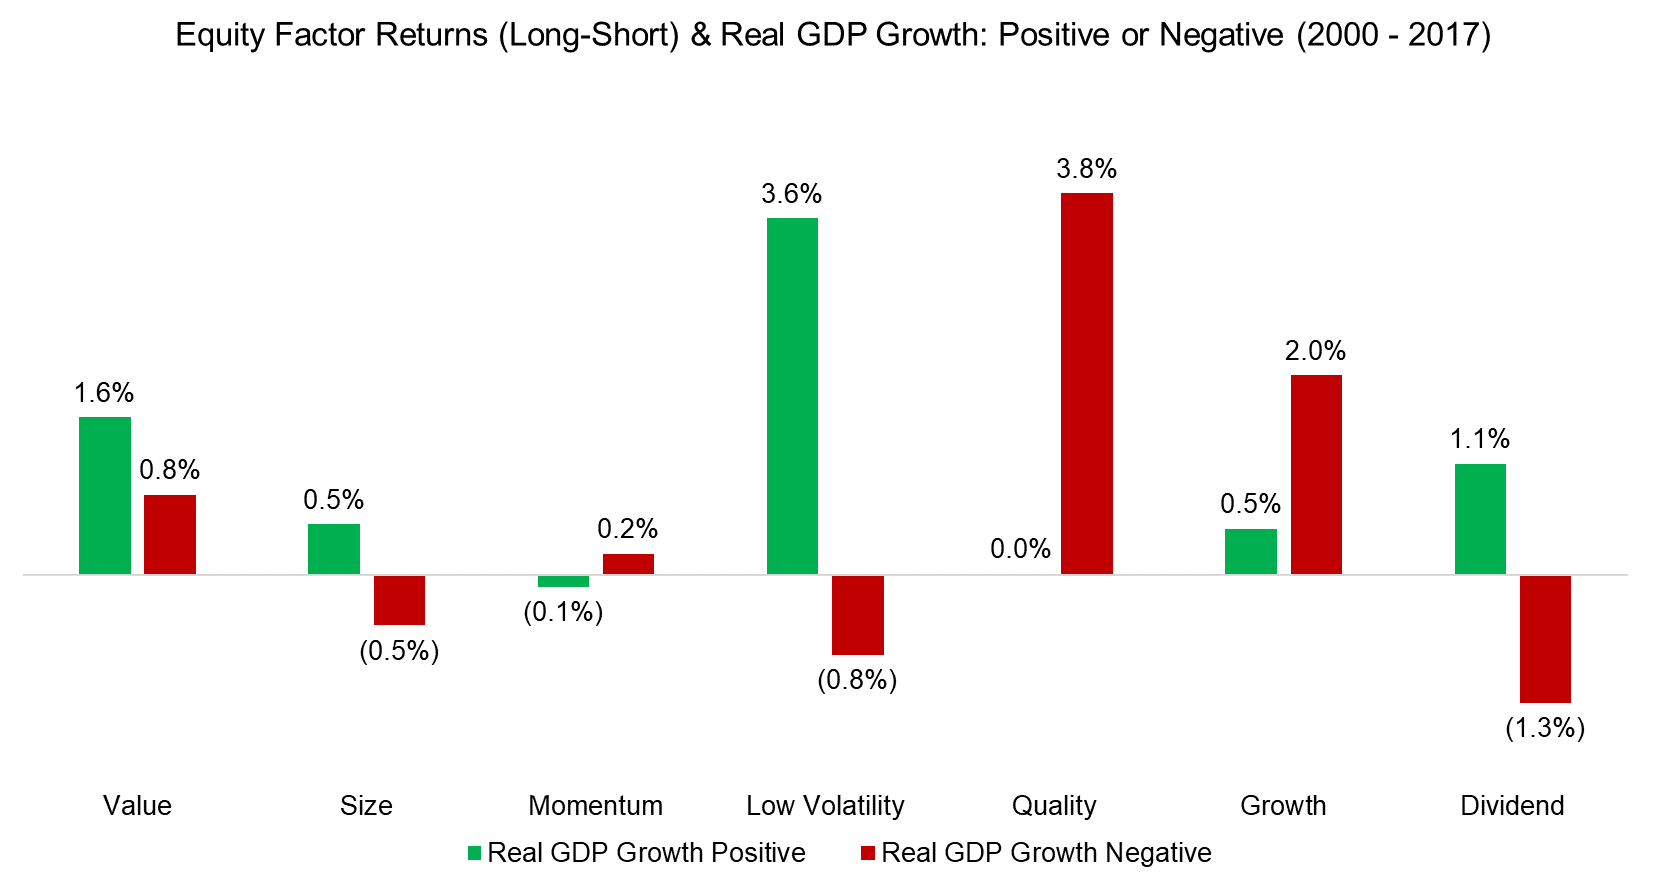
We can extend the analysis by adding additional factors, where data is available since 2000. The chart below shows the performance for seven factors from 2000 to 2017, which was quite heterogeneous when divided into periods of positive and negative real GDP growth. It’s worth highlighting that there were only 7 quarters of negative real GDP growth since 2000, so the results have to be taken with caution.
Source: Federal Reserve Bank of St. Louis, FactorResearch
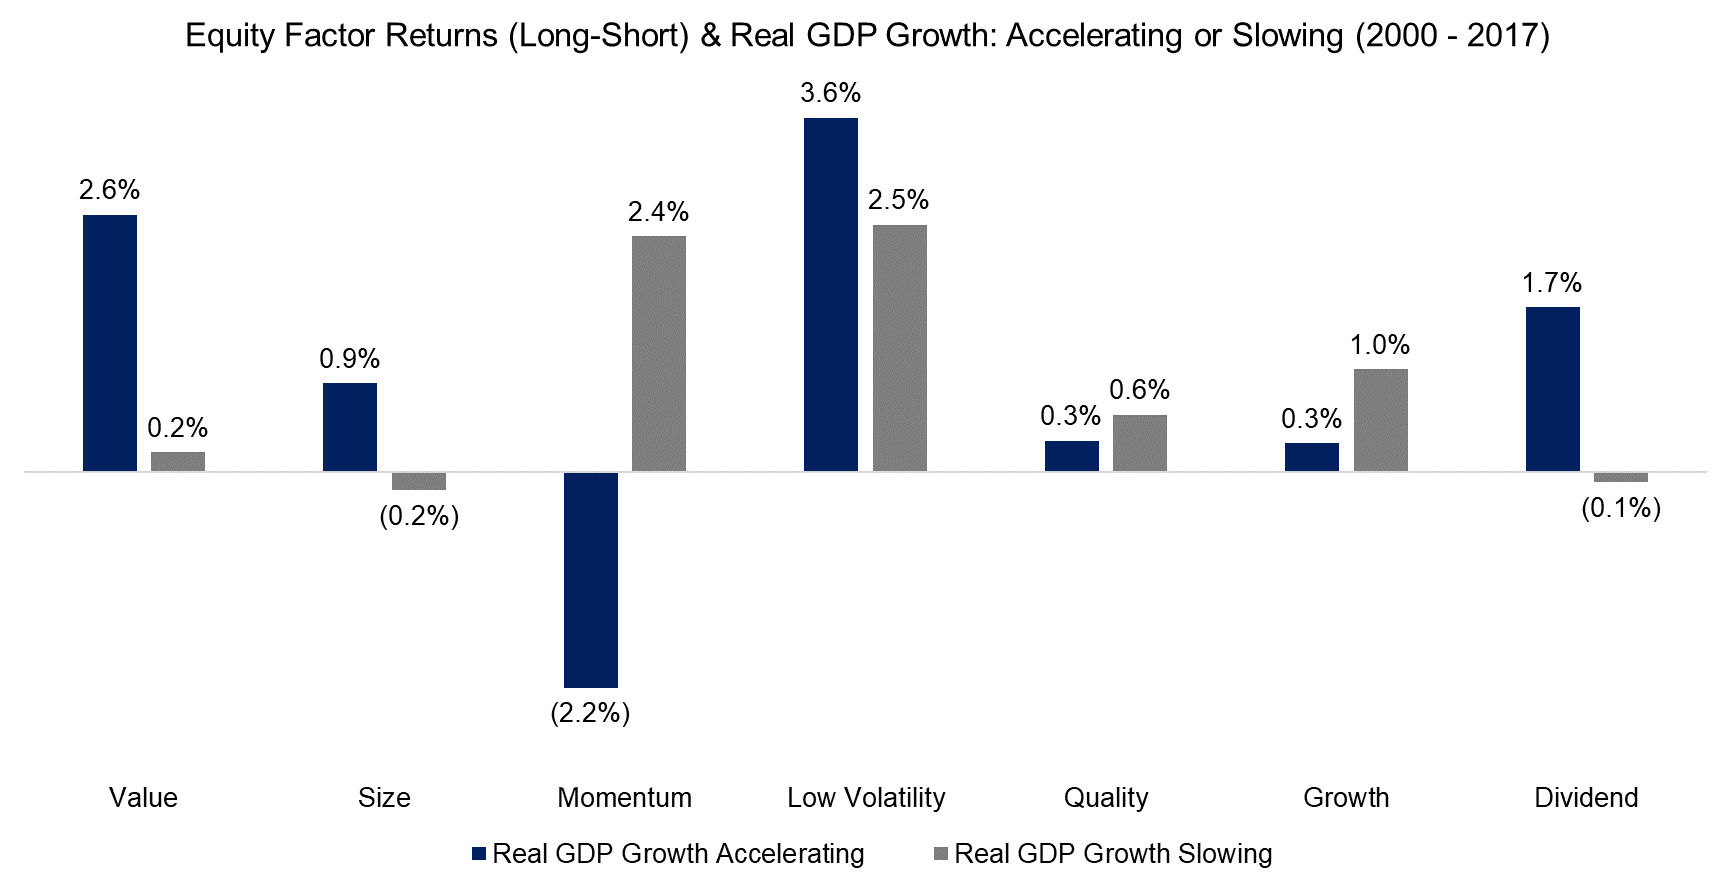
The chart below shows the factor performance in periods of real GDP acceleration and slowdown and we can observe again the slightly pro-cyclical nature of the Value and Size factors as well as the anti-cyclical nature of the Quality and Growth factors (read Factors: Correlation Check). The performance the Momentum factor during real GDP acceleration is significantly impacted by Q2 2009, where stock markets and the economy recovered from the Global Financial Crisis and the factor experienced its well-documented crash.
Source: Federal Reserve Bank of St. Louis, FactorResearch
DIVERSIFICATION FOR AN EQUITY-CENTRIC PORTFOLIO
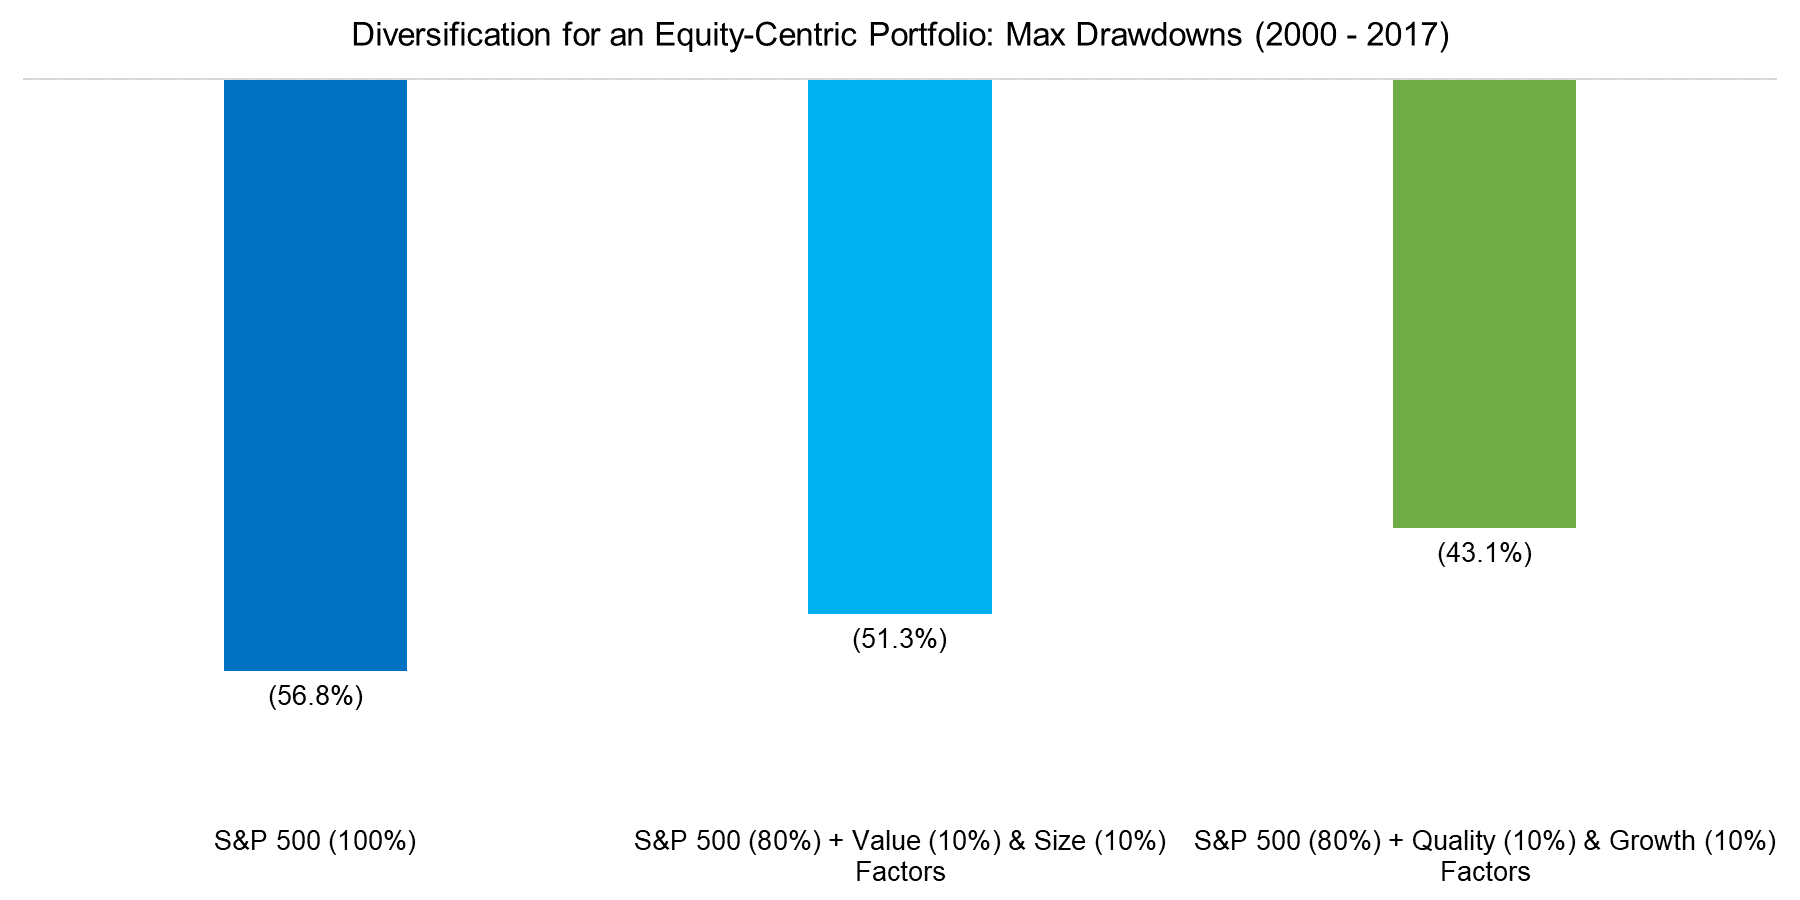
Given that factors exhibit different performance across economic cycles, investors can evaluate which factors offer most diversification benefits. Although there is a significant amount of empirical evidence suggesting that the Value factor generates attractive returns across time, it might not be the optimal factor for reducing the risk of an equity-centric portfolio from a drawdown perspective given its pro-cyclical nature. The analysis below compares the maximum drawdowns of the S&P 500 with two portfolios that include the S&P 500 and long-short factor portfolios. The combination of the S&P with Value and Size factors generated a higher drawdown than the combination with Quality and Growth factors, reflecting the pro- and anti-cyclical characteristics.
Source: FactorResearch
FURTHER THOUGHTS
This short research notes highlights the performance of common factors in different periods of real GDP growth and notes pro-cyclical and anti-cyclical characteristics. Naturally economic data does not tend to get published in real-time and is often revised, therefore can not be used directly for factor selection. However, there are potentially some leading indicators of real GDP growth that might be worth exploring from a factor risk management perspective, which is a topic for another research note.
ABOUT THE AUTHOR
Nicolas Rabener is the CEO & Founder of Finominal, which empowers professional investors with data, technology, and research insights to improve their investment outcomes. Previously he created Jackdaw Capital, an award-winning quantitative hedge fund. Before that Nicolas worked at GIC and Citigroup in London and New York. Nicolas holds a Master of Finance from HHL Leipzig Graduate School of Management, is a CAIA charter holder, and enjoys endurance sports (Ironman & 100km Ultramarathon).
Connect with me on LinkedIn or X.

