Equity vs Bond Indices
A Case for Active Management in Fixed Income?
November 2019. Reading Time: 10 Minutes. Author: Nicolas Rabener.
SUMMARY
- Bond indices are frequently portrayed as featuring a lower quality composition than equity indices
- Analysing equity and bond indices in the US and emerging markets confirms this view
- Perhaps this explains why there is some alpha generation in fixed income
INTRODUCTION
While almost all fund managers in equities across market segments underperform their benchmarks over time, the data for fixed income fund managers is more diverse and highlights pockets of alpha generation. For example, in the decade from 2008 to 2018, 80% of the fund managers focused on long-term US investment grade bonds underperformed their benchmark, but only 43% of the managers trading short-term bonds, according to the S&P SPIVA Scorecard for 2018.
A popular theory for higher alpha generation in fixed income over equities is a different index composition, which is as follows: In both asset classes, indices are typically created by ranking the universe of securities by their size and weighting these accordingly. In equities, this leads to companies dominating the index that have the best outlook in terms of growth, profitability, or both. In contrast, the largest weights in fixed income indices are from corporates or sovereigns that issue the most debt, which can be a reflection of low quality. Stated differently, stocks are weighted by investors while bonds are weighted by issuers.
However, this theory can be challenged as the amount of outstanding debt often relates to the size of the country, which is not a metric for measuring quality. For example, Greece has a much higher debt-to-GDP ratio than Germany, but the outstanding government debt of the Republic of Germany is more than five times the amount of the Hellenic Republic’s on an absolute basis.
In this short research note, we will compare the composition of stock and bond indices in the US and emerging markets.
EQUITY VERSUS BOND INDICES IN THE US
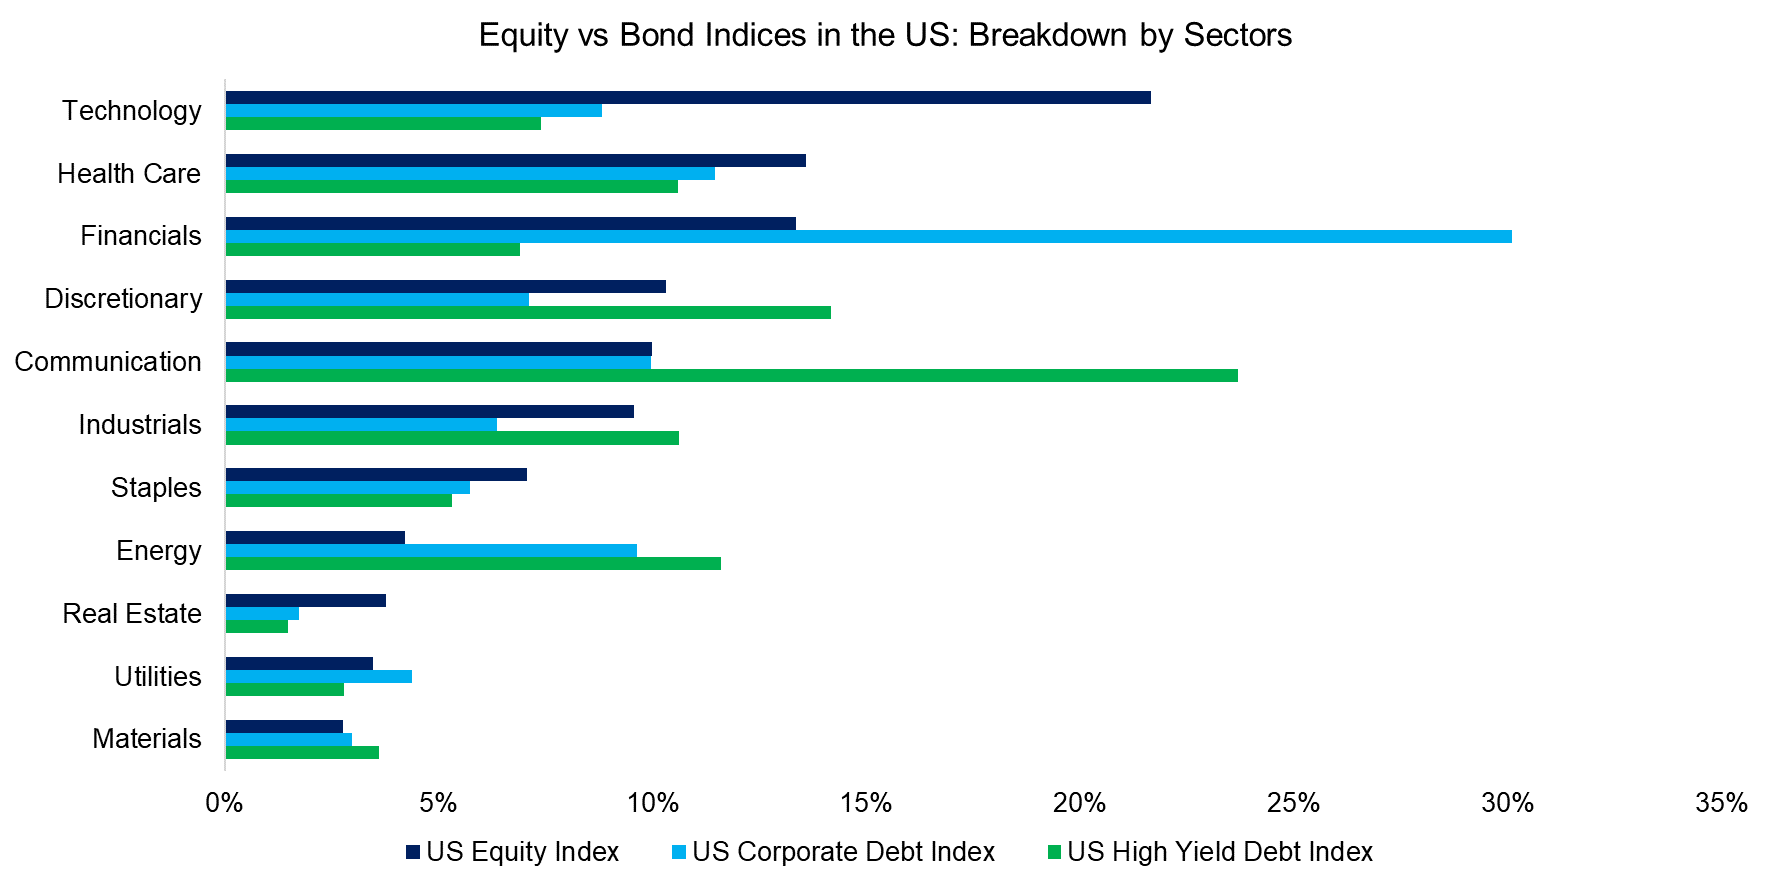
First, we analyse equity, corporate and high yield bond indices in the US by extracting data from ETFs that track benchmark indices like the S&P 500. A breakdown by sectors highlights significant differences in the portfolios. Specifically, equities are currently dominated by technology stocks, corporate bonds by financials, and high yield bonds by communication firms (read What’s in a Factor? Breakdown by Sectors).
The sector biases are explained by industry characteristics that do not change frequently. Equity investors expect strong growth from technology firms, which typically require relatively little debt for operations as well as often lack access to leverage given less certainty on their business models. In contrast, communication firms like the major telecom providers feature stable revenues and profits, but seem to have taken up too much debt over time, which explains why the sector features prominently in the high yield index.
Source: FactorResearch
Naturally bonds are less risky than equities as they have seniority when a company enters a bankruptcy process. We therefore do not focus on the absolute risk of owning equities versus bonds, but only on comparing the quality of the index constituents.
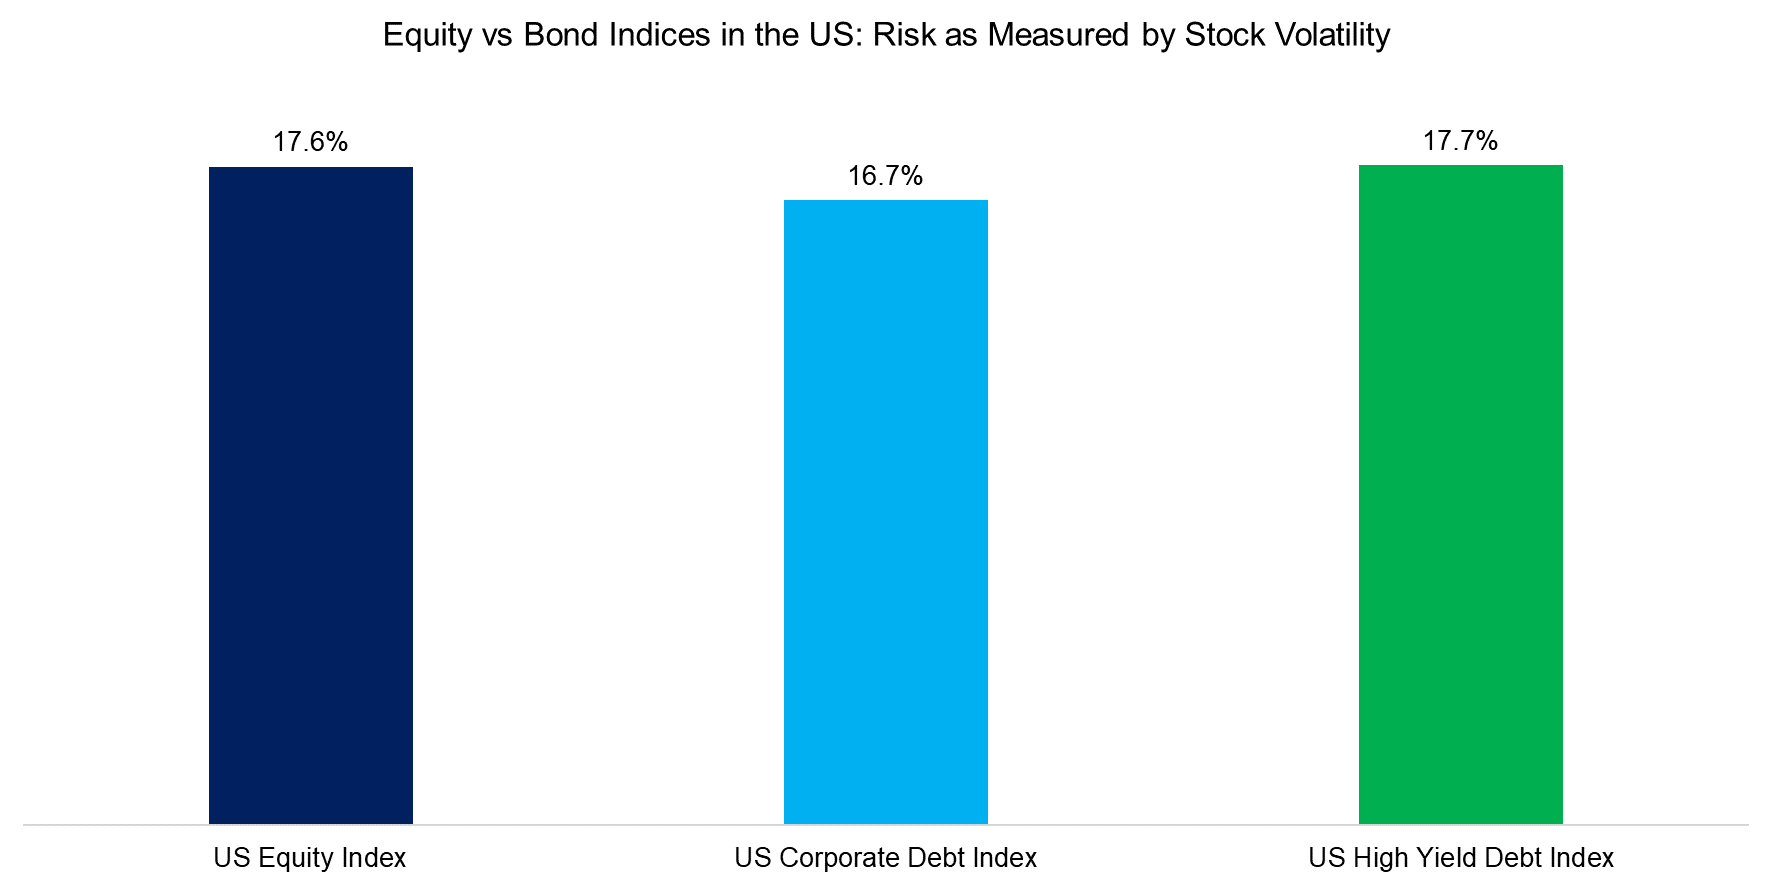
Quality typically represents the inverse of risk, i.e. the higher the quality of a security, the lower the risk. However, there are many ways of measuring the risk of a financial instrument. In equities, risk is measured by volatility or drawdowns on single-stock or index level. We compare the annual volatility of the three indices as perceived from the stock market perspective, which we calculate by aggregating the sector weights and sector volatility.
Unsurprisingly, the companies of the high yield index are riskier than those of an equity or corporate bond index, albeit only slightly. It is also intuitive that the constituents of the equity index are more volatile than those of the corporate bond index given a bias towards volatile technology stocks, although this is time-dependent.
It is worth noting that the analysis could be enhanced by measuring the volatility of each company in each index separately, assuming all are listed on a stock exchange, which would likely lead to an increase in the volatility profile of the high yield index.
Source: FactorResearch
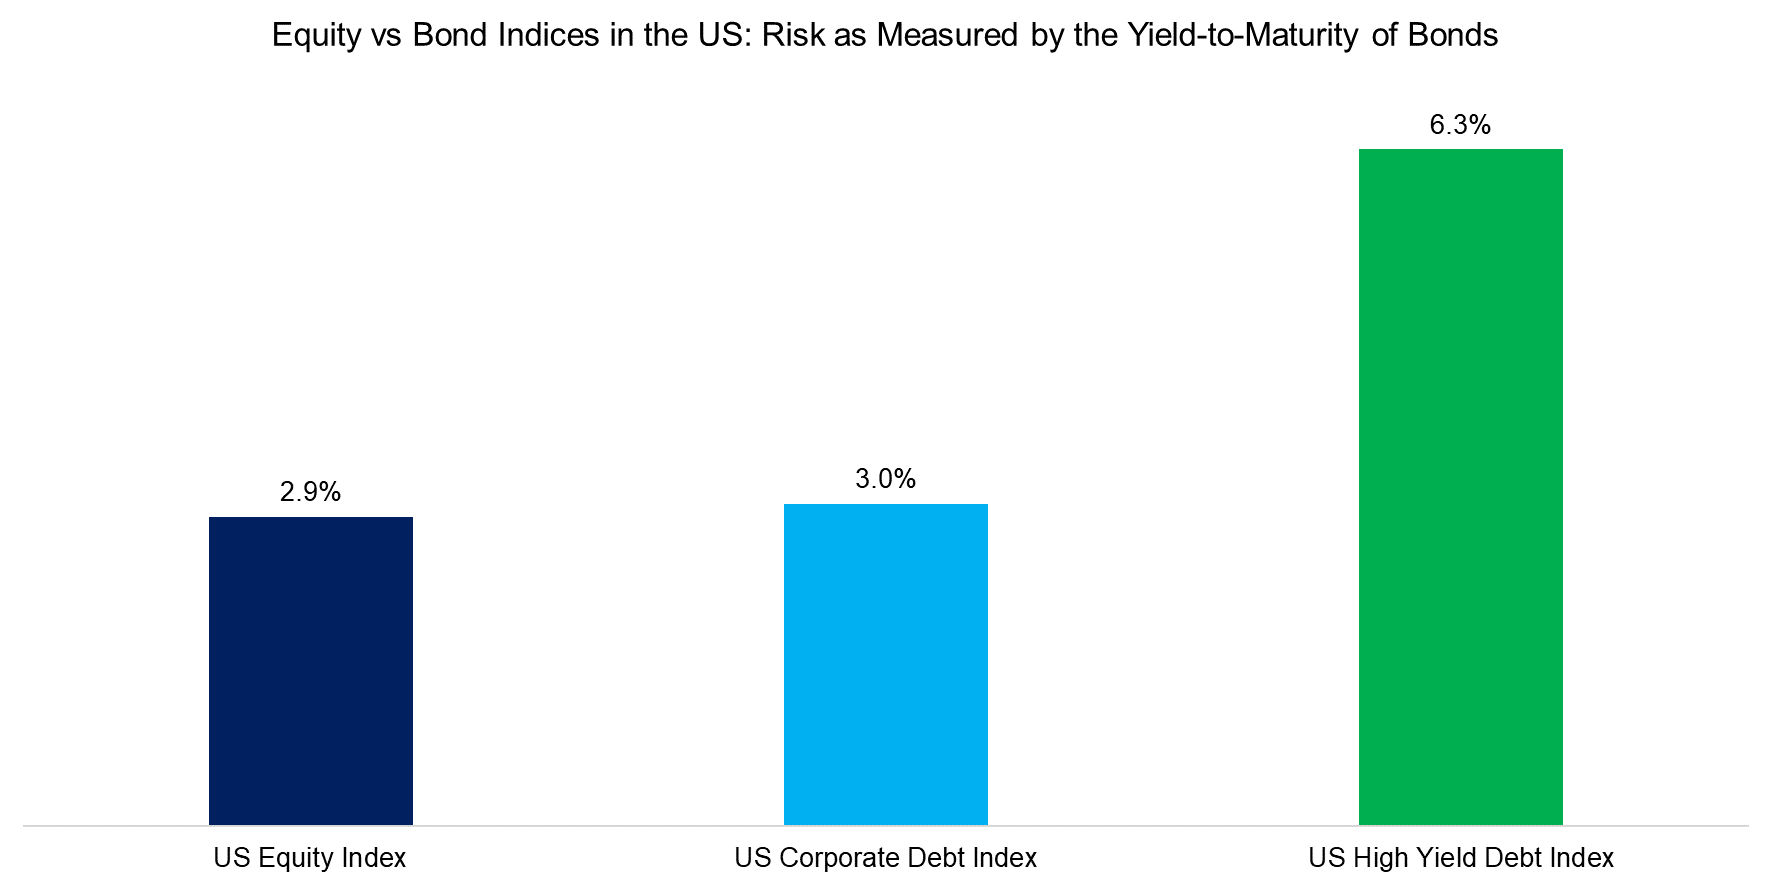
Next, we analyse the quality of the index compositions from a fixed income perspective by comparing the yield-to-maturity profiles. High yield bonds are most risky and therefore offer the highest yields, while the equity index is slightly less risky than the corporate bond index, which is explained by sector biases. Technology firms, which dominate the equity index, feature lower financing costs than financial firms, which represent the largest sector in the corporate bond index.
Source: FactorResearch
Comparing the quality of the constituents of equity and bond indices in the US results in different views, depending on how quality or risk is being defined.
EQUITY VS BOND INDICES IN EMERGING MARKETS
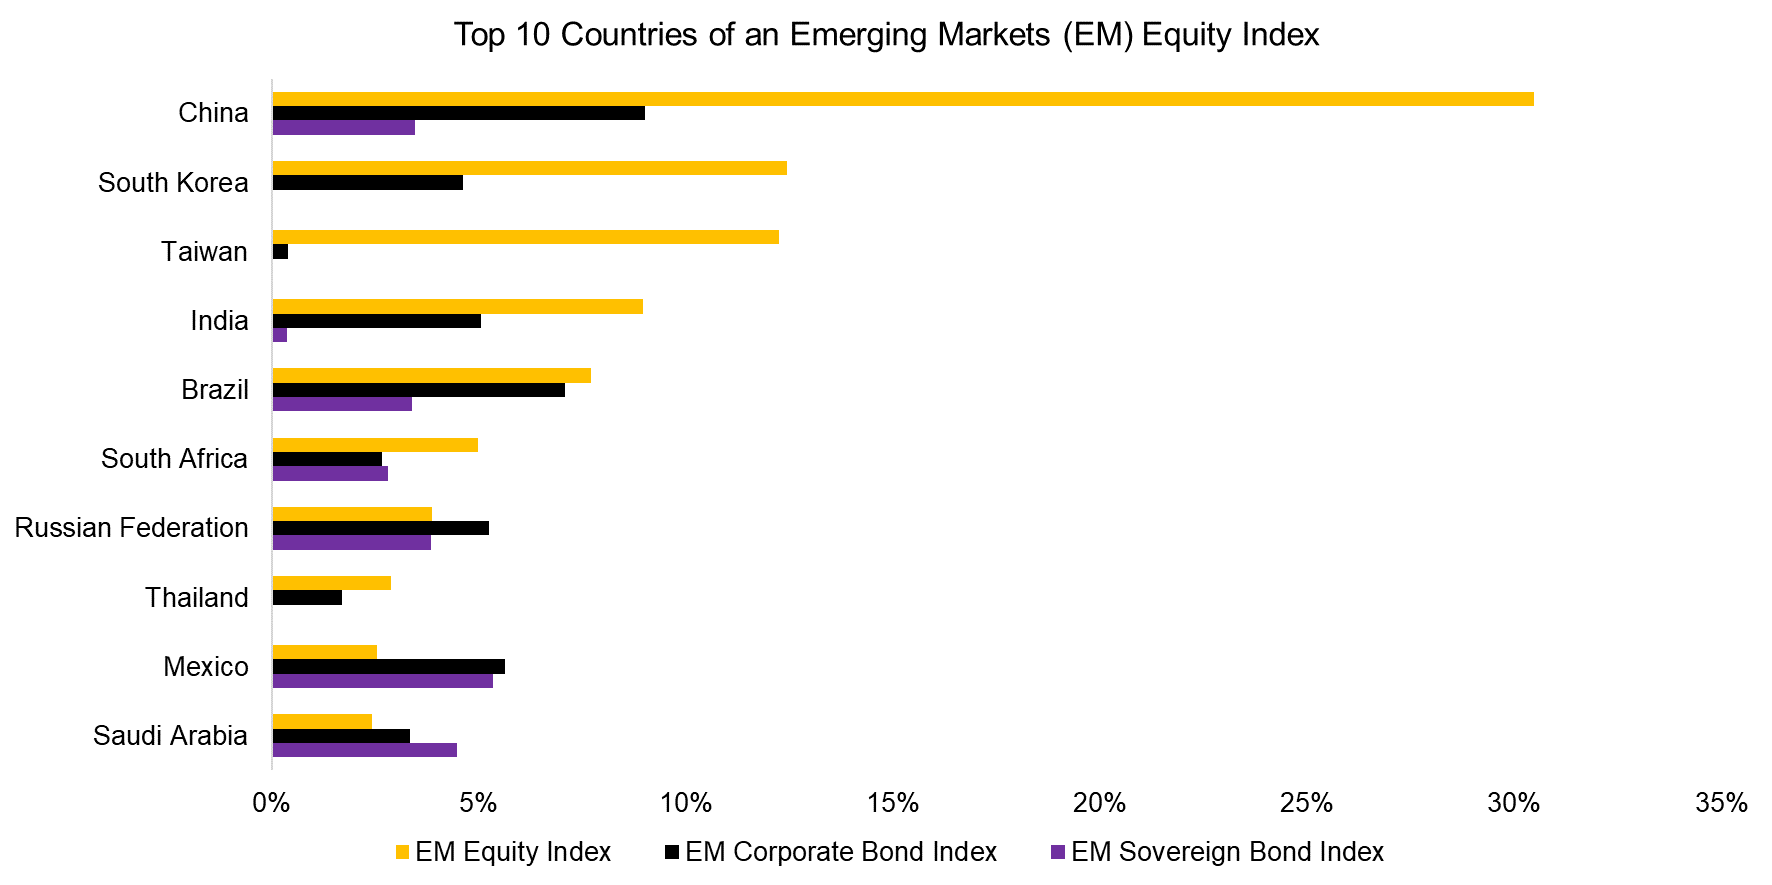
Secondly, we analyse equity, corporate and sovereign bond indices in emerging markets. We highlight the top ten countries of an emerging market stock index and observe that these countries have significantly lower weights in bond indices. China dominates the equity index by supplying 30% of the stocks, but only contributes 9% to the corporate and 3% to the sovereign bond index (read Factor Investing Made in China).
These weights are largely determined by index providers like MSCI and change as capital markets evolve. The Chinese stock market has become one of the largest equity markets globally and received a larger share in the emerging market benchmark indices in 2019. Similar increases are planned for bond benchmark indices, albeit only in 2020.
Source: FactorResearch
The corporate and sovereign bond indices in emerging markets have lower concentration risks to single countries than the equity index, but that does not necessarily represent higher quality.
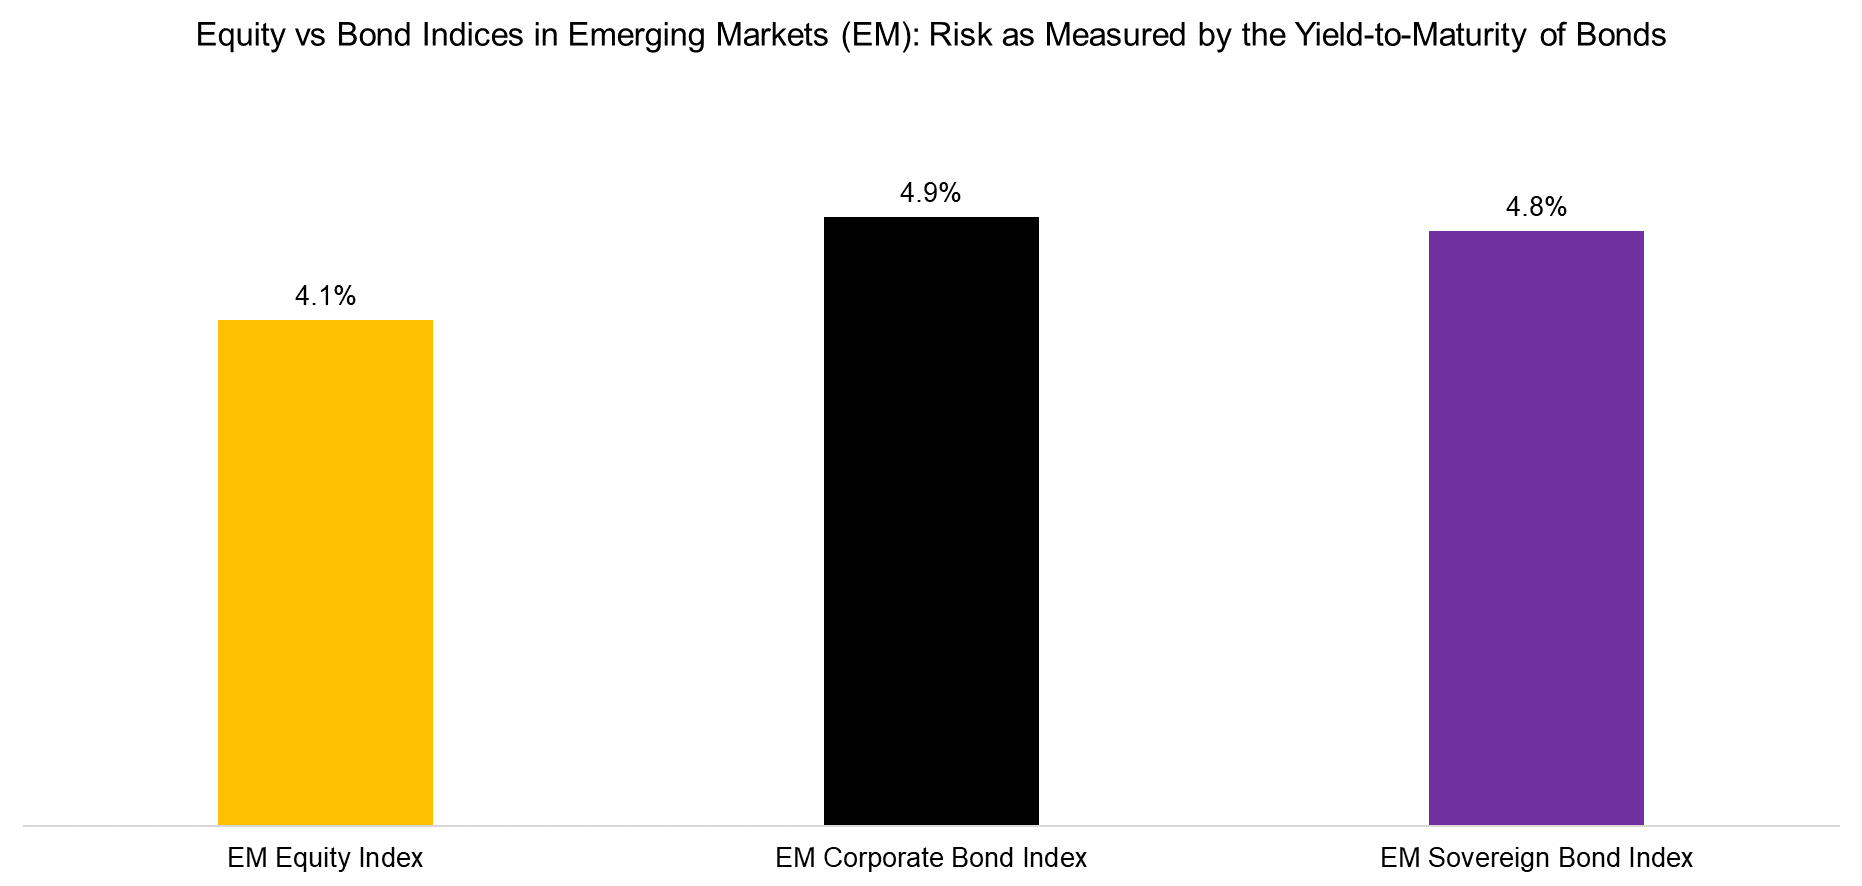
We calculate the weighted-average yield-to-maturity of the countries within the indices and observe that the equity index is less risky from this perspective, which is explained by the country weights. The top three countries in the equity index are China, Taiwan, and South Korea with a combined weight of 55%, which have lower financing costs than the countries with the largest weights in the bond indices, which are Mexico, Brazil, and Russia (excluding China).
Source: Kenneth R. French, FactorResearch
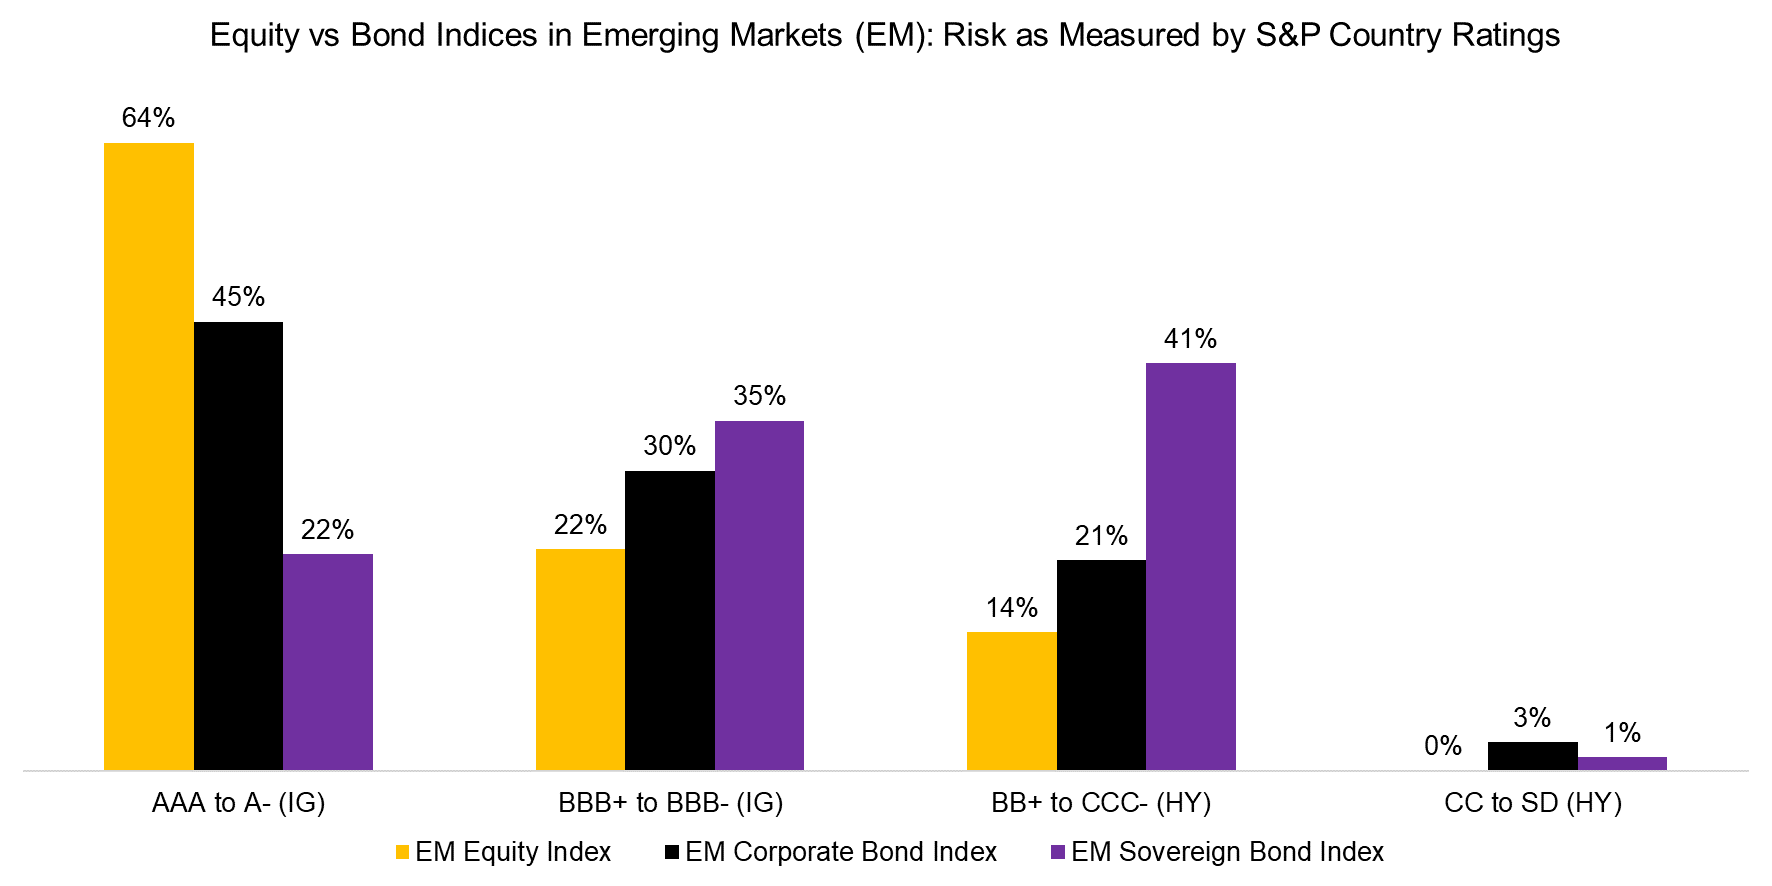
As an alternative measure to yields, we compare the indices by using credit ratings from Standards & Poor’s. However, this analysis essentially provides the same perspective that the equity index is comprised of countries that are less risky than those in bond indices. We observe that 86% of the exposure in an emerging market equity index is investment grade quality compared to 75% in corporate and only 57% of sovereign debt indices.
Source: FactorResearch
FURTHER THOUGHTS
This analysis supports bond fund managers making a case for active management in fixed income as bond indices feature compositions that are lower in quality than equity indices. However, focusing on higher-quality corporates and sovereigns does not necessarily result in higher returns, although it would likely reduce the risk of the bond indices compared to their benchmarks, which would increase risk-adjusted returns.
Unfortunately for bond fund managers, ETF issuers are considering fixed income as the next frontier for smart beta and are steadily launching products for the various market segments and geographies. Although the debate is ongoing if smart beta ETFs will disrupt active bond managers as dramatically as active equity fund managers, ETFs will capture market share and put pressure on management fees.
RELATED RESEARCH
REFERENCED RESEARCH
S&P SPIVA Score Cards
ABOUT THE AUTHOR
Nicolas Rabener is the CEO & Founder of Finominal, which empowers professional investors with data, technology, and research insights to improve their investment outcomes. Previously he created Jackdaw Capital, an award-winning quantitative hedge fund. Before that Nicolas worked at GIC and Citigroup in London and New York. Nicolas holds a Master of Finance from HHL Leipzig Graduate School of Management, is a CAIA charter holder, and enjoys endurance sports (Ironman & 100km Ultramarathon).
Connect with me on LinkedIn or X.

